12 Elm St · Cherry Valley, NY
Flood risk 1/10 · Minimal
- FEMA flood zone
- X (unshaded)
- Chance of flooding over 30 yrs
- 0.0%
- Est. flood insurance / yr
- $473 – $860
Fire risk 1/10 · Minimal
- Est. fire insurance / yr
- $691 – $1,283
Heat risk 1/10 · Minimal
- Hot days now (above 88°F)
- 7 days/yr
- Hot days in 30 yrs
- 17 days/yr
Wind risk 2/10 · Minimal
- Chance of severe wind over 30 yrs
- 1.0%
Air-quality risk 1/10 · Minimal
- Unhealthy air days now
- 0 days/yr
- Unhealthy air days in 30 yrs
- 0 days/yr
Risk factors via First Street. Map © Google.
Why this score? — see what drove the C- grade
The composite is a weighted blend of 9 inputs, each scored 0–100. Each bar is that input's sub-score; the figure is the points it added to the 100-point composite (weight × sub-score).
- Cash flow +14.9/30.0
- Appreciation +10.0/10.0
- ARV discount +5.8/15.0
- DSCR +4.6/10.0
- Schools +4.1/10.0
- 1% rule +3.9/10.0
- Livability +3.0/5.0
- Rent growth +2.5/5.0
- Condition / age +2.5/5.0
$150,000
🖨 Deal sheet 📄 Offer letter ✓ Due diligence
Listing remarks MLS
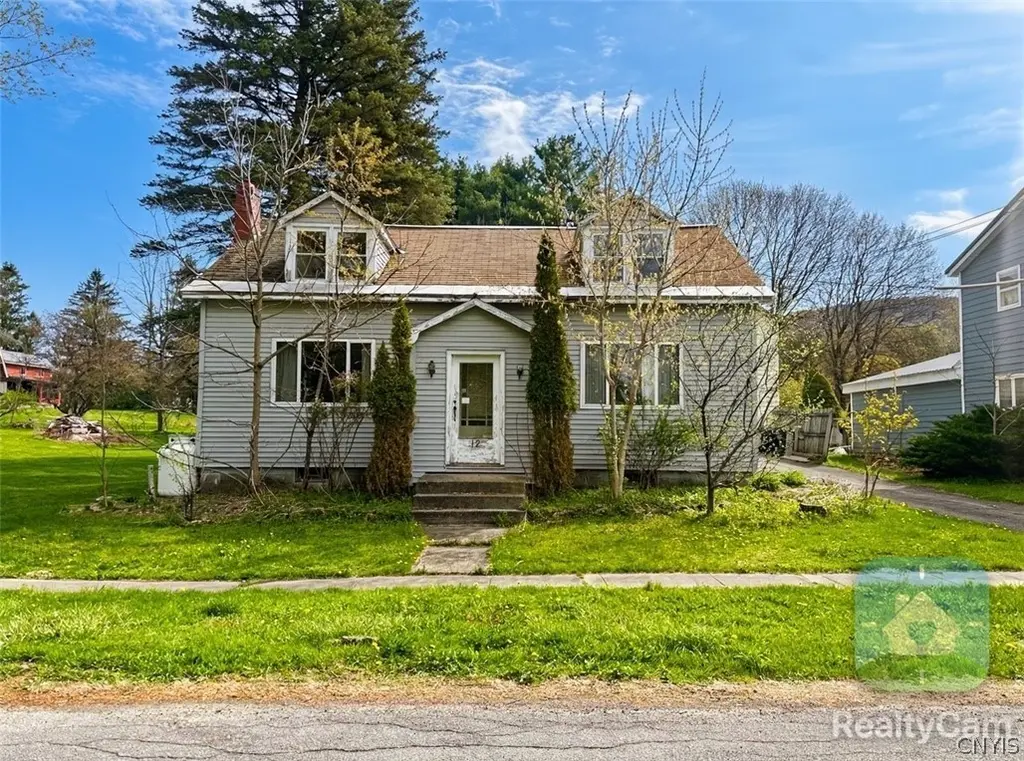
Cape Style Home in the Village of Historic Cherry Valley is waiting for your improvements and creative ideas. The home offers features including Fireplace, full Basement with potential for additional living space, Garage and nice back yard. Convenient to Village amenities. Buyers Premium
Key facts
- Large garage
- Full bathroom
- Living room
Tags
Property features AI
Exterior
- Parking: Detached garage; 2-car garage
- Utilities: Public water connected; Septic tank
- Home design: One-story appearance; Resale property
- Construction: Vinyl siding; Wood siding; Shingle, metal and flat roof types; Block foundation
- Exterior features: Blacktop driveway; Balcony; Deck; Shed(s)/storage
Interior
- Kitchen: Dishwasher; Gas oven; Gas range; Refrigerator
- Bedrooms: Bedroom on main level; One main-level bedroom; Two second-level bedrooms
- Flooring: Ceramic tile; Hardwood; Mixed/varied flooring
- Bathrooms: Two full bathrooms; One main-level bathroom
- Heating & cooling: Oil forced-air heating
- Interior features: Ceiling fans; Entrance foyer; Eat-in kitchen; Skylights
- Laundry & utility: Electric water heater
Neighborhood map
What this means for you Summary
Snapshot
- This is a 3-bed/2.0-bath single-family listed at $150k.
Deal economics
- At list price, monthly cash flow is $44 ($525/yr) — positive.
- The deal already cash-flows at list — no discount required.
- To meet the 1% rule (rent ≥ 1% of price), the offer needs to be $134k (10.7% below list).
- Recommended offer: $134k (10.7% below list) — sets the bar for 1% rule.
Location & tenants
- Location reads 60/100 on livability (#990 in NY) — a middle-class / working-renter tenant base. Strengths: housing A+, cost of living B+; Watch: schools C-, health & safety C-, employment D.
- Cherry Valley-Springfield Central School District (rural): math 45% / reading 45% proficiency, ranked #564 of 755 in NY (top 75%) — families likely to look elsewhere, expect single-tenant / working-renter base with shorter leases.
- Market conditions: 17 active listings in the ZIP; 133 units permitted in Otsego County in 2024 (10 in 5+ unit buildings).
Forward outlook
- In year one you build about $16k of equity ($1k loan paydown + $15k appreciation (10.0% local appreciation)).
- Otsego County population projected at -21% by 2050 — secular population decline; favor cash flow + early exit over multi-decade hold.
- At projected returns (10.0% appreciation + 3.0% rent growth), your $42k cash investment doubles in ~3 years — after that, you're playing with house money.
- By year 3, paydown + projected appreciation supports a ~$41k cash-out refi (75% LTV) — recoverable capital for the next deal without selling this one.
Negotiation context
- It's been on market 31 days — a 3% lower offer ($146k) is reasonable based on typical stale-listing flexibility.
- 6 sale attempts since 19y ago with the ask held roughly flat each time — persistent listings suggest the price (not the market) is what's stuck; bring a comps-based counter.
- Current owner paid $65k; list at $150k implies a 131% gain — meaningful room to come down on a strong offer.
Risks & watch-outs
- Watch-outs: built in 1954 — expect roof / HVAC / electrical / plumbing capex.
Questions for the listing agent
- It's been on market 31 days. Have you received any prior offers? Is the seller open to a 11% concession, seller financing, or rate buy-down credit?
- Built in 1954 — when were the roof, HVAC, electrical panel, plumbing, and water heater last replaced?
- Is there a deadline driving the sale (1031 exchange, divorce, estate, relocation)? That informs how much negotiation room exists.
- Crime grade is F in this area — have there been break-ins, vandalism, or insurance claims at this property in the last 3 years? What carrier currently insures it and at what premium?
- What's the average days-on-market for RENTAL listings here right now (not sales)? A rising rental-DOM trend means longer vacancies and softer asking-rent achievability than the comps imply.
- What's the recent tenant-quality profile in this submarket — average credit score on applications, eviction rate, late-payment / NSF rate, and stable-employment percentage? A property-management company in the area should have these aggregated.
- How much new for-sale + rental construction is in the pipeline within 1–3 miles? Heavy new supply typically softens prices + rents 12–24 months out; constrained supply supports both.
Investment metrics
- 1% rule
- 0.89% ✗
- Cap rate
- 6.64%
- Cash-on-cash
- 1.25%
- DSCR
- 1.06
- GRM
- 9.3
CMA / ARV
- ARV (on-the-fly)
- $144,450
- Comps found
- 1
Show comp detail 1 sale within ~0.75 mi
| Address | Dist | Beds/Ba | Sqft | Sold | Price | $/sf | Match |
|---|---|---|---|---|---|---|---|
| 69 Montgomery St | 0.25mi | 3/1.5 | 1,538 (+14%) | 12mo | $164,300 | $107 | 54 |
Match score weights: distance 35% · size 25% · config 20% · recency 20%. Top-matched comps best support the ARV.
Projected returns pro-forma
10.0% appreciation · 3.0% rent growth · sell at horizon
- IRR
- 25.2%
- Equity multiple
- 3.01×
- Total profit
- $84,488
- Equity at exit
- $135,132
- IRR
- 22.2%
- Equity multiple
- 6.87×
- Total profit
- $246,625
- Equity at exit
- $291,417
Cash invested: $42,000 (down + closing). Projections, not guarantees.
Landlord ↔ Tenant lean methodology
- Overall (STATE)
- 15 Strongly Tenant-Friendly
- State New York
- 15 Strongly Tenant-Friendly · D+10
- County
- — inherits STATE
- City
- — inherits STATE
ZIP-level market 13320
- Home prices YoY
- 2.4%
- Active inventory
- 17
- Price-to-rent
- 9.3×
Monthly cashflow live
- Estimated rent
- $1,339 medium interval (Pro) →
- Mortgage (P&I)
- −$787
- Tax from tax record
- −$165 /mo · $1,980/yr
- Insurance
- −$62
- HOA
- −$0
- Vacancy / Maint / Mgmt
- −$281
- Net cashflow
- $44
Break-even live
UW: 25.0% down · 7.5% · 30yr · 1.5% tax · 5.0% vac · 8.0% maint · 8.0% mgmt
Financing live
Cash to close
- Down payment
- $37,500
- Closing costs
- $4,500
- Reserves months
- —
- Total cash needed
- —
Loan-product check · same deal, 3 products live
Conventional
25% down · 7.5% · 30yr
- Down + closing
- —
- Monthly P&I
- —
- Monthly cashflow
- —
- DSCR
- —
- Eligible?
- —
Personal DTI + credit; lowest rate.
DSCR
20% down · 8.5% · 30yr
- Down + closing
- —
- Monthly P&I
- —
- Monthly cashflow
- —
- DSCR
- —
- Eligible?
- —
No personal income docs; deal must DSCR.
Hard money
10% down · 12.0% · 12mo
- Down + closing
- —
- Monthly P&I
- —
- Monthly cashflow
- —
- DSCR
- —
- Eligible?
- —
Short-term bridge; refi at stabilization.
Listing history 26 events
-
2026-06-18days on market $150,000 Active 31 DOM
-
2026-06-17days on market $150,000 Active 30 DOM
-
2026-06-16days on market $150,000 Active 29 DOM
-
2026-06-15days on market $150,000 Active 28 DOM
-
2026-06-13days on market $150,000 Active 26 DOM
-
2026-06-12days on market $150,000 Active 25 DOM
-
2026-06-09days on market $150,000 Active 22 DOM
-
2026-06-08days on market $150,000 Active 21 DOM
-
2026-06-07days on market $150,000 Active 20 DOM
-
2026-06-07days on market $150,000 Active 19 DOM
-
2026-06-04days on market $150,000 Active 16 DOM
-
2026-06-02days on market $150,000 Active 15 DOM
-
2026-06-01days on market $150,000 Active 14 DOM
-
2026-05-31days on market $150,000 Active 13 DOM
-
2026-05-18$150,000 Active
-
2015-05-29soldstatus $65,000 288-char remark
Show marketing remark (288 chars)
Cape Style Home in the Village of Historic Cherry Valley is waiting for your improvements and creative ideas. The home offers features including Fireplace, full Basement with potential for additional living space, Garage and nice back yard. Convenient to Village amenities. Buyers Premium
-
2015-03-27$59,280 288-char remark
Show marketing remark (288 chars)
Cape Style Home in the Village of Historic Cherry Valley is waiting for your improvements and creative ideas. The home offers features including Fireplace, full Basement with potential for additional living space, Garage and nice back yard. Convenient to Village amenities. Buyers Premium
-
2012-06-05historical
-
2012-03-13$127,500
-
2008-08-21soldstatus $115,000
-
2008-08-21soldstatus $115,000
-
2008-04-25$115,000
-
2008-04-22historical
-
2007-12-18$129,000
-
2007-07-14$109,000
-
2001-10-18soldstatus $71,000
ⓘ Source: listings_history table (triggers on properties + properties_extension) + one-shot
backfill from property_details.listing_events for pre-trigger history.
Tax reassessment forecast NY · Partial reset (capped growth)
- Current annual tax
- $1,980 · $165/mo
- Projected year-2 tax
- $2,258 · $188/mo
- Expected delta
- +$277/yr (+$23/mo · 14.0%)
ⓘ Screening estimate from a state-policy table — verify with the county assessor before closing.
Climate risk First Street
- Flood 1/10 Low FEMA zone X (unshaded) · 0% chance over 30 yrs
- Wildfire 1/10 Low
- Heat 1/10 Low 7 d/yr ≥88°F today · 17 d/yr by 30 yrs out
- Wind 2/10 Low 100% chance of damaging wind over 30 yrs
- Air quality 1/10 Low 0 unhealthy d/yr today · 0 by 30 yrs out
Nearby sold comps map
Loading sold comps map…
Walkable amenities ~0.75 mi
Loading nearby amenities…
Taxation est. · year 1
- Rental income
- $16,070
- − Mortgage interest
- −$8,402
- − Property taxes
- −$1,980
- − Insurance
- −$750
- − Repairs & maintenance
- −$1,286
- − Management
- −$1,286
- − Depreciation
- −$4,364
- Taxable loss
- −$1,998
- Est. tax savings @ 24.0%
- +$479
- After-tax cash flow
- $1,005/yr
For passive investors: Depreciation is non-cash, so a rental often shows a tax loss while cash-flowing — sheltering income. Rental losses are passive: they offset passive income freely, and up to $25,000/yr can offset ordinary (W-2) income if you actively participate and your MAGI is under $100k (phasing out to $0 by $150k); unused losses carry forward. On sale, claimed depreciation is recaptured at up to 25%, and gains may owe capital-gains tax (a 1031 exchange can defer both). Figures are a year-1 estimate at your 24.0% rate — not tax advice; consult a CPA.
Schools (NCES district)
- District
- Cherry Valley-Springfield Central School District
- NCES district ID
- 3600006
- Math proficiency
- 45% ▲ 5.00%
- Reading proficiency
- 45% ▲ 10.00%
- Median HH income
- $49,619
- Composite
- 40.82/100
- National rank
- #7553
- State rank
- #564 of 755 in NY
Livability — Cherry Valley
- Score
- 60/100
- State rank
- #990
- US rank
- #19371
Category grades
Schools grade is shown separately in the Schools card above.
Census & demographics
- Census place
- Cherry Valley, NY
- Population (ZIP)
- 2,027
Population outlook (Otsego County) Hauer SSP2
- Today (2025)
- 57,987 people
- By 2030
- 55,403 · -4.5%
- By 2040
- 50,336 · -13.2%
- By 2050
- 45,715 · -21.2%
- By 2075
- 38,769 · -33.1%
- By 2100
- 33,468 · -42.3%
Race, ethnicity, and origin ACS 2023
- Neighborhood character
- Predominantly White (96%)
- Race & ethnicity
- White 96% Two or more races 2% Hispanic / Latino 2%
- Common ancestry
- Iranian 8% Romanian 4% Italian 4%
- Foreign-born
- 3% · Canada, Jamaica
- Languages at home
- 93% English-only · German/W. Germanic 5% Spanish 1%
Political lean MEDSL · Otsego
- 2024 margin
- Lean R (+7.9) · D 46.1% · R 53.9%
- 2008→2024 swing
- -13.8pp toward R · 2008: 5.9pp · 2024: -7.9pp
- All cycles
- 2024: R+7.9 2020: R+5.0 2016: R+13.0 2012: D+2.0 2008: D+5.9
Not yet ingested
- Civics
- —
Market trends
- HPI YoY
- ▲ 10.81%
- Current HPI
- 462.6521
- Rent YoY
- —
- Metro
- —
- State GDP YoY
- ▲ 2.60%
- F500 in state
- 92
Industry mix (Fortune 500 HQ in NY)
| Industry | F500 HQs | Revenue |
|---|---|---|
| Financial Services | 10 | $950B |
|
||
| Consumer Goods | 9 | $162B |
|
||
| Insurance | 4 | $225B |
|
||
| Telecommunications | 2 | $144B |
|
||
| Pharmaceuticals | 2 | $112B |
|
||
| Media / Entertainment | 2 | $69B |
|
||
Price history
+111.3% since first listed12 events — show timeline
- 2026-05-18 Listed $150,000 CNYIS
- 2015-05-29 Sold (MLS) $65,000 UNYREIS
- 2015-03-27 Listed $59,280 UNYREIS
- 2012-06-05 Listing Removed — UNYREIS
- 2012-03-13 Listed $127,500 UNYREIS
- 2008-08-21 Sold (Public Records) $115,000 Public Records
- 2008-08-21 Sold (MLS) $115,000 UNYREIS
- 2008-04-25 Listed $115,000 UNYREIS
- 2008-04-22 Listing Removed — UNYREIS
- 2007-12-18 Listed $129,000 UNYREIS
- 2007-07-14 Listed $109,000 UNYREIS
- 2001-10-18 Sold (Public Records) $71,000 Public Records
Property tax history
-2.4%/yrLatest (2025): $1,980 · +21.1% YoY. Source: county tax records.
Cash-flow waterfall
monthlySold comps — $/sqft
last 12 mo · ≤1 miLoading sold comps…