 🏗️ New Construction
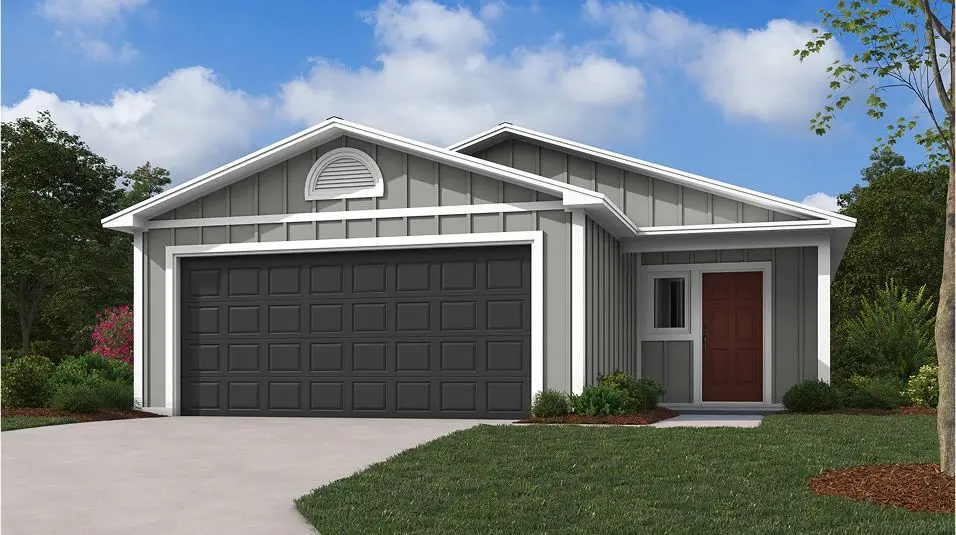
RC Keswick Plan · San Antonio, TX
Flood risk No data
- FEMA flood zone
- —
- Chance of flooding over 30 yrs
- —
- Est. flood insurance / yr
- —
Fire risk No data
- Est. fire insurance / yr
- —
Heat risk No data
- Hot days now (above threshold)
- —
- Hot days in 30 yrs
- —
Wind risk No data
- Chance of severe wind over 30 yrs
- —
Air-quality risk No data
- Unhealthy air days now
- —
- Unhealthy air days in 30 yrs
- —
Risk factors via First Street. Map © Google.
Why this score? — see what drove the C+ grade
The composite is a weighted blend of 9 inputs, each scored 0–100. Each bar is that input's sub-score; the figure is the points it added to the 100-point composite (weight × sub-score).
- Cash flow +24.7/30.0
- DSCR +8.0/10.0
- ARV discount +7.5/15.0
- 1% rule +6.4/10.0
- Condition / age +5.0/5.0
- Livability +4.0/5.0
- Rent growth +3.6/5.0
- Schools +1.9/10.0
- Appreciation +0.0/10.0
$209,900
🖨 Deal sheet 📄 Offer letter ✓ Due diligence
Listing remarks MLS
This single-story home is designed for modern lifestyles. A spacious and flexible open-concept layout combines the kitchen, living and dining areas to maximize interior space. One bedroom is tucked away to the side, with two additional bedrooms located at the back of the home, including the lavish owner's suite with a full bathroom and walk-in closet.
Key facts
- Full bathroom
- Walk-in closet
- Owner's suite
Tags
Neighborhood map
What this means for you Summary
Snapshot
- This is a 3-bed/2.0-bath single-family listed at $210k. Condition is rated excellent.
Deal economics
- At list price, monthly cash flow is $408 ($5k/yr) — positive.
- The deal already cash-flows at list — no discount required.
- Meets the 1% rule at list price ($2k rent vs $210k).
- Recommended offer: $185k (12.0% below list) — sets the bar for market timing.
- Cap rate 8.8% vs local median 3.8% in San Antonio — top-decile yield for the area; either an underpriced asset or a hidden risk that comps aren't pricing in. Stress-test before assuming the spread holds.
Location & tenants
- Location reads 80/100 on livability (#31 in TX, #1,616 nationally) — a professional / high-income tenant draw. Strengths: amenities A+, commute A+, cost of living A+; Watch: schools C-, crime F.
- East Central ISD (rural): math 16% / reading 25% proficiency, ranked #758 of 826 in TX (top 92%) — low school quality limits family demand, transient renter base, plan for 1-2y turnover; 61% free/reduced lunch — lower-income household profile, screen leases tightly.
- Market conditions: Rents rising fast (+4.3%/yr); 428 active listings in the ZIP; 4 comparable units currently listed for rent nearby; rentals at typical pace (median 24d on market — plan ~3-4 weeks tenant-placement turnaround); 8,308 units permitted in Bexar County in 2024 (2,506 in 5+ unit buildings).
- This rent runs 40% of the median local income ($66k/yr) — at the standard rent-burdened threshold; future hikes will face affordability resistance.
Forward outlook
- Local home prices are declining (-3.0%/yr); year-one equity from $1k of loan paydown is wiped out by about $6k of value loss. Plan a longer hold.
- Bexar County population projected at +50% by 2050 — long-run rental-demand tailwind backs the buy-and-hold thesis.
- At projected returns (-3.0% appreciation + 4.3% rent growth), your $55k cash investment doubles in ~10 years — after that, you're playing with house money.
Negotiation context
- It's been on market 421 days — a 12% lower offer ($185k) is reasonable based on typical stale-listing flexibility.
Questions for the listing agent
- It's been on market 421 days. Have you received any prior offers? Is the seller open to a 12% concession, seller financing, or rate buy-down credit?
- Why hasn't it sold? Are there any deal-killer items the seller is aware of (foundation, flood, title, zoning, code violations)?
- Is there a deadline driving the sale (1031 exchange, divorce, estate, relocation)? That informs how much negotiation room exists.
- Crime grade is F in this area — have there been break-ins, vandalism, or insurance claims at this property in the last 3 years? What carrier currently insures it and at what premium?
- What's the average days-on-market for RENTAL listings here right now (not sales)? A rising rental-DOM trend means longer vacancies and softer asking-rent achievability than the comps imply.
- What's the recent tenant-quality profile in this submarket — average credit score on applications, eviction rate, late-payment / NSF rate, and stable-employment percentage? A property-management company in the area should have these aggregated.
- How much new for-sale + rental construction is in the pipeline within 1–3 miles? Heavy new supply typically softens prices + rents 12–24 months out; constrained supply supports both.
Investment metrics
- 1% rule
- 1.14% ✓
- Cap rate
- 8.79%
- Cash-on-cash
- 8.92%
- DSCR
- 1.40
- GRM
- 7.3
CMA / ARV
- ARV (median comp)
- $196,009
- List price
- $209,900
- Delta
- 7.09%
- Verdict
- FAIR
- Comps
- 20 within 1.0 mi
Show comp detail 12 sales within ~0.75 mi
| Address | Dist | Beds/Ba | Sqft | Sold | Price | $/sf | Match |
|---|---|---|---|---|---|---|---|
| 5731 Falcon Pt | 0.10mi | 3/2.0 | 1,051 (0%) | 13mo | $184,818 | $176 | 85 |
| 8807 Osprey Trl | 0.11mi | 3/2.0 | 1,051 (0%) | 12mo | $217,965 | $207 | 85 |
| 5727 Coopers Xing | 0.10mi | 3/2.0 | 1,127 (+7%) | 8mo | $169,000 | $150 | 77 |
| 8719 Caracara Crst | 0.08mi | 3/2.0 | 1,125 (+7%) | 12mo | $179,256 | $159 | 74 |
| 5735 Falcon Pt | 0.07mi | 3/2.0 | 1,125 (+7%) | 13mo | $174,290 | $155 | 74 |
| 8715 Caracara Crst | 0.08mi | 3/2.0 | 1,125 (+7%) | 13mo | $172,584 | $153 | 74 |
| 8730 Broad Wing Dr | 0.13mi | 3/2.0 | 1,012 (-4%) | 19mo | $209,900 | $207 | 72 |
| 5726 Falcon Pt | 0.10mi | 3/2.0 | 1,125 (+7%) | 18mo | $202,730 | $180 | 69 |
| 5703 Coopers Xing | 0.08mi | 3/2.0 | 1,125 (+7%) | 19mo | $199,900 | $178 | 68 |
| 8940 Broad Wing Dr | 0.24mi | 3/2.0 | 1,012 (-4%) | 18mo | $204,900 | $202 | 67 |
| 5715 Coopers Xing | 0.09mi | 3/2.0 | 1,125 (+7%) | 20mo | $204,555 | $182 | 67 |
| 8952 Broad Wing Dr | 0.26mi | 3/2.0 | 1,012 (-4%) | 21mo | $206,900 | $204 | 64 |
Match score weights: distance 35% · size 25% · config 20% · recency 20%. Top-matched comps best support the ARV.
Projected returns pro-forma
-3.0% appreciation · 4.35% rent growth · sell at horizon
- IRR
- -1.3%
- Equity multiple
- 0.95×
- Total profit
- $-2,660
- Equity at exit
- $29,226
- IRR
- 9.8%
- Equity multiple
- 1.81×
- Total profit
- $44,252
- Equity at exit
- $16,947
Cash invested: $54,883 (down + closing). Projections, not guarantees.
Landlord ↔ Tenant lean methodology
- Overall (STATE)
- 87 Strongly Landlord-Friendly
- State Texas
- 87 Strongly Landlord-Friendly · R+5
- County
- — inherits STATE
- City
- — inherits STATE
ZIP-level market 78222
- Home prices YoY
- -4.8%
- Rents YoY
- 4.3%
- Active inventory
- 428
- Price-to-rent
- 7.8×
Monthly cashflow live
- Estimated rent
- $2,231 medium interval (Pro) →
- Mortgage (P&I)
- −$1,028
- Tax est. 1.5%
- −$245 /mo · $2,940/yr
- Insurance
- −$82
- HOA
- −$0
- Vacancy / Maint / Mgmt
- −$469
- Net cashflow
- $408
Break-even live
UW: 25.0% down · 7.5% · 30yr · 1.5% tax · 5.0% vac · 8.0% maint · 8.0% mgmt
Financing live
Cash to close
- Down payment
- $49,002
- Closing costs
- $5,880
- Reserves months
- —
- Total cash needed
- —
Loan-product check · same deal, 3 products live
Conventional
25% down · 7.5% · 30yr
- Down + closing
- —
- Monthly P&I
- —
- Monthly cashflow
- —
- DSCR
- —
- Eligible?
- —
Personal DTI + credit; lowest rate.
DSCR
20% down · 8.5% · 30yr
- Down + closing
- —
- Monthly P&I
- —
- Monthly cashflow
- —
- DSCR
- —
- Eligible?
- —
No personal income docs; deal must DSCR.
Hard money
10% down · 12.0% · 12mo
- Down + closing
- —
- Monthly P&I
- —
- Monthly cashflow
- —
- DSCR
- —
- Eligible?
- —
Short-term bridge; refi at stabilization.
Rent comps 4 comps
| Address | Beds | Baths | Sqft | Rent | $/sqft | DOM | Units | Dist |
|---|---|---|---|---|---|---|---|---|
| 5727 Coopers Xing San Antonio, TX | 3.0 | 2.0 | 1127 | $2,400 | $2.13 | 22d | 1 | 0.13mi |
| 7814 Annex St San Antonio, TX | 3.0 | 2.0 | 1459 | $1,600 | $1.10 | 24d | 1 | 1.42mi |
| 10534 Green Rock Dr San Antonio, TX | 3.0 | 2.5 | 1311 | $1,700 | $1.30 | 43d | 1 | 1.45mi |
| 7246 Meadow Acres San Antonio, TX | 3.0 | 2.0 | 1450 | $1,470 | $1.01 | 24d | 1 | 1.49mi |
Listing history 14 events
-
2026-06-18days on market $209,900 Active 421 DOM
-
2026-06-17days on market $209,900 Active 420 DOM
-
2026-06-16days on market $209,900 Active 419 DOM
-
2026-06-15days on market $209,900 Active 418 DOM
-
2026-06-13days on market $209,900 Active 416 DOM
-
2026-06-09days on market $209,900 Active 412 DOM
-
2026-06-08days on market $209,900 Active 411 DOM
-
2026-06-07days on market $209,900 Active 410 DOM
-
2026-06-04days on market $209,900 Active 407 DOM
-
2026-06-03days on market $209,900 Active 406 DOM
-
2026-06-02days on market $209,900 Active 405 DOM
-
2026-06-01days on market $209,900 Active 404 DOM
-
2026-05-31days on market $209,900 Active 403 DOM
-
2025-04-24$209,900 Active 353-char remark
Show marketing remark (353 chars)
This single-story home is designed for modern lifestyles. A spacious and flexible open-concept layout combines the kitchen, living and dining areas to maximize interior space. One bedroom is tucked away to the side, with two additional bedrooms located at the back of the home, including the lavish owner's suite with a full bathroom and walk-in closet.
ⓘ Source: listings_history table (triggers on properties + properties_extension) + one-shot
backfill from property_details.listing_events for pre-trigger history.
Nearby sold comps map
Loading sold comps map…
Walkable amenities ~0.75 mi
Loading nearby amenities…
Taxation est. · year 1
- Rental income
- $26,776
- − Mortgage interest
- −$10,980
- − Property taxes
- −$2,940
- − Insurance
- −$980
- − Repairs & maintenance
- −$2,142
- − Management
- −$2,142
- − Depreciation
- −$5,702
- Taxable income
- $1,890
- Est. tax owed @ 24.0%
- −$454
- After-tax cash flow
- $4,445/yr
For passive investors: Depreciation is non-cash, so a rental often shows a tax loss while cash-flowing — sheltering income. Rental losses are passive: they offset passive income freely, and up to $25,000/yr can offset ordinary (W-2) income if you actively participate and your MAGI is under $100k (phasing out to $0 by $150k); unused losses carry forward. On sale, claimed depreciation is recaptured at up to 25%, and gains may owe capital-gains tax (a 1031 exchange can defer both). Figures are a year-1 estimate at your 24.0% rate — not tax advice; consult a CPA.
Condition & rehab AI · 1 photo
This single-story home is in excellent condition with no visible repairs or maintenance needed. It is move-in ready and would be ideal for both resale and rental.
Schools (NCES district)
- District
- East Central ISD
- NCES district ID
- 4817850
- Math proficiency
- 16% ▼ -12.00%
- Reading proficiency
- 25% ▼ -6.00%
- Median HH income
- $53,941
- Composite
- 18.67/100
- National rank
- #8887
- State rank
- #758 of 826 in TX
Livability — San Antonio
- Score
- 80/100
- State rank
- #31
- US rank
- #1616
Category grades
Schools grade is shown separately in the Schools card above.
Census & demographics
- County
- Bexar County · 1,990,555 people
- City population
- 1,806,925
- Metro
- San Antonio-New Braunfels, TX
- Population (ZIP)
- 26,476
- Household income
- $66,362
- Rent vs Own
- Severe rent burden
- 686.0
Population outlook (Bexar County) Hauer SSP2
- Today (2025)
- 2,336,851 people
- By 2030
- 2,560,728 · +9.6%
- By 2040
- 3,020,569 · +29.3%
- By 2050
- 3,493,522 · +49.5%
- By 2075
- 4,668,459 · +99.8%
- By 2100
- 5,533,242 · +136.8%
Race, ethnicity, and origin ACS 2023
- Neighborhood character
- Majority Hispanic (64%)
- Race & ethnicity
- Hispanic / Latino 64% Two or more races 26% White 19% Black 14% Asian 1%
- Hispanic origin (detail)
- Mexican 55%
- Common ancestry
- Romanian 1% Italian 1% Slovak 1%
- Foreign-born
- 14% · Canada
- Languages at home
- 61% English-only · Spanish 37% Arabic 1%
Political lean MEDSL · Bexar
- 2024 margin
- Lean D (+9.8) · D 54.3% · R 44.6% · Other 1.1%
- 2008→2024 swing
- +4.2pp toward D · 2008: 5.6pp · 2024: 9.8pp
- All cycles
- 2024: D+9.8 2020: D+18.2 2016: D+13.5 2012: D+4.6 2008: D+5.6
Not yet ingested
- Civics
- —
Market trends
- HPI YoY
- ▼ -14.18%
- Current HPI
- 278.8429
- Rent YoY
- ▲ 4.35%
- Metro
- San Antonio-New Braunfels, TX
- State GDP YoY
- ▲ 3.95%
- F500 in state
- 110
Industry mix (Fortune 500 HQ in TX)
| Industry | F500 HQs | Revenue |
|---|---|---|
| Energy | 16 | $1,198B |
|
||
| Technology | 5 | $198B |
|
||
| Engineering / Construction | 4 | $72B |
|
||
| Energy Services | 3 | $60B |
|
||
| Utilities | 3 | $41B |
|
||
| Healthcare | 2 | $330B |
|
||
Price history
1 event — show timeline
- 2025-04-24 Listed $209,900 Zillow
Cash-flow waterfall
monthlySold comps — $/sqft
last 12 mo · ≤1 miLoading sold comps…