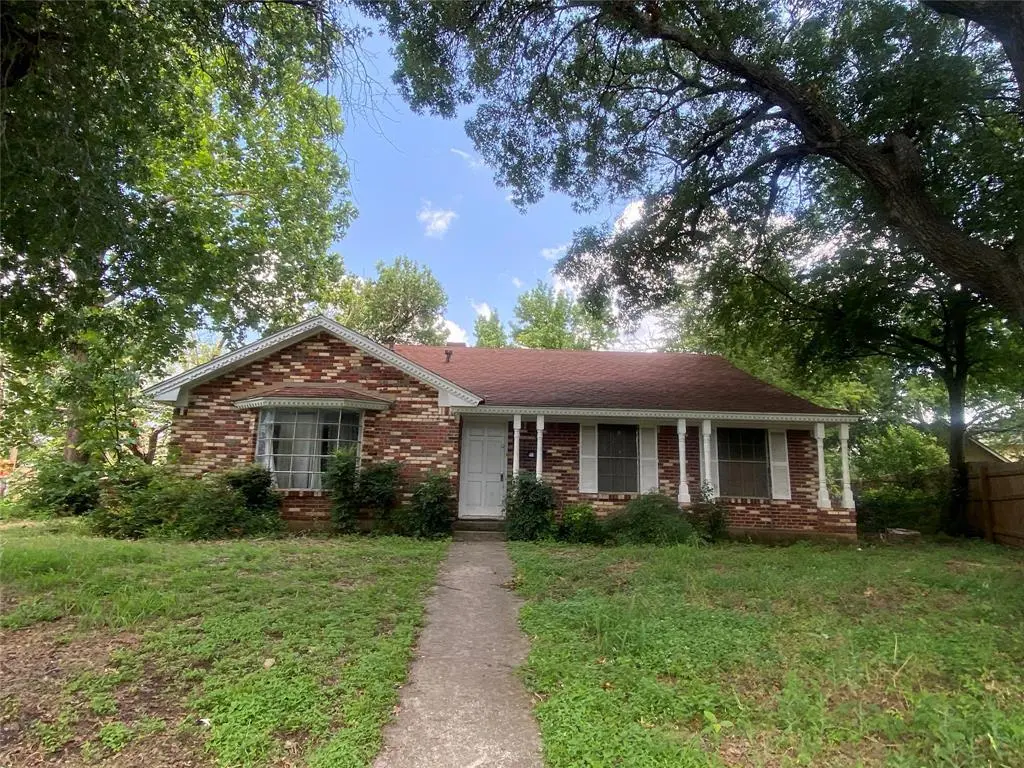
3644 Kimball Ridge Pl · Dallas, TX
Flood risk 1/10 · Minimal
- FEMA flood zone
- X (unshaded)
- Chance of flooding over 30 yrs
- 0.0%
- Est. flood insurance / yr
- $507 – $1,088
Fire risk 1/10 · Minimal
- Est. fire insurance / yr
- $1,222 – $2,270
Heat risk 7/10 · Major
- Hot days now (above 109°F)
- 7 days/yr
- Hot days in 30 yrs
- 24 days/yr
Wind risk 6/10 · Moderate
- Chance of severe wind over 30 yrs
- 27.0%
Air-quality risk 3/10 · Minor
- Unhealthy air days now
- 2 days/yr
- Unhealthy air days in 30 yrs
- 3 days/yr
Risk factors via First Street. Map © Google.
Why this score? — see what drove the B- grade
The composite is a weighted blend of 9 inputs, each scored 0–100. Each bar is that input's sub-score; the figure is the points it added to the 100-point composite (weight × sub-score).
- Cash flow +18.8/30.0
- ARV discount +15.0/15.0
- 1% rule +7.1/10.0
- Appreciation +7.1/10.0
- DSCR +5.9/10.0
- Livability +4.0/5.0
- Schools +2.8/10.0
- Rent growth +2.5/5.0
- Condition / age +2.5/5.0
$209,900
🖨 Deal sheet 📄 Offer letter ✓ Due diligence
Listing remarks
Ready for your next project? This house needs a little of everything to bring it back to life, but the bones are great. Ideal for investors looking for their next buy and hold. Will make a great investment property. Sellers are investors and have never seen the property. Property is priced below market to reflect needed updates. Utilities have been requested. Buyers to perform their own due diligence. Sold AS-IS. Please read agent remarks.
Key facts
- 0.28 acre lot
- 2 garage spots
- Built 1964
Property features AI
Finance
- Financial info: Listing terms accept Cash and Conventional financing; No second mortgage
- HOA & community: No association
Exterior
- Parking: Attached 2-car garage; 2 covered parking spaces; 2-car single door
- Utilities: City sewer; No municipal utility district
- Home design: Single-family residence; Residential property; Built in 1964; One story
- Construction: Composition roof; Slab foundation
- Exterior features: Lot under 0.5 acre (approximately 0.279 acres); Subdivision: Kimball Acres; Directions: Drive east on Blue Ridge Blvd, turn right on Kimball Ridge; house on the left
Interior
- Kitchen: Dishwasher; Microwave; Refrigerator
- Bedrooms: 3 bedrooms (primary bedroom on level 1, approx. 12 x 12)
- Flooring: Carpet; Tile
- Bathrooms: 2 full bathrooms
- Heating & cooling: Central air conditioning; Electric heating
- Interior features: One-level layout; Brick fireplace; One living area and one dining area; Other interior features
- Laundry & utility: Washer hookup
Neighborhood map
What this means for you Summary
Snapshot
- This is a 3-bed/2.0-bath single-family listed at $210k.
Deal economics
- At list price, monthly cash flow is $213 ($3k/yr) — positive.
- The deal already cash-flows at list — no discount required.
- Meets the 1% rule at list price ($3k rent vs $210k).
- Cap rate 7.5% vs local median 2.3% in Dallas — top-decile yield for the area; either an underpriced asset or a hidden risk that comps aren't pricing in. Stress-test before assuming the spread holds.
Location & tenants
- Location reads 81/100 on livability (#24 in TX, #1,380 nationally) — a professional / high-income tenant draw. Strengths: amenities A+, commute A+, housing A+; Watch: crime F.
- Dallas ISD (urban): math 31% / reading 36% proficiency, ranked #559 of 826 in TX (top 68%) — families likely to look elsewhere, expect single-tenant / working-renter base with shorter leases; 83% free/reduced lunch — lower-income household profile, screen leases tightly.
- Zoned schools: Thomas Tolbert El (math 37% / reading 37%, grade F, #1,769 of 4,322 statewide, top 44%, 311 students, 97% FRL).
- Market conditions: 47 active listings in the ZIP; 12 comparable units currently listed for rent nearby; rentals at typical pace (median 21d on market — plan ~3-4 weeks tenant-placement turnaround); 12,577 units permitted in Dallas County in 2024 (6,829 in 5+ unit buildings).
Forward outlook
- In year one you build about $10k of equity ($1k loan paydown + $9k appreciation (4.2% local appreciation)).
- Dallas County population projected at +35% by 2050 — long-run rental-demand tailwind backs the buy-and-hold thesis.
- At projected returns (4.2% appreciation + 3.0% rent growth), your $59k cash investment doubles in ~5 years — after that, you're playing with house money.
- By year 4, paydown + projected appreciation supports a ~$34k cash-out refi (75% LTV) — recoverable capital for the next deal without selling this one.
Negotiation context
- Only 9 days on market — expect competitive offers; lowballing is unlikely to land.
Risks & watch-outs
- Watch-outs: property tax is 3.5% of price.
- Climate carrying-cost: major wind risk, 27% chance of damaging wind over 30y; extreme-heat days projected 7→24/yr by 2055 (HVAC capex compounding) — expect insurance premiums to compound above CPI over the hold.
Questions for the listing agent
- Built in 1964 — when were the roof, HVAC, electrical panel, plumbing, and water heater last replaced?
- Property tax is high relative to price — has the assessment been appealed recently, and will the sale trigger a re-assessment?
- Is there a deadline driving the sale (1031 exchange, divorce, estate, relocation)? That informs how much negotiation room exists.
- Crime grade is F in this area — have there been break-ins, vandalism, or insurance claims at this property in the last 3 years? What carrier currently insures it and at what premium?
- What's the average days-on-market for RENTAL listings here right now (not sales)? A rising rental-DOM trend means longer vacancies and softer asking-rent achievability than the comps imply.
- What's the recent tenant-quality profile in this submarket — average credit score on applications, eviction rate, late-payment / NSF rate, and stable-employment percentage? A property-management company in the area should have these aggregated.
- How much new for-sale + rental construction is in the pipeline within 1–3 miles? Heavy new supply typically softens prices + rents 12–24 months out; constrained supply supports both.
Investment metrics
- 1% rule
- 1.21% ✓
- Cap rate
- 7.51%
- Cash-on-cash
- 4.35%
- DSCR
- 1.19
- GRM
- 6.9
CMA / ARV
- ARV (on-the-fly)
- $325,008
- Comps found
- 12
Show comp detail 12 sales within ~0.75 mi
| Address | Dist | Beds/Ba | Sqft | Sold | Price | $/sf | Match |
|---|---|---|---|---|---|---|---|
| 3734 Kimball Ridge Dr | 0.07mi | 3/2.0 | 1,718 (-3%) | 3mo | $335,500 | $195 | 89 |
| 3819 Kimball Ridge Cir | 0.10mi | 3/2.5 | 1,745 (-2%) | 3mo | $365,000 | $209 | 88 |
| 3828 Kimball Ridge Dr | 0.11mi | 3/2.0 | 1,682 (-5%) | 4mo | $215,000 | $128 | 82 |
| 3539 Los Angeles Blvd | 0.38mi | 3/2.0 | 1,760 (-1%) | 2mo | $310,000 | $176 | 79 |
| 3412 Old Colony Rd | 0.37mi | 3/2.5 | 1,822 (+3%) | 2mo | $435,000 | $239 | 75 |
| 3520 Kiestcrest Dr | 0.27mi | 3/2.0 | 1,980 (+12%) | 8mo | $284,900 | $144 | 62 |
| 3740 Kiestcrest Dr | 0.30mi | 4/3.0 (+1) | 1,846 (+4%) | 14mo | $386,000 | $209 | 59 |
| 3841 Shady Hollow Ln | 0.29mi | 4/2.0 (+1) | 1,965 (+11%) | 8mo | $359,000 | $183 | 58 |
| 3423 Los Angeles Blvd | 0.46mi | 3/2.0 | 1,639 (-8%) | 10mo | $298,000 | $182 | 57 |
| 3427 Los Angeles Blvd | 0.45mi | 3/2.0 | 1,551 (-13%) | 14mo | $249,500 | $161 | 46 |
| 3120 Mapleleaf Ln | 0.59mi | 3/2.0 | 2,040 (+15%) | 12mo | $324,900 | $159 | 38 |
| 3054 Kiestridge Dr | 0.73mi | 3/2.0 | 2,023 (+14%) | 7mo | $369,900 | $183 | 37 |
Match score weights: distance 35% · size 25% · config 20% · recency 20%. Top-matched comps best support the ARV.
Projected returns pro-forma
4.17% appreciation · 3.0% rent growth · sell at horizon
- IRR
- 14.6%
- Equity multiple
- 1.89×
- Total profit
- $52,361
- Equity at exit
- $108,473
- IRR
- 15.7%
- Equity multiple
- 3.59×
- Total profit
- $152,186
- Equity at exit
- $179,073
Cash invested: $58,772 (down + closing). Projections, not guarantees.
Landlord ↔ Tenant lean methodology
- Overall (STATE)
- 87 Strongly Landlord-Friendly
- State Texas
- 87 Strongly Landlord-Friendly · R+5
- County
- — inherits STATE
- City
- — inherits STATE
ZIP-level market 75233
- Home prices YoY
- 1.1%
- Active inventory
- 47
- Price-to-rent
- 6.9×
Monthly cashflow live
- Estimated rent
- $2,538 high interval (Pro) →
- Mortgage (P&I)
- −$1,101
- Tax from tax record
- −$604 /mo · $7,248/yr
- Insurance
- −$87
- HOA
- −$0
- Vacancy / Maint / Mgmt
- −$533
- Net cashflow
- $213
Break-even live
UW: 25.0% down · 7.5% · 30yr · 1.5% tax · 5.0% vac · 8.0% maint · 8.0% mgmt
Financing live
Cash to close
- Down payment
- $52,475
- Closing costs
- $6,297
- Reserves months
- —
- Total cash needed
- —
Loan-product check · same deal, 3 products live
Conventional
25% down · 7.5% · 30yr
- Down + closing
- —
- Monthly P&I
- —
- Monthly cashflow
- —
- DSCR
- —
- Eligible?
- —
Personal DTI + credit; lowest rate.
DSCR
20% down · 8.5% · 30yr
- Down + closing
- —
- Monthly P&I
- —
- Monthly cashflow
- —
- DSCR
- —
- Eligible?
- —
No personal income docs; deal must DSCR.
Hard money
10% down · 12.0% · 12mo
- Down + closing
- —
- Monthly P&I
- —
- Monthly cashflow
- —
- DSCR
- —
- Eligible?
- —
Short-term bridge; refi at stabilization.
Rent comps 12 comps
| Address | Beds | Baths | Sqft | Rent | $/sqft | DOM | Units | Dist |
|---|---|---|---|---|---|---|---|---|
| 3837 Kimball Ridge Dr Dallas, TX | 3.0 | 3.0 | 2135 | $3,200 | $1.50 | 18d | 1 | 0.13mi |
| 3243 Noor St Dallas, TX | 4.0 | 2.0 | 1535 | $2,400 | $1.56 | 7d | 1 | 0.47mi |
| 3235 Noor St Dallas, TX | 4.0 | 2.0 | 1535 | $2,400 | $1.56 | 43d | 1 | 0.48mi |
| 3235 Noor St Dallas, TX | 4.0 | 2.0 | 1535 | $2,400 | $1.56 | 20d | 1 | 0.48mi |
| 3202 Noor St Dallas, TX | 4.0 | 2.0 | 1535 | $2,400 | $1.56 | 7d | 1 | 0.52mi |
| 3202 Noor St Dallas, TX | 4.0 | 2.0 | 1535 | $2,400 | $1.56 | 5d | 1 | 0.52mi |
| 3217 Cedarcroft Ln Dallas, TX | 3.0 | 3.0 | 1558 | $2,200 | $1.41 | 43d | 1 | 0.54mi |
| 3901 Altoona Dr Dallas, TX | 2.0–4.0 | 1.5 | 1367 | $1,650 | $1.21 | 2d | 4 | 0.55mi |
| 3240 Springwood Ln Dallas, TX | 3.0 | 2.0 | 1840 | $2,099 | $1.14 | 16d | 1 | 0.57mi |
| 2925 Spruce Valley Ln Unit 403 Dallas, TX | 3.0 | 2.0 | 1477 | $2,500 | $1.69 | 20d | 1 | 1.07mi |
| 2925 Spruce Valley Ln Unit 302 Dallas, TX | 2.0 | 2.0 | 1266 | $2,300 | $1.82 | 20d | 1 | 1.07mi |
| 4520 Wyoming St Dallas, TX | 3.0 | 1.0 | 1250 | $1,750 | $1.40 | 24d | 1 | 1.30mi |
Listing history 8 events
-
2026-06-18days on market $209,900 Active 9 DOM
-
2026-06-17days on market $209,900 Active 8 DOM
-
2026-06-16days on market $209,900 Active 7 DOM
-
2026-06-15price $209,900 Active 6 DOM
-
2026-06-15days on market $214,900 Active 6 DOM
-
2026-06-13days on market $214,900 Active 4 DOM
-
2026-06-10remarks 443-char remark
-
2026-06-10$214,900 Active 1 DOM
ⓘ Source: listings_history table (triggers on properties + properties_extension) + one-shot
backfill from property_details.listing_events for pre-trigger history.
Tax reassessment forecast TX · Resets to sale price
- Current annual tax
- $7,248 · $604/mo
- Projected year-2 tax
- $7,248 · $604/mo
- Expected delta
- $0/yr ($0/mo · 0.0%)
ⓘ Screening estimate from a state-policy table — verify with the county assessor before closing.
Climate risk First Street
- Flood 1/10 Low FEMA zone X (unshaded) · 0% chance over 30 yrs
- Wildfire 1/10 Low
- Heat 7/10 Severe 7 d/yr ≥109°F today · 24 d/yr by 30 yrs out
- Wind 6/10 Major 27% chance of damaging wind over 30 yrs
- Air quality 3/10 Moderate 2 unhealthy d/yr today · 3 by 30 yrs out
Nearby sold comps map
Loading sold comps map…
Walkable amenities ~0.75 mi
Loading nearby amenities…
Taxation est. · year 1
- Rental income
- $30,461
- − Mortgage interest
- −$11,758
- − Property taxes
- −$7,248
- − Insurance
- −$1,050
- − Repairs & maintenance
- −$2,437
- − Management
- −$2,437
- − Depreciation
- −$6,106
- Taxable loss
- −$573
- Est. tax savings @ 24.0%
- +$138
- After-tax cash flow
- $2,696/yr
For passive investors: Depreciation is non-cash, so a rental often shows a tax loss while cash-flowing — sheltering income. Rental losses are passive: they offset passive income freely, and up to $25,000/yr can offset ordinary (W-2) income if you actively participate and your MAGI is under $100k (phasing out to $0 by $150k); unused losses carry forward. On sale, claimed depreciation is recaptured at up to 25%, and gains may owe capital-gains tax (a 1031 exchange can defer both). Figures are a year-1 estimate at your 24.0% rate — not tax advice; consult a CPA.
Schools (NCES district)
- District
- Dallas ISD
- NCES district ID
- 4816230
- Math proficiency
- 31% ▼ -16.00%
- Reading proficiency
- 36% ▼ -4.00%
- Median HH income
- $42,881
- Composite
- 28.41/100
- National rank
- #6763
- State rank
- #559 of 826 in TX
Livability — Dallas
- Score
- 81/100
- State rank
- #24
- US rank
- #1380
Category grades
Schools grade is shown separately in the Schools card above.
Census & demographics
- Census place
- Dallas, TX
- City population
- 1,168,437
- Population (ZIP)
- 15,775
Population outlook (Dallas County) Hauer SSP2
- Today (2025)
- 2,979,839 people
- By 2030
- 3,191,823 · +7.1%
- By 2040
- 3,619,611 · +21.5%
- By 2050
- 4,026,915 · +35.1%
- By 2075
- 4,957,073 · +66.4%
- By 2100
- 5,508,725 · +84.9%
Race, ethnicity, and origin ACS 2023
- Neighborhood character
- Majority Hispanic (63%)
- Race & ethnicity
- Hispanic / Latino 63% Black 25% Two or more races 11% White 10% Asian 1%
- Hispanic origin (detail)
- Mexican 60%
- Common ancestry
- Slovak 1% Italian 1%
- Foreign-born
- 23% · Canada
- Languages at home
- 47% English-only · Spanish 52% Vietnamese 1%
Political lean MEDSL · Dallas
- 2024 margin
- Strong D (+22.2) · D 60.2% · R 38.0% · Other 1.8%
- 2008→2024 swing
- +6.9pp toward D · 2008: 15.3pp · 2024: 22.2pp
- All cycles
- 2024: D+22.2 2020: D+31.6 2016: D+26.2 2012: D+15.4 2008: D+15.3
Not yet ingested
- Civics
- —
Market trends
- HPI YoY
- ▲ 4.17%
- Current HPI
- 370.9766
- Rent YoY
- —
- Metro
- —
- State GDP YoY
- ▲ 3.95%
- F500 in state
- 110
Industry mix (Fortune 500 HQ in TX)
| Industry | F500 HQs | Revenue |
|---|---|---|
| Energy | 16 | $1,198B |
|
||
| Technology | 5 | $198B |
|
||
| Engineering / Construction | 4 | $72B |
|
||
| Energy Services | 3 | $60B |
|
||
| Utilities | 3 | $41B |
|
||
| Healthcare | 2 | $330B |
|
||
Price history
1 event — show timeline
- 2026-06-09 Listed $214,900 NTREIS
Property tax history
+6.5%/yrLatest (2025): $7,248 · -0.4% YoY. Source: county tax records.
Cash-flow waterfall
monthlySold comps — $/sqft
last 12 mo · ≤1 miLoading sold comps…