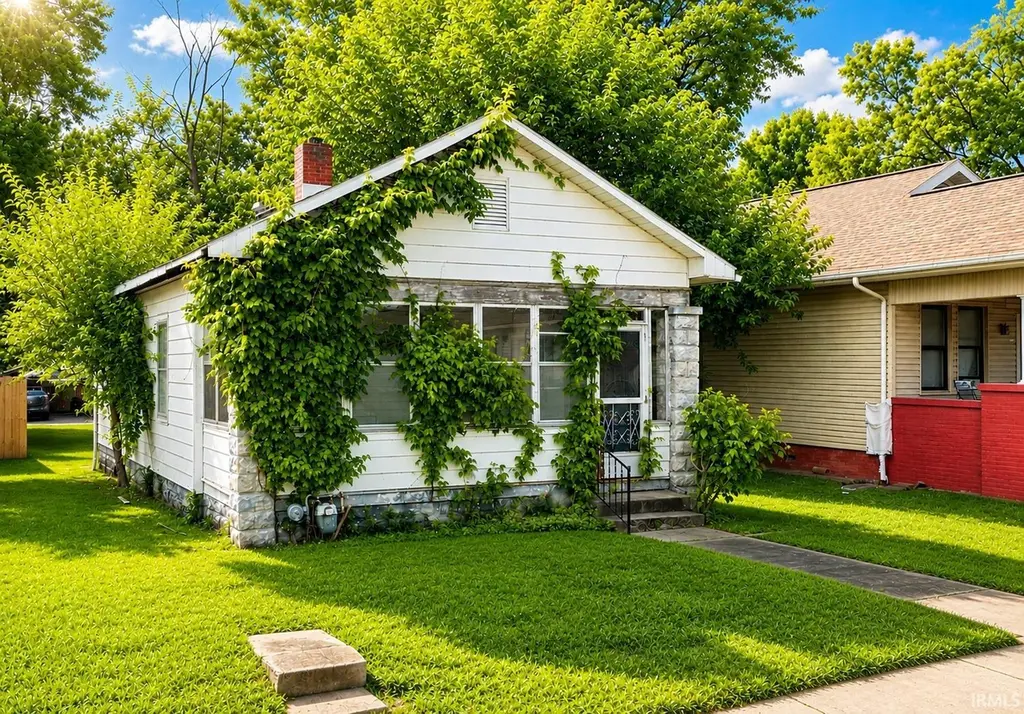
103 Richardt Ave · Evansville, IN
Flood risk 1/10 · Minimal
- FEMA flood zone
- X (unshaded)
- Chance of flooding over 30 yrs
- 0.0%
- Est. flood insurance / yr
- $473 – $860
Fire risk 1/10 · Minimal
- Est. fire insurance / yr
- $717 – $1,331
Heat risk 5/10 · Moderate
- Hot days now (above 106°F)
- 7 days/yr
- Hot days in 30 yrs
- 19 days/yr
Wind risk 2/10 · Minimal
- Chance of severe wind over 30 yrs
- 3.0%
Air-quality risk 4/10 · Minor
- Unhealthy air days now
- 3 days/yr
- Unhealthy air days in 30 yrs
- 5 days/yr
Risk factors via First Street. Map © Google.
Why this score? — see what drove the B grade
The composite is a weighted blend of 9 inputs, each scored 0–100. Each bar is that input's sub-score; the figure is the points it added to the 100-point composite (weight × sub-score).
- Cash flow +30.0/30.0
- 1% rule +10.0/10.0
- DSCR +10.0/10.0
- ARV discount +7.5/15.0
- Rent growth +4.2/5.0
- Schools +3.3/10.0
- Livability +3.2/5.0
- Condition / age +2.5/5.0
- Appreciation +0.0/10.0
$24,900
🖨 Deal sheet 📄 Offer letter ✓ Due diligence
Listing remarks
This Single Family home in Evansville, Indiana offers 672 square feet of living space on a 0.120-acre lot. Built in 1923, this one story property features 1 bedroom and 1 bathroom. The home includes a partial basement, city water and sewer, electric service, and window air conditioning.
Key facts
- 5,227 sq ft lot
- Built 1923
Property features AI
Finance
- Other:
- Financial info:
- HOA & community:
Exterior
- Parking:
- Security:
- Utilities: Public water; Public sewer
- Home design: Single-family residence; Site-built home; One story
- Construction: Asphalt and vinyl siding exterior
- Exterior features: Level lot; Lot dimensions approximately 38 x 138
Interior
- Kitchen:
- Bedrooms: Bedrooms included (see room count)
- Flooring:
- Bathrooms: 1 full bathroom (main level)
- Heating & cooling: Natural gas forced air heating; Window unit air conditioning
- Interior features: Basement present (crawl space, full, unfinished); Total of 4 rooms
- Laundry & utility: Laundry in basement
Neighborhood map
What this means for you Summary
Snapshot
- This is a 1-bed/1.0-bath single-family listed at $25k.
Deal economics
- At list price, monthly cash flow is $410 ($5k/yr) — positive.
- The deal already cash-flows at list — no discount required.
- Meets the 1% rule at list price ($775 rent vs $25k).
- Cap rate 26.0% vs local median 4.6% in Evansville — top-decile yield for the area; either an underpriced asset or a hidden risk that comps aren't pricing in. Stress-test before assuming the spread holds.
Location & tenants
- Location reads 63/100 on livability (#416 in IN) — a middle-class / working-renter tenant base. Strengths: cost of living A+, housing A+, health & safety A+; Watch: crime F, commute F, employment D-.
- Evansville Vanderburgh School Corporation (urban): math 36% / reading 43% proficiency, ranked #153 of 301 in IN (top 51%) — families likely to look elsewhere, expect single-tenant / working-renter base with shorter leases.
- Zoned schools: Delaware Elementary School (math 22% / reading 16%, grade F, #829 of 994 statewide, top 84%, 338 students, 90% FRL); North Junior High School (math 44% / reading 57%, grade C, #43 of 330 statewide, top 14%, 929 students, 42% FRL); North High School (math 57% / reading 74%, grade B, #29 of 369 statewide, top 8%, 1,674 students, 35% FRL).
- Market conditions: Rents rising fast (+6.7%/yr); 229 active listings in the ZIP; 12 comparable units currently listed for rent nearby; rentals at typical pace (median 21d on market — plan ~3-4 weeks tenant-placement turnaround); 508 units permitted in Vanderburgh County in 2024 (32 in 5+ unit buildings).
- This rent is only 14% of the median local income ($66k/yr) — well below the 30% rent-burden line; pricing power to push rent on renewal without tenant pushback.
Forward outlook
- Local home prices are declining (-3.0%/yr); year-one equity from $172 of loan paydown is wiped out by about $747 of value loss. Plan a longer hold.
- At projected returns (-3.0% appreciation + 6.7% rent growth), your $7k cash investment doubles in ~2 years — after that, you're playing with house money.
Negotiation context
- Only 1 days on market — expect competitive offers; lowballing is unlikely to land.
Risks & watch-outs
- Watch-outs: property tax is 3.0% of price; built in 1923 — expect roof / HVAC / electrical / plumbing capex.
- Climate carrying-cost: extreme-heat days projected 7→19/yr by 2055 (HVAC capex compounding) — expect insurance premiums to compound above CPI over the hold.
Questions for the listing agent
- Built in 1923 — when were the roof, HVAC, electrical panel, plumbing, and water heater last replaced?
- Property tax is high relative to price — has the assessment been appealed recently, and will the sale trigger a re-assessment?
- Is there a deadline driving the sale (1031 exchange, divorce, estate, relocation)? That informs how much negotiation room exists.
- Schools are D-rated, which usually means shorter tenancies and higher turnover. Who's the typical renter profile here, and what's been the actual vacancy rate?
- Crime grade is F in this area — have there been break-ins, vandalism, or insurance claims at this property in the last 3 years? What carrier currently insures it and at what premium?
- What's the average days-on-market for RENTAL listings here right now (not sales)? A rising rental-DOM trend means longer vacancies and softer asking-rent achievability than the comps imply.
- What's the recent tenant-quality profile in this submarket — average credit score on applications, eviction rate, late-payment / NSF rate, and stable-employment percentage? A property-management company in the area should have these aggregated.
- How much new for-sale + rental construction is in the pipeline within 1–3 miles? Heavy new supply typically softens prices + rents 12–24 months out; constrained supply supports both.
Investment metrics
- 1% rule
- 3.11% ✓
- Cap rate
- 26.04%
- Cash-on-cash
- 70.51%
- DSCR
- 4.14
- GRM
- 2.7
CMA / ARV
- ARV (on-the-fly)
- $83,328
- Comps found
- 12
Show comp detail 12 sales within ~0.75 mi
| Address | Dist | Beds/Ba | Sqft | Sold | Price | $/sf | Match |
|---|---|---|---|---|---|---|---|
| 2517 N Heidelbach Ave | 0.24mi | 2/1.0 (+1) | 684 (+2%) | 9mo | $125,000 | $183 | 74 |
| 710 Reis Ave | 0.54mi | 1/1.0 | 720 (+7%) | 2mo | $70,000 | $97 | 62 |
| 2532 N Elsas Ave | 0.26mi | 2/1.0 (+1) | 750 (+12%) | 8mo | $67,000 | $89 | 57 |
| 2804 N Sherman St | 0.62mi | 2/1.0 (+1) | 720 (+7%) | 1mo | $89,900 | $125 | 53 |
| 732 Negley Ave | 0.56mi | 2/1.0 (+1) | 720 (+7%) | 14mo | $72,000 | $100 | 45 |
| 2705 Edgar St | 0.66mi | 2/1.0 (+1) | 720 (+7%) | 11mo | $112,900 | $157 | 43 |
| 321 E Tennessee St | 0.59mi | 2/2.0 (+1) | 720 (+7%) | 12mo | $56,000 | $78 | 42 |
| 1309 N Garvin St | 0.66mi | 2/1.0 (+1) | 736 (+10%) | 8mo | $50,000 | $68 | 41 |
| 15 E Tennessee St | 0.57mi | 2/1.0 (+1) | 752 (+12%) | 10mo | $93,500 | $124 | 40 |
| 217 E Eichel Ave | 0.52mi | 2/1.0 (+1) | 760 (+13%) | 11mo | $102,000 | $134 | 40 |
| 215 E Florida St | 0.64mi | 2/1.0 (+1) | 742 (+10%) | 12mo | $56,000 | $75 | 38 |
| 318 W Florida St | 0.75mi | 2/1.0 (+1) | 756 (+12%) | 6mo | $101,000 | $134 | 34 |
Match score weights: distance 35% · size 25% · config 20% · recency 20%. Top-matched comps best support the ARV.
Projected returns pro-forma
-3.0% appreciation · 6.72% rent growth · sell at horizon
- IRR
- 74.5%
- Equity multiple
- 4.60×
- Total profit
- $25,096
- Equity at exit
- $3,713
- IRR
- 79.4%
- Equity multiple
- 10.88×
- Total profit
- $68,900
- Equity at exit
- $2,153
Cash invested: $6,972 (down + closing). Projections, not guarantees.
Landlord ↔ Tenant lean methodology
- Overall (STATE)
- 90 Strongly Landlord-Friendly
- State Indiana
- 90 Strongly Landlord-Friendly · R+11
- County
- — inherits STATE
- City
- — inherits STATE
ZIP-level market 47711
- Home prices YoY
- -32.3%
- Rents YoY
- 6.7%
- Active inventory
- 229
- Price-to-rent
- 2.7×
Monthly cashflow live
- Estimated rent
- $775 high interval (Pro) →
- Mortgage (P&I)
- −$131
- Tax from tax record
- −$61 /mo · $736/yr
- Insurance
- −$10
- HOA
- −$0
- Vacancy / Maint / Mgmt
- −$163
- Net cashflow
- $410
Break-even live
UW: 25.0% down · 7.5% · 30yr · 1.5% tax · 5.0% vac · 8.0% maint · 8.0% mgmt
Financing live
Cash to close
- Down payment
- $6,225
- Closing costs
- $747
- Reserves months
- —
- Total cash needed
- —
Loan-product check · same deal, 3 products live
Conventional
25% down · 7.5% · 30yr
- Down + closing
- —
- Monthly P&I
- —
- Monthly cashflow
- —
- DSCR
- —
- Eligible?
- —
Personal DTI + credit; lowest rate.
DSCR
20% down · 8.5% · 30yr
- Down + closing
- —
- Monthly P&I
- —
- Monthly cashflow
- —
- DSCR
- —
- Eligible?
- —
No personal income docs; deal must DSCR.
Hard money
10% down · 12.0% · 12mo
- Down + closing
- —
- Monthly P&I
- —
- Monthly cashflow
- —
- DSCR
- —
- Eligible?
- —
Short-term bridge; refi at stabilization.
Rent comps 12 comps
| Address | Beds | Baths | Sqft | Rent | $/sqft | DOM | Units | Dist |
|---|---|---|---|---|---|---|---|---|
| 500 Richardt Ave Evansville, IN | 1.0 | 1.0 | 550 | $700 | $1.27 | 20d | 1 | 0.30mi |
| 109 E Eichel Ave Unit A Evansville, IN | 1.0 | 1.0 | 675 | $745 | $1.10 | 20d | 1 | 0.48mi |
| 820 Negley Ave Unit B Evansville, IN | 1.0 | 1.0 | 575 | $695 | $1.21 | 20d | 1 | 0.66mi |
| 2511 N Kentucky Ave Unit 23 Evansville, IN | 1.0 | 1.0 | 584 | $650 | $1.11 | 20d | 1 | 0.87mi |
| 702 Fairway Dr Evansville, IN | 1.0–2.0 | 1.0 | 800 | $640 | $0.80 | 20d | 2 | 1.00mi |
| 1111 Stanley Ave Evansville, IN | 2.0 | 1.0 | 670 | $1,000 | $1.49 | 20d | 1 | 1.03mi |
| 1219 Joan Ave Unit 1219 Evansville, IN | 2.0 | 1.0 | 725 | $845 | $1.17 | 13d | 1 | 1.06mi |
| 1151 Diamond Pl Evansville, IN | 1.0 | 1.0 | 700 | $780 | $1.11 | 20d | 1 | 1.10mi |
| 200 N Main St Evansville, IN | 2.0 | 1.0–2.0 | 857 | $1,287 | $1.50 | 13d | 7 | 1.26mi |
| 406 Edgar St Unit 1 Evansville, IN | 1.0 | 1.0 | 530 | $1,500 | $2.83 | 20d | 1 | 1.26mi |
| 605 W Michigan St Unit 1 Evansville, IN | 1.0 | 1.0 | 484 | $795 | $1.64 | 20d | 1 | 1.27mi |
| 41 W Division St Unit 101 Evansville, IN | 1.0 | 1.0 | 634 | $1,100 | $1.74 | 20d | 1 | 1.41mi |
Listing history 2 events
-
2026-05-07status Pending
-
2026-05-06$24,900 Active
ⓘ Source: listings_history table (triggers on properties + properties_extension) + one-shot
backfill from property_details.listing_events for pre-trigger history.
Tax reassessment forecast IN · Partial reset (capped growth)
- Current annual tax
- $736 · $61/mo
- Projected year-2 tax
- $736 · $61/mo
- Expected delta
- $0/yr ($0/mo · 0.0%)
ⓘ Screening estimate from a state-policy table — verify with the county assessor before closing.
Climate risk First Street
- Flood 1/10 Low FEMA zone X (unshaded) · 0% chance over 30 yrs
- Wildfire 1/10 Low
- Heat 5/10 Major 7 d/yr ≥106°F today · 19 d/yr by 30 yrs out
- Wind 2/10 Low 3% chance of damaging wind over 30 yrs
- Air quality 4/10 Moderate 3 unhealthy d/yr today · 5 by 30 yrs out
Nearby sold comps map
Loading sold comps map…
Walkable amenities ~0.75 mi
Loading nearby amenities…
Taxation est. · year 1
- Rental income
- $9,296
- − Mortgage interest
- −$1,395
- − Property taxes
- −$736
- − Insurance
- −$124
- − Repairs & maintenance
- −$744
- − Management
- −$744
- − Depreciation
- −$724
- Taxable income
- $4,829
- Est. tax owed @ 24.0%
- −$1,159
- After-tax cash flow
- $3,757/yr
For passive investors: Depreciation is non-cash, so a rental often shows a tax loss while cash-flowing — sheltering income. Rental losses are passive: they offset passive income freely, and up to $25,000/yr can offset ordinary (W-2) income if you actively participate and your MAGI is under $100k (phasing out to $0 by $150k); unused losses carry forward. On sale, claimed depreciation is recaptured at up to 25%, and gains may owe capital-gains tax (a 1031 exchange can defer both). Figures are a year-1 estimate at your 24.0% rate — not tax advice; consult a CPA.
Schools (NCES district)
- District
- Evansville Vanderburgh School Corporation
- NCES district ID
- 1803450
- Math proficiency
- 36% ▼ -7.00%
- Reading proficiency
- 43% ▼ -3.00%
- Median HH income
- $43,270
- Composite
- 33.41/100
- National rank
- #5471
- State rank
- #153 of 301 in IN
Livability — Evansville
- Score
- 63/100
- State rank
- #416
- US rank
- #15047
Category grades
Schools grade is shown separately in the Schools card above.
Census & demographics
- Census place
- Evansville, IN
- County
- Vanderburgh County · 146,793 people
- City population
- 146,793
- Metro
- Evansville, IN-KY
- Population (ZIP)
- 30,944
- Household income
- $66,320
- Rent vs Own
- Severe rent burden
- 659.0
Population outlook (Vanderburgh County) Hauer SSP2
- Today (2025)
- 187,038 people
- By 2030
- 188,907 · +1.0%
- By 2040
- 190,272 · +1.7%
- By 2050
- 188,871 · +1.0%
- By 2075
- 180,751 · -3.4%
- By 2100
- 163,015 · -12.8%
Race, ethnicity, and origin ACS 2023
- Neighborhood character
- Predominantly White (85%)
- Race & ethnicity
- White 85% Black 8% Two or more races 5% Hispanic / Latino 2%
- Common ancestry
- Lithuanian 2% Romanian 2% Slovak 1%
- Foreign-born
- 2% · Canada
- Languages at home
- 97% English-only · Spanish 2%
Political lean MEDSL · Vanderburgh
- 2024 margin
- R (+12.7) · D 43.0% · R 55.6% · Other 1.4%
- 2008→2024 swing
- -15.1pp toward R · 2008: 2.5pp · 2024: -12.7pp
- All cycles
- 2024: R+12.7 2020: R+9.6 2016: R+16.9 2012: R+10.8 2008: D+2.5
Not yet ingested
- Civics
- —
Market trends
- HPI YoY
- ▼ -97.98%
- Current HPI
- 205.62
- Rent YoY
- ▲ 6.72%
- Metro
- Evansville, IN-KY
- State GDP YoY
- ▲ 2.90%
- F500 in state
- 18
Industry mix (Fortune 500 HQ in IN)
| Industry | F500 HQs | Revenue |
|---|---|---|
| Industrial Machinery | 2 | $37B |
|
||
| Healthcare | 1 | $177B |
|
||
| Pharmaceuticals | 1 | $45B |
|
||
| Metals / Steel | 1 | $18B |
|
||
| Agriculture | 1 | $17B |
|
||
| Packaging | 1 | $12B |
|
||
Price history
2 events — show timeline
- 2026-05-07 Pending — IRMLS
- 2026-05-06 Listed $24,900 IRMLS
Property tax history
+14.4%/yrLatest (2024): $736 · +2.4% YoY. Source: county tax records.
Cash-flow waterfall
monthlySold comps — $/sqft
last 12 mo · ≤1 miLoading sold comps…