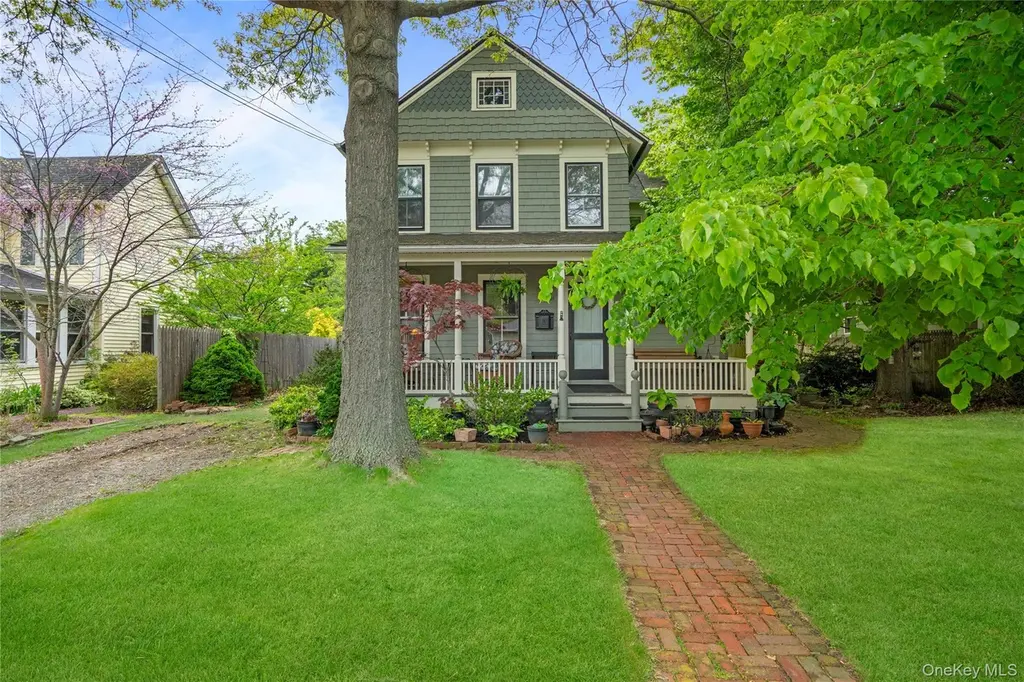
101 Jayne Ave · Patchogue, NY
Flood risk 1/10 · Minimal
- FEMA flood zone
- X (unshaded)
- Chance of flooding over 30 yrs
- 0.0%
- Est. flood insurance / yr
- $473 – $860
Fire risk 1/10 · Minimal
- Est. fire insurance / yr
- $691 – $1,283
Heat risk 4/10 · Minor
- Hot days now (above 92°F)
- 7 days/yr
- Hot days in 30 yrs
- 18 days/yr
Wind risk 8/10 · Major
- Chance of severe wind over 30 yrs
- 80.0%
Air-quality risk 3/10 · Minor
- Unhealthy air days now
- 3 days/yr
- Unhealthy air days in 30 yrs
- 4 days/yr
Risk factors via First Street. Map © Google.
Why this score? — see what drove the D grade
The composite is a weighted blend of 9 inputs, each scored 0–100. Each bar is that input's sub-score; the figure is the points it added to the 100-point composite (weight × sub-score).
- ARV discount +15.0/15.0
- Cash flow +8.6/30.0
- Schools +6.7/10.0
- Livability +4.0/5.0
- Rent growth +3.8/5.0
- Condition / age +2.5/5.0
- DSCR +2.4/10.0
- 1% rule +1.6/10.0
- Appreciation +0.0/10.0
$535,000
🖨 Deal sheet (PDF) 📄 Offer letter ✓ Due diligence
Listing remarks
Move into this old world charming Victorian house with original hardwood floors, high ceilings & large rooms. Adorable front porch. Some new Anderson windows, roof approx 10 years old, Septic tank includes an over flow. Seconds to LIRR & town. Large park-like property.
Key facts
- 9,148 sq ft lot
- Built 1888
- Listed 15 days
Property features AI
Exterior
- Parking: Driveway
- Utilities: Electricity connected (PSEG); Septic tank; Sewer connected
- Home design: Single family residence; Three or more levels
- Construction: Shake siding construction
- Exterior features: Shake siding; Not waterfront
Interior
- Kitchen: Dishwasher; Oven; Refrigerator
- Bedrooms: Bedroom on the first floor
- Bathrooms: 2 full bathrooms
- Heating & cooling: Natural gas heating; No central cooling
- Interior features: First-floor bedroom; Eat-in kitchen; Formal dining room; 7 total rooms; Pull-down attic stairs
- Laundry & utility: In-home laundry room; Washer; Dryer; Unfinished basement with storage space
Neighborhood map
What this means for you Summary
Snapshot
- This is a 3-bed/2.0-bath single-family listed at $535k.
Deal economics
- At list price, monthly cash flow is $-463 ($-6k/yr) — negative.
- To cash-flow at today's rent, offer at most $453k (15.3% below list).
- To meet the 1% rule (rent ≥ 1% of price), the offer needs to be $352k (34.3% below list).
- Recommended offer: $352k (34.3% below list) — sets the bar for 1% rule.
- Cap rate 5.3% vs local median 3.4% in Patchogue — top-decile yield for the area; either an underpriced asset or a hidden risk that comps aren't pricing in. Stress-test before assuming the spread holds.
Location & tenants
- Location reads 80/100 on livability (#108 in NY, #1,800 nationally) — a professional / high-income tenant draw. Strengths: employment A+, housing A+, health & safety A+; Watch: amenities D-, cost of living F.
- Patchogue-Medford Union Free School District (suburban): math 83% / reading 69% proficiency, ranked #73 of 590 in NY (top 12%) — strong family-tenant draw, lease renewals of 3-5y typical.
- Zoned schools: Medford Elementary School (math 75% / reading 75%, grade A, #289 of 2,108 statewide, top 15%, 451 students, 42% FRL); South Ocean Middle School (math 75%, 599 students, 57% FRL); Patchogue-Medford High School (math 89% / reading 67%, grade A-, #577 of 1,100 statewide, top 52%, 2,443 students, 53% FRL) — zoned schools average 51% FRL vs 35% district-wide (16 pts higher); higher-poverty schools than district average — tighter screening recommended.
- Market conditions: Rents rising fast (+5.1%/yr); 219 active listings in the ZIP; 15 comparable units currently listed for rent nearby; rentals leasing fast (median 3d on market — plan ~1-2 weeks tenant-placement turnaround); solid renter incomes; 1,366 units permitted in Suffolk County in 2024 (216 in 5+ unit buildings).
- This rent runs 40% of the median local income ($105k/yr) — at the standard rent-burdened threshold; future hikes will face affordability resistance.
Forward outlook
- Local home prices are declining (-3.0%/yr); year-one equity from $4k of loan paydown is wiped out by about $16k of value loss. Plan a longer hold.
- Suffolk County population projected to shrink 5% by 2050 — rents likely to lag national; underwrite the cash flow, not the appreciation.
Negotiation context
- It's been on market 15 days — a 2% lower offer ($527k) is reasonable based on typical stale-listing flexibility.
Risks & watch-outs
- Watch-outs: built in 1888 — expect roof / HVAC / electrical / plumbing capex.
- Climate carrying-cost: severe wind risk, 80% chance of damaging wind over 30y — expect insurance premiums to compound above CPI over the hold.
Questions for the listing agent
- What do current leases actually rent for vs. the listed asking? Can we see a recent rent roll and the last 12 months of T-12 income?
- Built in 1888 — when were the roof, HVAC, electrical panel, plumbing, and water heater last replaced?
- Is there a deadline driving the sale (1031 exchange, divorce, estate, relocation)? That informs how much negotiation room exists.
- Schools are F-rated, which usually means shorter tenancies and higher turnover. Who's the typical renter profile here, and what's been the actual vacancy rate?
- The area grade is low — what's the realistic commute time and amenity access for the typical tenant pool here? Any planned neighborhood developments (good or bad) we should know about?
- What's the average days-on-market for RENTAL listings here right now (not sales)? A rising rental-DOM trend means longer vacancies and softer asking-rent achievability than the comps imply.
- What's the recent tenant-quality profile in this submarket — average credit score on applications, eviction rate, late-payment / NSF rate, and stable-employment percentage? A property-management company in the area should have these aggregated.
- How much new for-sale + rental construction is in the pipeline within 1–3 miles? Heavy new supply typically softens prices + rents 12–24 months out; constrained supply supports both.
Investment metrics
- 1% rule
- 0.66% ✗
- Cap rate
- 5.25%
- Cash-on-cash
- -3.71%
- DSCR
- 0.84
- GRM
- 12.7
CMA / ARV
- ARV (median comp)
- $647,951
- List price
- $535,000
- Delta
- -17.43%
- Verdict
- UNDERPRICED
- Comps
- 20 within 1.0 mi
Show comp detail 12 sales within ~0.75 mi
| Address | Dist | Beds/Ba | Sqft | Sold | Price | $/sf | Match |
|---|---|---|---|---|---|---|---|
| 219 North Ocean Ave | 0.09mi | 3/1.5 | 1,440 (+6%) | 6mo | $545,000 | $378 | 79 |
| 50 Jayne Ave | 0.13mi | 3/2.0 | 1,464 (+8%) | 15mo | $440,000 | $301 | 68 |
| 118 Ketcham Ave | 0.49mi | 3/2.0 | 1,424 (+5%) | 2mo | $751,500 | $528 | 66 |
| 163 Jennings Ave | 0.24mi | 3/1.0 | 1,229 (-9%) | 6mo | $570,000 | $464 | 65 |
| 301 Maple Ave | 0.51mi | 3/1.0 | 1,344 (-1%) | 11mo | $590,000 | $439 | 62 |
| 186 Falcon Ave | 0.54mi | 3/1.0 | 1,420 (+5%) | 9mo | $407,500 | $287 | 55 |
| 8 Bennett Ave | 0.50mi | 3/1.0 | 1,285 (-5%) | 13mo | $520,000 | $405 | 53 |
| 66 Evergreen Ave | 0.73mi | 3/1.5 | 1,420 (+5%) | 6mo | $550,000 | $387 | 51 |
| 371 N Ocean Ave | 0.45mi | 4/2.0 (+1) | 1,531 (+13%) | 8mo | $500,000 | $327 | 45 |
| 28 E 6th St | 0.67mi | 3/2.0 | 1,200 (-12%) | 7mo | $685,000 | $571 | 44 |
| 32 E 7th St | 0.69mi | 3/1.5 | 1,494 (+10%) | 8mo | $548,000 | $367 | 43 |
| 301 Oak St | 0.60mi | 2/1.0 (-1) | 1,256 (-7%) | 10mo | $520,500 | $414 | 42 |
Match score weights: distance 35% · size 25% · config 20% · recency 20%. Top-matched comps best support the ARV.
Projected returns pro-forma
-3.0% appreciation · 5.07% rent growth · sell at horizon
- IRR
- -20.6%
- Equity multiple
- 0.27×
- Total profit
- $-108,922
- Equity at exit
- $79,770
- IRR
- -10.4%
- Equity multiple
- 0.32×
- Total profit
- $-101,722
- Equity at exit
- $46,257
Cash invested: $149,800 (down + closing). Projections, not guarantees.
Landlord ↔ Tenant lean methodology
- Overall (STATE)
- 15 Strongly Tenant-Friendly
- State New York
- 15 Strongly Tenant-Friendly · D+10
- County
- — inherits STATE
- City
- — inherits STATE
ZIP-level market 11772
- Rents YoY
- 5.1%
- Active inventory
- 219
- Price-to-rent
- 12.7×
Monthly cashflow live
- Estimated rent
- $3,517 high interval (Pro) →
- Mortgage (P&I)
- −$2,806
- Tax from tax record
- −$213 /mo · $2,552/yr
- Insurance
- −$223
- HOA
- −$0
- Vacancy / Maint / Mgmt
- −$739
- Net cashflow
- $-463
Break-even live
Sensitivity live
| Price | -10% $-160 | -5% $-311 | +0% $-463 | +5% $-614 | +10% $-766 |
|---|---|---|---|---|---|
| Rent | -10% $-741 | -5% $-602 | +0% $-463 | +5% $-324 | +10% $-185 |
| Rate | -1.0pp $-193 | -0.5pp $-327 | base $-463 | +0.5pp $-601 | +1.0pp $-742 |
UW: 25.0% down · 7.5% · 30yr · 1.5% tax · 5.0% vac · 8.0% maint · 8.0% mgmt
Financing live
Cash to close
- Down payment
- $133,750
- Closing costs
- $16,050
- Reserves months
- —
- Total cash needed
- —
Loan-product check · same deal, 3 products live
Conventional
25% down · 7.5% · 30yr
- Down + closing
- —
- Monthly P&I
- —
- Monthly cashflow
- —
- DSCR
- —
- Eligible?
- —
Personal DTI + credit; lowest rate.
DSCR
20% down · 8.5% · 30yr
- Down + closing
- —
- Monthly P&I
- —
- Monthly cashflow
- —
- DSCR
- —
- Eligible?
- —
No personal income docs; deal must DSCR.
Hard money
10% down · 12.0% · 12mo
- Down + closing
- —
- Monthly P&I
- —
- Monthly cashflow
- —
- DSCR
- —
- Eligible?
- —
Short-term bridge; refi at stabilization.
Rent comps 15 comps
| Address | Beds | Baths | Sqft | Rent | $/sqft | DOM | Units | Dist |
|---|---|---|---|---|---|---|---|---|
| 22 Jennings Ave Unit B Patchogue, NY | 2.0 | 1.0 | 919 | $3,000 | $3.26 | 3d | 1 | 0.31mi |
| 34 Union Ave Patchogue, NY | 2.0 | 1.0 | 1000 | $3,000 | $3.00 | 7d | 1 | 0.35mi |
| 1 Village Green Way Patchogue, NY | 1.0–2.0 | 1.0–2.0 | 947 | $3,809 | $4.02 | 0d | 7 | 0.35mi |
| 99 Waverly Ave Patchogue, NY | 1.0–2.0 | 1.0–2.0 | 928 | $3,710 | $4.00 | 0d | 9 | 0.66mi |
| 80 Division St Unit 3B Patchogue, NY | 2.0 | 2.0 | 1225 | $3,500 | $2.86 | 0d | 1 | 0.74mi |
| 80 Division St Unit 3A Patchogue, NY | 2.0 | 2.0 | 1468 | $3,850 | $2.62 | 45d | 1 | 0.74mi |
| 80 Division St Unit 2B Patchogue, NY | 2.0 | 2.0 | 1100 | $3,500 | $3.18 | 45d | 1 | 0.74mi |
| 80 Division St Patchogue, NY | 2.0 | 1.0 | 1000 | $3,100 | $3.10 | 26d | 1 | 0.74mi |
| 80 Division St Unit 3G Patchogue, NY | 2.0 | 1.0 | 1182 | $3,700 | $3.13 | 26d | 1 | 0.74mi |
| 80 Division St Unit 302 Patchogue, NY | 2.0 | 2.0 | 1225 | $3,500 | $2.86 | 22d | 1 | 0.74mi |
| 17 Mott St Patchogue, NY | 3.0 | 2.0 | 1326 | $3,850 | $2.90 | 0d | 1 | 0.77mi |
| 104 River Ave Patchogue, NY | 3.0 | 1.0 | 1100 | $3,100 | $2.82 | 0d | 1 | 0.84mi |
| 143 N Summit Ave Patchogue, NY | 3.0 | 1.0 | 1400 | $4,800 | $3.43 | 0d | 1 | 1.01mi |
| 39 Laurel St Patchogue, NY | 3.0 | 2.0 | 1100 | $3,400 | $3.09 | 26d | 1 | 1.06mi |
| 234 River Ave Patchogue, NY | 2.0 | 1.0 | 687 | $2,905 | $4.23 | 0d | 1 | 1.10mi |
Listing history 2 events
-
2026-05-15$535,000 Active 280-char remark
-
2026-05-13historical $535,000 280-char remark
ⓘ Source: listings_history table (triggers on properties + properties_extension) + one-shot
backfill from property_details.listing_events for pre-trigger history.
Tax reassessment forecast NY · Partial reset (capped growth)
- Current annual tax
- $2,552 · $213/mo
- Projected year-2 tax
- $5,797 · $483/mo
- Expected delta
- +$3,245/yr (+$270/mo · 127.1%)
ⓘ Screening estimate from a state-policy table — verify with the county assessor before closing.
Climate risk First Street
- Flood 1/10 Low FEMA zone X (unshaded) · 0% chance over 30 yrs
- Wildfire 1/10 Low
- Heat 4/10 Moderate 7 d/yr ≥92°F today · 18 d/yr by 30 yrs out
- Wind 8/10 Severe 80% chance of damaging wind over 30 yrs
- Air quality 3/10 Moderate 3 unhealthy d/yr today · 4 by 30 yrs out
Nearby sold comps map
Loading sold comps map…
Walkable amenities ~0.75 mi
Loading nearby amenities…
Taxation est. · year 1
- Rental income
- $42,204
- − Mortgage interest
- −$29,968
- − Property taxes
- −$2,552
- − Insurance
- −$2,675
- − Repairs & maintenance
- −$3,376
- − Management
- −$3,376
- − Depreciation
- −$15,564
- Taxable loss
- −$15,308
- Est. tax savings @ 24.0%
- +$3,674
- After-tax cash flow
- $-1,880/yr
For passive investors: Depreciation is non-cash, so a rental often shows a tax loss while cash-flowing — sheltering income. Rental losses are passive: they offset passive income freely, and up to $25,000/yr can offset ordinary (W-2) income if you actively participate and your MAGI is under $100k (phasing out to $0 by $150k); unused losses carry forward. On sale, claimed depreciation is recaptured at up to 25%, and gains may owe capital-gains tax (a 1031 exchange can defer both). Figures are a year-1 estimate at your 24.0% rate — not tax advice; consult a CPA.
Schools (NCES district)
- District
- Patchogue-Medford Union Free School District
- NCES district ID
- 3622470
- Math proficiency
- 83% ▲ 27.00%
- Reading proficiency
- 69% ▲ 15.00%
- Median HH income
- $75,120
- Composite
- 66.81/100
- National rank
- #405
- State rank
- #73 of 590 in NY
Livability — Patchogue
- Score
- 80/100
- State rank
- #108
- US rank
- #1800
Category grades
Schools grade is shown separately in the Schools card above.
Census & demographics
- Census place
- Patchogue, NY
- County
- Suffolk County · 679,920 people
- City population
- 45,023
- Metro
- New York-Newark-Jersey City, NY-NJ-PA
- Population (ZIP)
- 45,023
- Household income
- $105,245
- Rent vs Own
- Severe rent burden
- 1595.0
Population outlook (Suffolk County) Hauer SSP2
- Today (2025)
- 1,505,262 people
- By 2030
- 1,498,318 · -0.5%
- By 2040
- 1,471,101 · -2.3%
- By 2050
- 1,424,848 · -5.3%
- By 2075
- 1,337,157 · -11.2%
- By 2100
- 1,217,720 · -19.1%
Race, ethnicity, and origin ACS 2023
- Neighborhood character
- Predominantly White (66%)
- Race & ethnicity
- White 66% Hispanic / Latino 24% Two or more races 8% Black 4% Asian 3%
- Hispanic origin (detail)
- Mexican 1% Puerto Rican 5% Dominican 2%
- Common ancestry
- Romanian 4% Lithuanian 2% Scotch-Irish 2%
- Foreign-born
- 15% · Canada, Jamaica, China
- Languages at home
- 78% English-only · Spanish 15% Other Asian/Pacific 2% Other Indo-European 1%
Political lean MEDSL · Suffolk
- 2024 margin
- Lean R (+10.0) · D 45.0% · R 55.0%
- 2008→2024 swing
- -16.0pp toward R · 2008: 6.0pp · 2024: -10.0pp
- All cycles
- 2024: R+10.0 2020: R+0.0 2016: R+8.2 2012: D+2.9 2008: D+6.0
Not yet ingested
- Civics
- —
Market trends
- HPI YoY
- ▼ -578.02%
- Current HPI
- 375.1174
- Rent YoY
- ▲ 5.07%
- Metro
- New York-Newark-Jersey City, NY-NJ-PA
- State GDP YoY
- ▲ 2.60%
- F500 in state
- 92
Industry mix (Fortune 500 HQ in NY)
| Industry | F500 HQs | Revenue |
|---|---|---|
| Financial Services | 10 | $950B |
|
||
| Consumer Goods | 9 | $162B |
|
||
| Insurance | 4 | $225B |
|
||
| Telecommunications | 2 | $144B |
|
||
| Pharmaceuticals | 2 | $112B |
|
||
| Media / Entertainment | 2 | $69B |
|
||
Price history
+0.0% since first listed3 events — show timeline
- 2026-05-29 Pending — OneKey® MLS as Distributed by MLS Grid
- 2026-05-15 Listed $535,000 OneKey® MLS as Distributed by MLS Grid
- 2026-05-13 Coming Soon $535,000 OneKey® MLS as Distributed by MLS Grid
Property tax history
+8.6%/yrLatest (2025): $2,552 · +4.6% YoY. Source: county tax records.
Cash-flow waterfall
monthlySold comps — $/sqft
last 12 mo · ≤1 miLoading sold comps…