64 Hemet Dr · Citrus Heights, CA
Flood risk 4/10 · Minor
- FEMA flood zone
- X (unshaded)
- Chance of flooding over 30 yrs
- 0.2%
- Est. flood insurance / yr
- $507 – $1,088
Fire risk 3/10 · Minor
- Est. fire insurance / yr
- $659 – $1,223
Heat risk 7/10 · Major
- Hot days now (above 103°F)
- 7 days/yr
- Hot days in 30 yrs
- 15 days/yr
Wind risk 1/10 · Minimal
- Chance of severe wind over 30 yrs
- —
Air-quality risk 10/10 · Severe
- Unhealthy air days now
- 34 days/yr
- Unhealthy air days in 30 yrs
- 36 days/yr
Risk factors via First Street. Map © Google.
Why this score? — see what drove the B+ grade
The composite is a weighted blend of 9 inputs, each scored 0–100. Each bar is that input's sub-score; the figure is the points it added to the 100-point composite (weight × sub-score).
- Cash flow +30.0/30.0
- ARV discount +15.0/15.0
- 1% rule +10.0/10.0
- DSCR +10.0/10.0
- Schools +4.4/10.0
- Rent growth +3.0/5.0
- Livability +3.0/5.0
- Condition / age +2.5/5.0
- Appreciation +0.0/10.0
$49,800
🖨 Deal sheet 📄 Offer letter ✓ Due diligence
Listing remarks
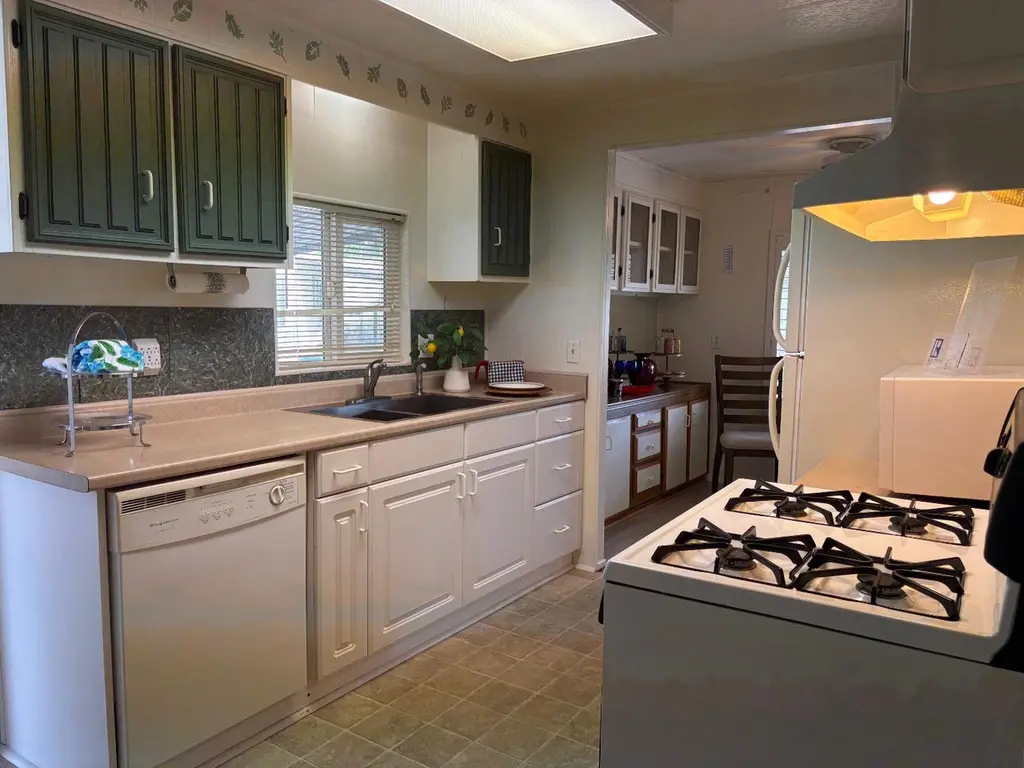
Beautiful Home located in the desirable 55+ Stonegate Mobile Community in Citrus Heights. Kitchen shows well with a new double sink, dishwasher, gas range and fridge. The dining room looks over the living room area with custom vinyl shutters, newer laminate floors in the living room, hallway and bedrooms and dual pane windows which give plenty of light. The living room slider doors open onto a large covered deck to enjoy those summer evenings. Upgrades include laminate flooring in the main living areas, Dual Pane windows, Mirrored Closet doors in each Bedroom, Custom Vinyl Shutters in Living Room and L-shaped Awning for the tandem two-car parking gives you extra space to park. Large Primar
Key facts
- New double sink
- Laminate flooring
- Custom vinyl blinds
Tags
Neighborhood map
What this means for you Summary
Snapshot
- This is a 2-bed/2.0-bath manufactured listed at $50k.
Deal economics
- At list price, monthly cash flow is $1k ($14k/yr) — positive.
- The deal already cash-flows at list — no discount required.
- Meets the 1% rule at list price ($2k rent vs $50k).
- Recommended offer: $48k (3.0% below list) — sets the bar for market timing.
- Cap rate 34.1% vs local median 3.4% in Citrus Heights — top-decile yield for the area; either an underpriced asset or a hidden risk that comps aren't pricing in. Stress-test before assuming the spread holds.
Location & tenants
- Location reads 60/100 on livability (#614 in CA) — a middle-class / working-renter tenant base. Strengths: housing A+; Watch: schools D, crime D-, amenities F.
- San Juan Unified (suburban): math 40% / reading 62% proficiency, ranked #138 of 517 in CA (top 27%) — acceptable for families but not a draw, mixed tenant base, ~2y average lease.
- Market conditions: Rents rising (+1.9%/yr); 210 active listings in the ZIP; 19 comparable units currently listed for rent nearby; rentals at typical pace (median 15d on market — plan ~3-4 weeks tenant-placement turnaround); solid renter incomes; 6,825 units permitted in Sacramento County in 2024 (1,752 in 5+ unit buildings).
Forward outlook
- Local home prices are declining (-3.0%/yr); year-one equity from $344 of loan paydown is wiped out by about $1k of value loss. Plan a longer hold.
- Sacramento County population projected at +17% by 2050 — long-run rental-demand tailwind backs the buy-and-hold thesis.
- At projected returns (-3.0% appreciation + 1.9% rent growth), your $14k cash investment doubles in ~2 years — after that, you're playing with house money.
Negotiation context
- It's been on market 43 days — a 3% lower offer ($48k) is reasonable based on typical stale-listing flexibility.
- Current owner paid $32k; list at $50k implies a 58% gain — meaningful room to come down on a strong offer.
Risks & watch-outs
- Climate carrying-cost: extreme-heat days projected 7→15/yr by 2055 (HVAC capex compounding) — expect insurance premiums to compound above CPI over the hold.
Questions for the listing agent
- It's been on market 43 days. Have you received any prior offers? Is the seller open to a 3% concession, seller financing, or rate buy-down credit?
- Built in 1973 — when were the roof, HVAC, electrical panel, plumbing, and water heater last replaced?
- Is there a deadline driving the sale (1031 exchange, divorce, estate, relocation)? That informs how much negotiation room exists.
- Schools are D-rated, which usually means shorter tenancies and higher turnover. Who's the typical renter profile here, and what's been the actual vacancy rate?
- Crime grade is D in this area — have there been break-ins, vandalism, or insurance claims at this property in the last 3 years? What carrier currently insures it and at what premium?
- What's the average days-on-market for RENTAL listings here right now (not sales)? A rising rental-DOM trend means longer vacancies and softer asking-rent achievability than the comps imply.
- What's the recent tenant-quality profile in this submarket — average credit score on applications, eviction rate, late-payment / NSF rate, and stable-employment percentage? A property-management company in the area should have these aggregated.
- How much new for-sale + rental construction is in the pipeline within 1–3 miles? Heavy new supply typically softens prices + rents 12–24 months out; constrained supply supports both.
Investment metrics
- 1% rule
- 3.81% ✓
- Cap rate
- 34.08%
- Cash-on-cash
- 99.26%
- DSCR
- 5.42
- GRM
- 2.2
CMA / ARV
- ARV (median comp)
- $75,677
- List price
- $49,800
- Delta
- -34.19%
- Verdict
- UNDERPRICED
- Comps
- 14 within 1.0 mi
Show comp detail 12 sales within ~0.75 mi
| Address | Dist | Beds/Ba | Sqft | Sold | Price | $/sf | Match |
|---|---|---|---|---|---|---|---|
| 112 Cambria Cir | 0.22mi | 2/1.0 | 800 (0%) | 2mo | $14,000 | $18 | 84 |
| 92 Tallwood Cir | 0.25mi | 2/1.5 | 784 (-2%) | 2mo | $85,000 | $108 | 81 |
| 187 Saxton Cir | 0.06mi | 2/1.0 | 720 (-10%) | 1mo | $56,800 | $79 | 76 |
| 165 Hanover St | 0.15mi | 2/1.0 | 734 (-8%) | 3mo | $22,500 | $31 | 73 |
| 45 Saxton Cir | 0.09mi | 1/1.0 (-1) | 750 (-6%) | 10mo | $14,900 | $20 | 68 |
| 106 Cambria Cir | 0.19mi | 2/1.0 | 730 (-9%) | 5mo | $75,000 | $103 | 68 |
| 174 Saxton Cir | 0.05mi | 2/1.0 | 684 (-14%) | 7mo | $30,000 | $44 | 64 |
| 156 Sage St | 0.14mi | 2/1.0 | 870 (+9%) | 17mo | $49,000 | $56 | 60 |
| 117 Cambria Cir | 0.26mi | 2/1.5 | 720 (-10%) | 13mo | $50,000 | $69 | 58 |
| 140 Sage St | 0.15mi | 2/2.0 | 910 (+14%) | 19mo | $112,000 | $123 | 54 |
| 69 Cambria Cir | 0.31mi | 2/1.5 | 700 (-12%) | 12mo | $65,000 | $93 | 52 |
| 66 Cambria Cir | 0.31mi | 2/1.0 | 684 (-14%) | 21mo | $50,000 | $73 | 40 |
Match score weights: distance 35% · size 25% · config 20% · recency 20%. Top-matched comps best support the ARV.
Projected returns pro-forma
-3.0% appreciation · 1.9% rent growth · sell at horizon
- IRR
- 99.1%
- Equity multiple
- 5.54×
- Total profit
- $63,341
- Equity at exit
- $7,425
- IRR
- —
- Equity multiple
- 11.15×
- Total profit
- $141,531
- Equity at exit
- $4,306
Cash invested: $13,944 (down + closing). Projections, not guarantees.
Landlord ↔ Tenant lean methodology
- Overall (STATE)
- 18 Strongly Tenant-Friendly
- State California
- 18 Strongly Tenant-Friendly · D+13
- County
- — inherits STATE
- City
- — inherits STATE
ZIP-level market 95621
- Rents YoY
- 1.9%
- Active inventory
- 210
- Price-to-rent
- 2.2×
Monthly cashflow live
- Estimated rent
- $1,896 high interval (Pro) →
- Mortgage (P&I)
- −$261
- Tax est. 1.5%
- −$62 /mo · $747/yr
- Insurance
- −$21
- HOA
- −$0
- Vacancy / Maint / Mgmt
- −$398
- Net cashflow
- $1,153
Break-even live
UW: 25.0% down · 7.5% · 30yr · 1.5% tax · 5.0% vac · 8.0% maint · 8.0% mgmt
Financing live
Cash to close
- Down payment
- $12,450
- Closing costs
- $1,494
- Reserves months
- —
- Total cash needed
- —
Loan-product check · same deal, 3 products live
Conventional
25% down · 7.5% · 30yr
- Down + closing
- —
- Monthly P&I
- —
- Monthly cashflow
- —
- DSCR
- —
- Eligible?
- —
Personal DTI + credit; lowest rate.
DSCR
20% down · 8.5% · 30yr
- Down + closing
- —
- Monthly P&I
- —
- Monthly cashflow
- —
- DSCR
- —
- Eligible?
- —
No personal income docs; deal must DSCR.
Hard money
10% down · 12.0% · 12mo
- Down + closing
- —
- Monthly P&I
- —
- Monthly cashflow
- —
- DSCR
- —
- Eligible?
- —
Short-term bridge; refi at stabilization.
Rent comps 19 comps
| Address | Beds | Baths | Sqft | Rent | $/sqft | DOM | Units | Dist |
|---|---|---|---|---|---|---|---|---|
| 7434 Auburn Oaks Ct Citrus Heights, CA | 2.0 | 1.0 | 890 | $1,975 | $2.22 | 3d | 1 | 0.45mi |
| 7434 Auburn Oaks Ct Citrus Heights, CA | 1.0–2.0 | 1.0 | 790 | $1,875 | $2.37 | 23d | 4 | 0.45mi |
| 7445 Auburn Oaks Ct Unit K Citrus Heights, CA | 2.0 | 2.0 | 929 | $1,695 | $1.82 | 43d | 1 | 0.48mi |
| 7445 Auburn Oaks Ct Unit K Citrus Heights, CA | 2.0 | 2.0 | 929 | $1,700 | $1.83 | 21d | 1 | 0.48mi |
| 1000 Cirby Oaks Way Roseville, CA | 1.0 | 1.0 | 700 | $1,955 | $2.79 | 1d | 2 | 0.82mi |
| 7603 Linden Ave Citrus Heights, CA | 2.0 | 1.5 | 990 | $1,900 | $1.92 | 17d | 1 | 0.86mi |
| 7915 Zenith Dr Citrus Heights, CA | 2.0 | 1.0 | 1015 | $1,895 | $1.87 | 21d | 1 | 0.87mi |
| 333 Cirby Way Roseville, CA | 1.0–2.0 | 1.0 | 796 | $2,115 | $2.66 | 1d | 4 | 0.96mi |
| 7827 Zenith Dr Citrus Heights, CA | 2.0 | 2.0 | 1031 | $1,995 | $1.94 | 14d | 1 | 0.97mi |
| 425 Cirby Way Roseville, CA | 1.0–2.0 | 1.0–2.0 | 812 | $2,274 | $2.80 | 1d | 1 | 1.02mi |
| 7658 Poppy Way Citrus Heights, CA | 2.0 | 1.0 | 900 | $1,785 | $1.98 | 14d | 1 | 1.10mi |
| 7658 Poppy Way Unit 7658 Citrus Heights, CA | 2.0 | 1.0 | 900 | $1,695 | $1.88 | 2d | 1 | 1.10mi |
| 7761 Pompei Ct Unit 7763 Citrus Heights, CA | 2.0 | 1.0 | 900 | $1,705 | $1.89 | 23d | 1 | 1.14mi |
| 6413 Tupelo Dr Citrus Heights, CA | 1.0–2.0 | 1.0–2.0 | 775 | $2,000 | $2.58 | 1d | 10 | 1.15mi |
| 3 Somer Ridge Dr Roseville, CA | 1.0–2.0 | 1.0–2.0 | 909 | $2,270 | $2.50 | 1d | 6 | 1.17mi |
| 7727 Mariposa Ave Unit 5 Citrus Heights, CA | 2.0 | 1.0 | 725 | $1,795 | $2.48 | 43d | 1 | 1.25mi |
| 7541 Ramona Ln Citrus Heights, CA | 1.0–2.0 | 1.0–2.0 | 837 | $2,295 | $2.74 | 2d | 9 | 1.35mi |
| 308 6th St Unit B Roseville, CA | 2.0 | 1.0 | 800 | $2,200 | $2.75 | 21d | 1 | 1.43mi |
| 415 5th St #2 Roseville, CA | 1.0 | 1.0 | 650 | $1,285 | $1.98 | 16d | 1 | 1.46mi |
Listing history 14 events
-
2026-06-15status $49,800 Pending 43 DOM
-
2026-06-15days on market $49,800 Active 43 DOM
-
2026-06-13days on market $49,800 Active 41 DOM
-
2026-06-13days on market $49,800 Active 40 DOM
-
2026-06-09days on market $49,800 Active 37 DOM
-
2026-06-08days on market $49,800 Active 36 DOM
-
2026-06-07days on market $49,800 Active 35 DOM
-
2026-06-05pricedays on market $49,800 Active 32 DOM
-
2026-06-03days on market $57,800 Active 31 DOM
-
2026-06-02days on market $57,800 Active 30 DOM
-
2026-06-01days on market $57,800 Active 29 DOM
-
2026-05-31days on market $57,800 Active 28 DOM
-
2009-08-01soldstatus $31,500
-
2008-10-27soldstatus $32,000
ⓘ Source: listings_history table (triggers on properties + properties_extension) + one-shot
backfill from property_details.listing_events for pre-trigger history.
Climate risk First Street
- Flood 4/10 Moderate FEMA zone X (unshaded) · 20% chance over 30 yrs
- Wildfire 3/10 Moderate
- Heat 7/10 Severe 7 d/yr ≥103°F today · 15 d/yr by 30 yrs out
- Wind 1/10 Low
- Air quality 10/10 Extreme 34 unhealthy d/yr today · 36 by 30 yrs out
Nearby sold comps map
Loading sold comps map…
Walkable amenities ~0.75 mi
Loading nearby amenities…
Taxation est. · year 1
- Rental income
- $22,747
- − Mortgage interest
- −$2,790
- − Property taxes
- −$747
- − Insurance
- −$249
- − Repairs & maintenance
- −$1,820
- − Management
- −$1,820
- − Depreciation
- −$1,449
- Taxable income
- $13,873
- Est. tax owed @ 24.0%
- −$3,330
- After-tax cash flow
- $10,511/yr
For passive investors: Depreciation is non-cash, so a rental often shows a tax loss while cash-flowing — sheltering income. Rental losses are passive: they offset passive income freely, and up to $25,000/yr can offset ordinary (W-2) income if you actively participate and your MAGI is under $100k (phasing out to $0 by $150k); unused losses carry forward. On sale, claimed depreciation is recaptured at up to 25%, and gains may owe capital-gains tax (a 1031 exchange can defer both). Figures are a year-1 estimate at your 24.0% rate — not tax advice; consult a CPA.
Schools (NCES district)
- District
- San Juan Unified
- NCES district ID
- 0634620
- Math proficiency
- 40% ▲ 3.00%
- Reading proficiency
- 62% ▲ 16.00%
- Median HH income
- $55,655
- Composite
- 44.07/100
- National rank
- #2878
- State rank
- #138 of 517 in CA
Livability — Citrus Heights
- Score
- 60/100
- State rank
- #614
- US rank
- #19580
Category grades
Schools grade is shown separately in the Schools card above.
Census & demographics
- Census place
- Citrus Heights, CA
- County
- Sacramento County · 1,539,646 people
- City population
- 89,370
- Metro
- Sacramento-Roseville-Folsom, CA
- Population (ZIP)
- 42,442
- Household income
- $80,901
- Rent vs Own
- Severe rent burden
- 1854.0
Population outlook (Sacramento County) Hauer SSP2
- Today (2025)
- 1,660,763 people
- By 2030
- 1,732,990 · +4.3%
- By 2040
- 1,855,755 · +11.7%
- By 2050
- 1,941,335 · +16.9%
- By 2075
- 2,046,162 · +23.2%
- By 2100
- 1,961,444 · +18.1%
Race, ethnicity, and origin ACS 2023
- Neighborhood character
- Predominantly White (66%)
- Race & ethnicity
- White 66% Hispanic / Latino 19% Two or more races 11% Asian 6% Black 2%
- Hispanic origin (detail)
- Mexican 16%
- Common ancestry
- Subsaharan African 3% Lithuanian 3% Scotch-Irish 2%
- Foreign-born
- 15% · Canada, Vietnam
- Languages at home
- 78% English-only · Spanish 10% Russian/Polish/Slavic 6% Other Indo-European 3%
Political lean MEDSL · Sacramento
- 2024 margin
- D (+19.7) · D 58.1% · R 38.4% · Other 3.5%
- 2008→2024 swing
- +0.7pp no change · 2008: 19.0pp · 2024: 19.7pp
- All cycles
- 2024: D+19.7 2020: D+25.3 2016: D+23.7 2012: D+16.3 2008: D+19.0
Not yet ingested
- Civics
- —
Market trends
- HPI YoY
- ▼ -408.14%
- Current HPI
- 351.9333
- Rent YoY
- ▲ 1.90%
- Metro
- Sacramento-Roseville-Folsom, CA
- State GDP YoY
- ▲ 3.21%
- F500 in state
- 116
Industry mix (Fortune 500 HQ in CA)
| Industry | F500 HQs | Revenue |
|---|---|---|
| Technology | 27 | $1,492B |
|
||
| Financial Services | 3 | $174B |
|
||
| Retail | 3 | $44B |
|
||
| Insurance | 3 | $26B |
|
||
| Media / Entertainment | 2 | $115B |
|
||
| Pharmaceuticals / Biotech | 2 | $62B |
|
||
Price history
-1.6% since first listed2 events — show timeline
- 2009-08-01 Sold (Public Records) $31,500 Public Records
- 2008-10-27 Sold (Public Records) $32,000 Public Records
Property tax history
+0.2%/yrLatest (2025): $53 · -5.7% YoY. Source: county tax records.
Cash-flow waterfall
monthlySold comps — $/sqft
last 12 mo · ≤1 miLoading sold comps…