242 Fairview Ave · San Antonio, TX
Flood risk 1/10 · Minimal
- FEMA flood zone
- X (unshaded)
- Chance of flooding over 30 yrs
- 0.0%
- Est. flood insurance / yr
- $507 – $1,088
Fire risk 1/10 · Minimal
- Est. fire insurance / yr
- $1,222 – $2,270
Heat risk 8/10 · Major
- Hot days now (above 108°F)
- 7 days/yr
- Hot days in 30 yrs
- 21 days/yr
Wind risk 8/10 · Major
- Chance of severe wind over 30 yrs
- 80.0%
Air-quality risk 2/10 · Minimal
- Unhealthy air days now
- 1 days/yr
- Unhealthy air days in 30 yrs
- 2 days/yr
Risk factors via First Street. Map © Google.
Why this score? — see what drove the C+ grade
The composite is a weighted blend of 9 inputs, each scored 0–100. Each bar is that input's sub-score; the figure is the points it added to the 100-point composite (weight × sub-score).
- Cash flow +23.8/30.0
- ARV discount +15.0/15.0
- 1% rule +7.9/10.0
- DSCR +7.7/10.0
- Livability +4.0/5.0
- Condition / age +2.5/5.0
- Rent growth +1.7/5.0
- Schools +1.4/10.0
- Appreciation +0.0/10.0
$119,000
🖨 Deal sheet 📄 Offer letter ✓ Due diligence
Listing remarks MLS
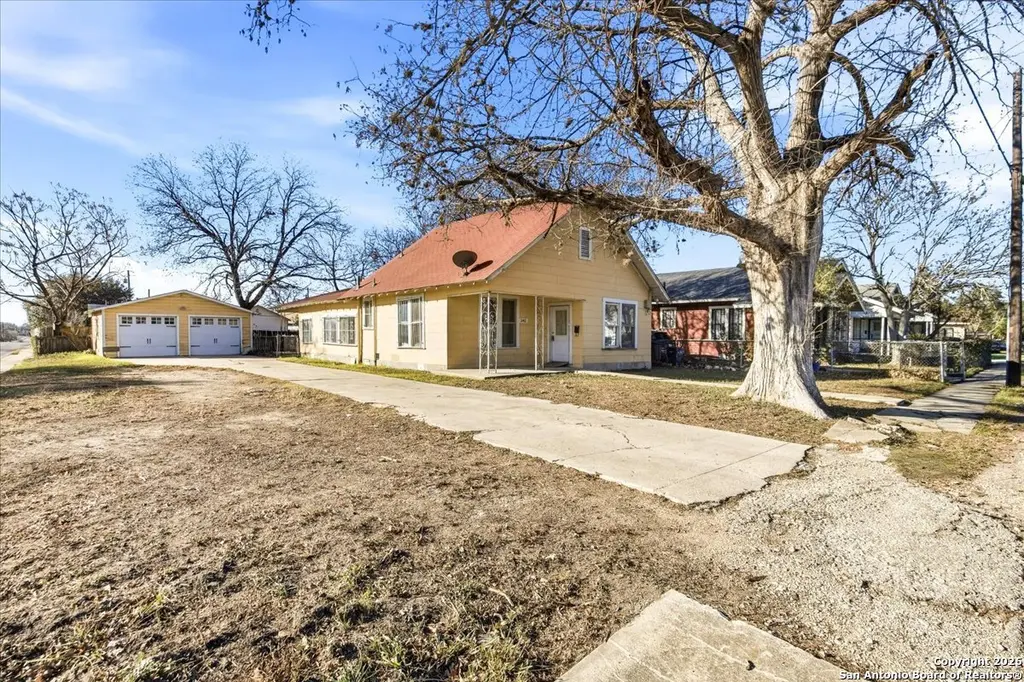
***Owner Financing Available!!!*** Charming fixer-upper with endless potential located near downtown San Antonio! This 3-bedroom, 1-bath home sits on a desirable corner lot and features two covered porches, a detached 2-car garage, and mature trees providing great shade and character. Ideal opportunity for investors or buyers looking to renovate and add value in a prime, centrally located area with easy access to downtown, dining, and entertainment.
Key facts
- Corner lot
- Two covered porches
- Mature trees
Tags
Neighborhood map
What this means for you Summary
Snapshot
- This is a 3-bed/1.0-bath single-family listed at $119k.
Deal economics
- At list price, monthly cash flow is $230 ($3k/yr) — positive.
- The deal already cash-flows at list — no discount required.
- Meets the 1% rule at list price ($2k rent vs $119k).
- Recommended offer: $105k (12.0% below list) — sets the bar for market timing.
- Cap rate 8.6% vs local median 3.8% in San Antonio — top-decile yield for the area; either an underpriced asset or a hidden risk that comps aren't pricing in. Stress-test before assuming the spread holds.
Location & tenants
- Location reads 80/100 on livability (#31 in TX, #1,616 nationally) — a professional / high-income tenant draw. Strengths: amenities A+, commute A+, cost of living A+; Watch: schools C-, crime F.
- San Antonio ISD (urban): math 12% / reading 22% proficiency, ranked #805 of 826 in TX (top 98%) — low school quality limits family demand, transient renter base, plan for 1-2y turnover; 80% free/reduced lunch — lower-income household profile, screen leases tightly.
- Market conditions: Rents falling (-3.4%/yr); 325 active listings in the ZIP; 40 comparable units currently listed for rent nearby; rentals at typical pace (median 24d on market — plan ~3-4 weeks tenant-placement turnaround); 8,308 units permitted in Bexar County in 2024 (2,506 in 5+ unit buildings).
- This rent runs 35% of the median local income ($52k/yr) — at the standard rent-burdened threshold; future hikes will face affordability resistance.
Forward outlook
- Local home prices are declining (-3.0%/yr); year-one equity from $823 of loan paydown is wiped out by about $4k of value loss. Plan a longer hold.
- Bexar County population projected at +50% by 2050 — long-run rental-demand tailwind backs the buy-and-hold thesis.
Negotiation context
- It's been on market 152 days — a 12% lower offer ($105k) is reasonable based on typical stale-listing flexibility.
Risks & watch-outs
- Watch-outs: property tax is 3.1% of price; built in 1917 — expect roof / HVAC / electrical / plumbing capex.
- Climate carrying-cost: severe wind risk, 80% chance of damaging wind over 30y; extreme-heat days projected 7→21/yr by 2055 (HVAC capex compounding) — expect insurance premiums to compound above CPI over the hold.
Questions for the listing agent
- It's been on market 152 days. Have you received any prior offers? Is the seller open to a 12% concession, seller financing, or rate buy-down credit?
- Built in 1917 — when were the roof, HVAC, electrical panel, plumbing, and water heater last replaced?
- Property tax is high relative to price — has the assessment been appealed recently, and will the sale trigger a re-assessment?
- Why hasn't it sold? Are there any deal-killer items the seller is aware of (foundation, flood, title, zoning, code violations)?
- Is there a deadline driving the sale (1031 exchange, divorce, estate, relocation)? That informs how much negotiation room exists.
- Crime grade is F in this area — have there been break-ins, vandalism, or insurance claims at this property in the last 3 years? What carrier currently insures it and at what premium?
- What's the average days-on-market for RENTAL listings here right now (not sales)? A rising rental-DOM trend means longer vacancies and softer asking-rent achievability than the comps imply.
- What's the recent tenant-quality profile in this submarket — average credit score on applications, eviction rate, late-payment / NSF rate, and stable-employment percentage? A property-management company in the area should have these aggregated.
- How much new for-sale + rental construction is in the pipeline within 1–3 miles? Heavy new supply typically softens prices + rents 12–24 months out; constrained supply supports both.
Investment metrics
- 1% rule
- 1.29% ✓
- Cap rate
- 8.61%
- Cash-on-cash
- 8.27%
- DSCR
- 1.37
- GRM
- 6.5
CMA / ARV
- ARV (median comp)
- $179,318
- List price
- $119,000
- Delta
- -33.64%
- Verdict
- UNDERPRICED
- Comps
- 20 within 1.0 mi
Show comp detail 12 sales within ~0.75 mi
| Address | Dist | Beds/Ba | Sqft | Sold | Price | $/sf | Match |
|---|---|---|---|---|---|---|---|
| 306 Linda Lou | 0.31mi | 3/2.0 | 1,534 (+3%) | 2mo | $200,000 | $130 | 75 |
| 406 Halliday Ave | 0.21mi | 4/1.0 (+1) | 1,570 (+5%) | 5mo | $131,300 | $84 | 72 |
| 398 Fairview Ave | 0.25mi | 3/2.0 | 1,344 (-10%) | 5mo | $109,000 | $81 | 64 |
| 427 Vanderbilt | 0.72mi | 3/1.0 | 1,518 (+2%) | 2mo | $189,999 | $125 | 62 |
| 430 Merry Ann | 0.69mi | 3/2.0 | 1,431 (-4%) | 2mo | $255,000 | $178 | 56 |
| 755 Linda Lou | 0.55mi | 4/1.0 (+1) | 1,657 (+11%) | 0mo | $90,000 | $54 | 50 |
| 910 Halliday | 0.66mi | 4/2.0 (+1) | 1,409 (-5%) | 1mo | $185,000 | $131 | 50 |
| 126 Stratford | 0.50mi | 2/2.0 (-1) | 1,354 (-9%) | 3mo | $75,000 | $55 | 50 |
| 422 Merry Ann | 0.67mi | 3/2.0 | 1,622 (+9%) | 2mo | $252,000 | $155 | 48 |
| 1118 Mckinley | 0.74mi | 2/2.0 (-1) | 1,401 (-6%) | 7mo | $218,000 | $156 | 41 |
| 231 Mcmullen | 0.63mi | 2/2.0 (-1) | 1,303 (-13%) | 6mo | $229,500 | $176 | 36 |
| 131 Imogene Dr | 0.73mi | 3/2.0 | 1,286 (-14%) | 4mo | $175,000 | $136 | 36 |
Match score weights: distance 35% · size 25% · config 20% · recency 20%. Top-matched comps best support the ARV.
Projected returns pro-forma
-3.0% appreciation · 0.0% rent growth · sell at horizon
- IRR
- -7.6%
- Equity multiple
- 0.73×
- Total profit
- $-9,022
- Equity at exit
- $17,743
- IRR
- -3.1%
- Equity multiple
- 0.82×
- Total profit
- $-5,863
- Equity at exit
- $10,289
Cash invested: $33,320 (down + closing). Projections, not guarantees.
Landlord ↔ Tenant lean methodology
- Overall (STATE)
- 87 Strongly Landlord-Friendly
- State Texas
- 87 Strongly Landlord-Friendly · R+5
- County
- — inherits STATE
- City
- — inherits STATE
ZIP-level market 78223
- Home prices YoY
- -16.4%
- Rents YoY
- -3.4%
- Active inventory
- 325
- Price-to-rent
- 6.5×
Monthly cashflow live
- Estimated rent
- $1,530 high interval (Pro) →
- Mortgage (P&I)
- −$624
- Tax from tax record
- −$305 /mo · $3,661/yr
- Insurance
- −$50
- HOA
- −$0
- Vacancy / Maint / Mgmt
- −$321
- Net cashflow
- $230
Break-even live
UW: 25.0% down · 7.5% · 30yr · 1.5% tax · 5.0% vac · 8.0% maint · 8.0% mgmt
Financing live
Cash to close
- Down payment
- $29,750
- Closing costs
- $3,570
- Reserves months
- —
- Total cash needed
- —
Loan-product check · same deal, 3 products live
Conventional
25% down · 7.5% · 30yr
- Down + closing
- —
- Monthly P&I
- —
- Monthly cashflow
- —
- DSCR
- —
- Eligible?
- —
Personal DTI + credit; lowest rate.
DSCR
20% down · 8.5% · 30yr
- Down + closing
- —
- Monthly P&I
- —
- Monthly cashflow
- —
- DSCR
- —
- Eligible?
- —
No personal income docs; deal must DSCR.
Hard money
10% down · 12.0% · 12mo
- Down + closing
- —
- Monthly P&I
- —
- Monthly cashflow
- —
- DSCR
- —
- Eligible?
- —
Short-term bridge; refi at stabilization.
Rent comps 40 comps
| Address | Beds | Baths | Sqft | Rent | $/sqft | DOM | Units | Dist |
|---|---|---|---|---|---|---|---|---|
| 232 Regina St Unit 1 San Antonio, TX | 2.0 | 1.0 | 1085 | $1,399 | $1.29 | 2d | 1 | 0.14mi |
| 125 Ada St Unit 1 San Antonio, TX | 3.0 | 1.0 | 1563 | $1,295 | $0.83 | 43d | 1 | 0.15mi |
| 134 Ward Ave San Antonio, TX | 2.0 | 1.0 | 1063 | $1,150 | $1.08 | 43d | 1 | 0.16mi |
| 123 Fairview Ave #3 San Antonio, TX | 3.0 | 2.5 | 1776 | $1,800 | $1.01 | 43d | 1 | 0.17mi |
| 134 Lilla Jean Dr San Antonio, TX | 3.0 | 2.0 | 1349 | $1,595 | $1.18 | 24d | 1 | 0.29mi |
| 534 Chicago Blvd Unit NA San Antonio, TX | 3.0 | 2.0 | 1250 | $1,550 | $1.24 | 17d | 1 | 0.35mi |
| 534 Chicago Blvd San Antonio, TX | 3.0 | 2.0 | 1250 | $1,550 | $1.24 | 20d | 1 | 0.35mi |
| 518 Topeka Blvd San Antonio, TX | 3.0 | 2.0 | 1135 | $1,375 | $1.21 | 24d | 1 | 0.37mi |
| 704 Fair Ave Unit 200 San Antonio, TX | 2.0 | 1.5 | 1600 | $1,200 | $0.75 | 24d | 1 | 0.49mi |
| 220 Hansford St San Antonio, TX | 3.0 | 2.0 | 1269 | $1,600 | $1.26 | 3d | 1 | 0.63mi |
| 1510 Steves Ave San Antonio, TX | 3.0 | 2.0 | 1330 | $1,800 | $1.35 | 24d | 1 | 0.67mi |
| 515 Stratford Ct Unit NA San Antonio, TX | 3.0 | 1.0 | 895 | $1,550 | $1.73 | 43d | 1 | 0.70mi |
| 1528 Steves Ave Unit 1 San Antonio, TX | 2.0 | 1.0 | 940 | $1,025 | $1.09 | 43d | 1 | 0.70mi |
| 2914 Roosevelt Ave San Antonio, TX | 1.0–3.0 | 1.0–2.0 | 868 | $1,469 | $1.69 | 43d | 1 | 0.74mi |
| 927 VFW Blvd Unit 710 San Antonio, TX | 2.0 | 2.0 | 921 | $932 | $1.01 | 16d | 1 | 0.75mi |
| 1039 McKinley Ave San Antonio, TX | 3.0 | 3.0 | 1650 | $2,300 | $1.39 | 1d | 1 | 0.75mi |
| 927 Vfw Blvd San Antonio, TX | 1.0–3.0 | 1.0–2.0 | 937 | $1,280 | $1.37 | 3d | 28 | 0.77mi |
| 510 Vanderbilt St San Antonio, TX | 2.0 | 1.0 | 1208 | $1,150 | $0.95 | 43d | 1 | 0.77mi |
| 517 Hicks Ave San Antonio, TX | 3.0 | 2.0 | 1520 | $1,700 | $1.12 | 43d | 1 | 0.78mi |
| 1131 McKinley Ave San Antonio, TX | 2.0 | 1.0 | 1000 | $1,550 | $1.55 | 4d | 1 | 0.79mi |
| 142 Avant Ave #1 San Antonio, TX | 3.0 | 1.0 | 1314 | $1,495 | $1.14 | 17d | 1 | 0.89mi |
| 414 Stanfield Ave San Antonio, TX | 3.0 | 1.0 | 1250 | $1,300 | $1.04 | 43d | 1 | 0.91mi |
| 312 Avondale Ave San Antonio, TX | 3.0 | 3.0 | 1757 | $2,000 | $1.14 | 16d | 1 | 0.95mi |
| 454 Bailey Ave San Antonio, TX | 3.0 | 2.0 | 1674 | $1,495 | $0.89 | 43d | 1 | 0.96mi |
| 331 Avant Ave San Antonio, TX | 3.0 | 2.0 | 1200 | $1,825 | $1.52 | 24d | 1 | 0.99mi |
| 523 Bailey Ave San Antonio, TX | 2.0 | 2.0 | 960 | $1,500 | $1.56 | 24d | 1 | 1.03mi |
| 1444 McKinley Ave San Antonio, TX | 3.0 | 2.0 | 1618 | $2,500 | $1.55 | 24d | 1 | 1.04mi |
| 439 Dunning Ave San Antonio, TX | 2.0 | 2.0 | 1050 | $1,500 | $1.43 | 4d | 1 | 1.06mi |
| 1914 S Pine St San Antonio, TX | 2.0 | 1.0 | 1025 | $1,250 | $1.22 | 43d | 1 | 1.06mi |
| 511 E Sayers Ave San Antonio, TX | 4.0 | 2.0 | 1748 | $1,675 | $0.96 | 24d | 1 | 1.09mi |
| 1050 Vanderbilt St San Antonio, TX | 4.0 | 2.0 | 1508 | $1,850 | $1.23 | 24d | 1 | 1.15mi |
| 222 E Mitchell St San Antonio, TX | 2.0 | 1.0–2.0 | 972 | $1,825 | $1.88 | 2d | 16 | 1.16mi |
| 508 Kayton Ave San Antonio, TX | 2.0 | 1.0 | 1058 | $1,200 | $1.13 | 16d | 1 | 1.19mi |
| 1124 Vanderbilt St San Antonio, TX | 3.0 | 1.0 | 1095 | $1,350 | $1.23 | 43d | 1 | 1.22mi |
| 2219 S New Braunfels Ave San Antonio, TX | 2.0 | 1.0 | 952 | $1,050 | $1.10 | 24d | 1 | 1.27mi |
| 1627 Schley Ave San Antonio, TX | 3.0 | 1.0 | 1408 | $1,650 | $1.17 | 24d | 1 | 1.27mi |
| 534 Rigsby Ave San Antonio, TX | 3.0 | 2.0 | 1438 | $1,950 | $1.36 | 24d | 1 | 1.27mi |
| 119 W Drexel Ave San Antonio, TX | 4.0 | 2.0 | 1592 | $1,400 | $0.88 | 43d | 1 | 1.31mi |
| 242 Glamis Ave San Antonio, TX | 4.0 | 2.0 | 1464 | $1,900 | $1.30 | 11d | 1 | 1.33mi |
| 636 Rigsby Ave San Antonio, TX | 3.0 | 1.0 | 1327 | $1,595 | $1.20 | 43d | 1 | 1.34mi |
Listing history 18 events
-
2026-06-18days on market $119,000 Active 152 DOM
-
2026-06-17days on market $119,000 Active 151 DOM
-
2026-06-16days on market $119,000 Active 150 DOM
-
2026-06-15days on market $119,000 Active 149 DOM
-
2026-06-13days on market $119,000 Active 147 DOM
-
2026-06-09days on market $119,000 Active 143 DOM
-
2026-06-08days on market $119,000 Active 142 DOM
-
2026-06-07days on market $119,000 Active 141 DOM
-
2026-06-04days on market $119,000 Active 138 DOM
-
2026-06-03days on market $119,000 Active 137 DOM
-
2026-06-02days on market $119,000 Active 136 DOM
-
2026-06-01days on market $119,000 Active 135 DOM
-
2026-05-31days on market $119,000 Active 134 DOM
-
2026-05-01price $119,000 453-char remark
Show marketing remark (453 chars)
***Owner Financing Available!!!*** Charming fixer-upper with endless potential located near downtown San Antonio! This 3-bedroom, 1-bath home sits on a desirable corner lot and features two covered porches, a detached 2-car garage, and mature trees providing great shade and character. Ideal opportunity for investors or buyers looking to renovate and add value in a prime, centrally located area with easy access to downtown, dining, and entertainment.
-
2026-03-21price $139,999 453-char remark
Show marketing remark (453 chars)
***Owner Financing Available!!!*** Charming fixer-upper with endless potential located near downtown San Antonio! This 3-bedroom, 1-bath home sits on a desirable corner lot and features two covered porches, a detached 2-car garage, and mature trees providing great shade and character. Ideal opportunity for investors or buyers looking to renovate and add value in a prime, centrally located area with easy access to downtown, dining, and entertainment.
-
2026-02-09price $144,999 453-char remark
Show marketing remark (453 chars)
***Owner Financing Available!!!*** Charming fixer-upper with endless potential located near downtown San Antonio! This 3-bedroom, 1-bath home sits on a desirable corner lot and features two covered porches, a detached 2-car garage, and mature trees providing great shade and character. Ideal opportunity for investors or buyers looking to renovate and add value in a prime, centrally located area with easy access to downtown, dining, and entertainment.
-
2026-01-17$149,999 New 453-char remark
Show marketing remark (453 chars)
***Owner Financing Available!!!*** Charming fixer-upper with endless potential located near downtown San Antonio! This 3-bedroom, 1-bath home sits on a desirable corner lot and features two covered porches, a detached 2-car garage, and mature trees providing great shade and character. Ideal opportunity for investors or buyers looking to renovate and add value in a prime, centrally located area with easy access to downtown, dining, and entertainment.
-
2023-12-22soldstatus
ⓘ Source: listings_history table (triggers on properties + properties_extension) + one-shot
backfill from property_details.listing_events for pre-trigger history.
Tax reassessment forecast TX · Resets to sale price
- Current annual tax
- $3,661 · $305/mo
- Projected year-2 tax
- $3,661 · $305/mo
- Expected delta
- $0/yr ($0/mo · 0.0%)
ⓘ Screening estimate from a state-policy table — verify with the county assessor before closing.
Climate risk First Street
- Flood 1/10 Low FEMA zone X (unshaded) · 0% chance over 30 yrs
- Wildfire 1/10 Low
- Heat 8/10 Severe 7 d/yr ≥108°F today · 21 d/yr by 30 yrs out
- Wind 8/10 Severe 80% chance of damaging wind over 30 yrs
- Air quality 2/10 Low 1 unhealthy d/yr today · 2 by 30 yrs out
Nearby sold comps map
Loading sold comps map…
Walkable amenities ~0.75 mi
Loading nearby amenities…
Taxation est. · year 1
- Rental income
- $18,354
- − Mortgage interest
- −$6,666
- − Property taxes
- −$3,661
- − Insurance
- −$595
- − Repairs & maintenance
- −$1,468
- − Management
- −$1,468
- − Depreciation
- −$3,462
- Taxable income
- $1,034
- Est. tax owed @ 24.0%
- −$248
- After-tax cash flow
- $2,507/yr
For passive investors: Depreciation is non-cash, so a rental often shows a tax loss while cash-flowing — sheltering income. Rental losses are passive: they offset passive income freely, and up to $25,000/yr can offset ordinary (W-2) income if you actively participate and your MAGI is under $100k (phasing out to $0 by $150k); unused losses carry forward. On sale, claimed depreciation is recaptured at up to 25%, and gains may owe capital-gains tax (a 1031 exchange can defer both). Figures are a year-1 estimate at your 24.0% rate — not tax advice; consult a CPA.
Schools (NCES district)
- District
- San Antonio ISD
- NCES district ID
- 4838730
- Math proficiency
- 12% ▼ -21.00%
- Reading proficiency
- 22% ▼ -7.00%
- Median HH income
- $30,952
- Composite
- 13.57/100
- National rank
- #9512
- State rank
- #805 of 826 in TX
Livability — San Antonio
- Score
- 80/100
- State rank
- #31
- US rank
- #1616
Category grades
Schools grade is shown separately in the Schools card above.
Census & demographics
- Census place
- San Antonio, TX
- County
- Bexar County · 1,990,555 people
- City population
- 1,806,925
- Metro
- San Antonio-New Braunfels, TX
- Population (ZIP)
- 58,983
- Household income
- $52,088
- Rent vs Own
- Severe rent burden
- 2809.0
Population outlook (Bexar County) Hauer SSP2
- Today (2025)
- 2,336,851 people
- By 2030
- 2,560,728 · +9.6%
- By 2040
- 3,020,569 · +29.3%
- By 2050
- 3,493,522 · +49.5%
- By 2075
- 4,668,459 · +99.8%
- By 2100
- 5,533,242 · +136.8%
Race, ethnicity, and origin ACS 2023
- Neighborhood character
- Predominantly Hispanic (76%)
- Race & ethnicity
- Hispanic / Latino 76% Two or more races 28% White 16% Black 5% Asian 2% Native American 1%
- Hispanic origin (detail)
- Mexican 67%
- Common ancestry
- Lithuanian 2% Romanian 1% Slovak 1%
- Foreign-born
- 10% · Canada, Vietnam
- Languages at home
- 63% English-only · Spanish 36%
Political lean MEDSL · Bexar
- 2024 margin
- Lean D (+9.8) · D 54.3% · R 44.6% · Other 1.1%
- 2008→2024 swing
- +4.2pp toward D · 2008: 5.6pp · 2024: 9.8pp
- All cycles
- 2024: D+9.8 2020: D+18.2 2016: D+13.5 2012: D+4.6 2008: D+5.6
Not yet ingested
- Civics
- —
Market trends
- HPI YoY
- ▼ -52.06%
- Current HPI
- 265.2235
- Rent YoY
- ▼ -3.36%
- Metro
- San Antonio-New Braunfels, TX
- State GDP YoY
- ▲ 3.95%
- F500 in state
- 110
Industry mix (Fortune 500 HQ in TX)
| Industry | F500 HQs | Revenue |
|---|---|---|
| Energy | 16 | $1,198B |
|
||
| Technology | 5 | $198B |
|
||
| Engineering / Construction | 4 | $72B |
|
||
| Energy Services | 3 | $60B |
|
||
| Utilities | 3 | $41B |
|
||
| Healthcare | 2 | $330B |
|
||
Price history
-20.7% since first listed5 events — show timeline
- 2026-05-01 Price Changed $119,000 LERA
- 2026-03-21 Price Changed $139,999 LERA
- 2026-02-09 Price Changed $144,999 LERA
- 2026-01-17 Listed $149,999 LERA
- 2023-12-22 Sold (Public Records) — Public Records
Property tax history
+6.3%/yrLatest (2025): $3,661 · +0.0% YoY. Source: county tax records.
Cash-flow waterfall
monthlySold comps — $/sqft
last 12 mo · ≤1 miLoading sold comps…