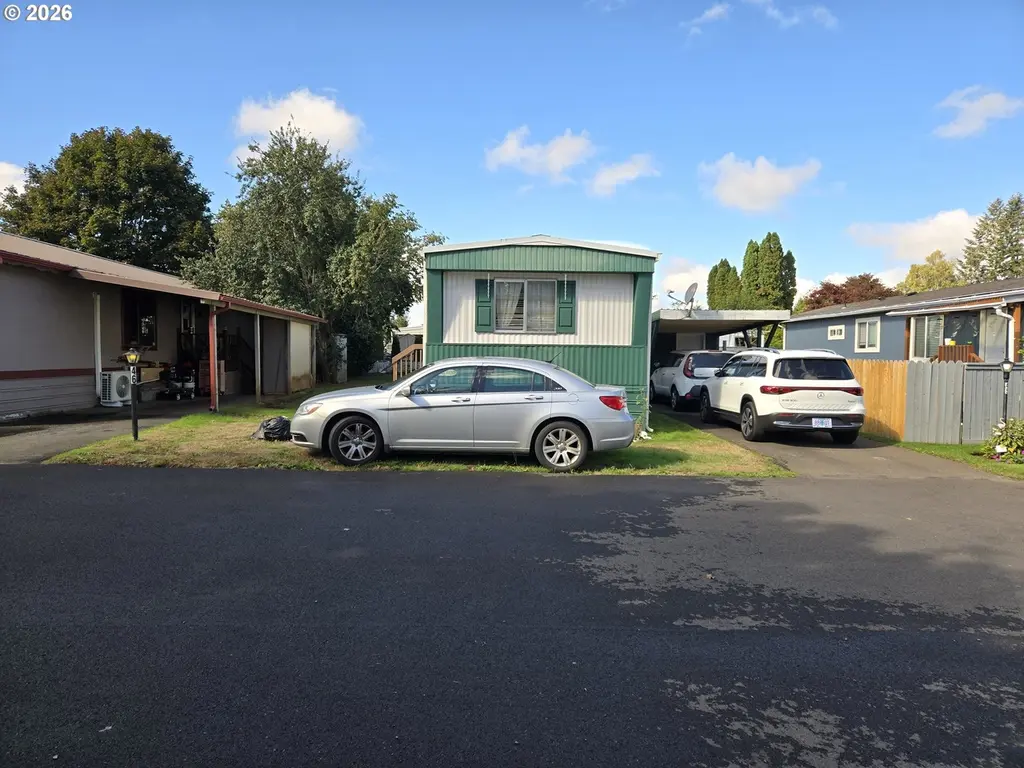
26801 NE 9th St #46 · Fern Prairie, WA
Flood risk No data
- FEMA flood zone
- —
- Chance of flooding over 30 yrs
- —
- Est. flood insurance / yr
- —
Fire risk No data
- Est. fire insurance / yr
- —
Heat risk No data
- Hot days now (above threshold)
- —
- Hot days in 30 yrs
- —
Wind risk No data
- Chance of severe wind over 30 yrs
- —
Air-quality risk No data
- Unhealthy air days now
- —
- Unhealthy air days in 30 yrs
- —
Risk factors via First Street. Map © Google.
Why this score? — see what drove the B- grade
The composite is a weighted blend of 9 inputs, each scored 0–100. Each bar is that input's sub-score; the figure is the points it added to the 100-point composite (weight × sub-score).
- Cash flow +30.0/30.0
- 1% rule +10.0/10.0
- DSCR +10.0/10.0
- Schools +6.9/10.0
- Rent growth +3.1/5.0
- Livability +3.1/5.0
- Condition / age +2.5/5.0
- ARV discount +0.0/15.0
- Appreciation +0.0/10.0
$106,868
🖨 Deal sheet 📄 Offer letter ✓ Due diligence
Listing remarks MLS
A Move-In-Ready Home in the Desirable Camas area featuring 3 Bedrooms, 1.5 Baths, an Open Concept of a Great Room with Laminate Floors throughout and Decent Size of Side Yard. Refrigerator, Washer and Dryer are included. Park rent fee ($780/month) includes water, sewer & garbage. Park does not allow rentals. All other furniture are negotiable. Buyer to verify all information.
Key facts
- Laminate floors
- Move-in-ready home
- Open concept
Tags
Neighborhood map
What this means for you Summary
Snapshot
- This is a 3-bed/2.0-bath manufactured listed at $107k.
Deal economics
- At list price, monthly cash flow is $1k ($13k/yr) — positive.
- The deal already cash-flows at list — no discount required.
- Meets the 1% rule at list price ($2k rent vs $107k).
- Recommended offer: $94k (12.0% below list) — sets the bar for market timing.
Location & tenants
- Location reads 61/100 on livability (#433 in WA) — a middle-class / working-renter tenant base. Strengths: crime A+, employment A+, housing A+; Watch: schools F, amenities F, commute F.
- Camas School District (suburban): math 73% / reading 80% proficiency, ranked #8 of 291 in WA (top 3%) — strong family-tenant draw, lease renewals of 3-5y typical; only 14% free/reduced lunch — higher-income household profile.
- Market conditions: Rents rising (+2.5%/yr); 547 active listings in the ZIP; high-income renter base; 3,547 units permitted in Clark County in 2024 (1,361 in 5+ unit buildings).
Forward outlook
- Local home prices are declining (-3.0%/yr); year-one equity from $739 of loan paydown is wiped out by about $3k of value loss. Plan a longer hold.
- Clark County population projected at +29% by 2050 — long-run rental-demand tailwind backs the buy-and-hold thesis.
- At projected returns (-3.0% appreciation + 2.5% rent growth), your $30k cash investment doubles in ~3 years — after that, you're playing with house money.
Negotiation context
- It's been on market 148 days — a 12% lower offer ($94k) is reasonable based on typical stale-listing flexibility.
Questions for the listing agent
- It's been on market 148 days. Have you received any prior offers? Is the seller open to a 12% concession, seller financing, or rate buy-down credit?
- Why hasn't it sold? Are there any deal-killer items the seller is aware of (foundation, flood, title, zoning, code violations)?
- Is there a deadline driving the sale (1031 exchange, divorce, estate, relocation)? That informs how much negotiation room exists.
- Schools are F-rated, which usually means shorter tenancies and higher turnover. Who's the typical renter profile here, and what's been the actual vacancy rate?
- What's the average days-on-market for RENTAL listings here right now (not sales)? A rising rental-DOM trend means longer vacancies and softer asking-rent achievability than the comps imply.
- What's the recent tenant-quality profile in this submarket — average credit score on applications, eviction rate, late-payment / NSF rate, and stable-employment percentage? A property-management company in the area should have these aggregated.
- How much new for-sale + rental construction is in the pipeline within 1–3 miles? Heavy new supply typically softens prices + rents 12–24 months out; constrained supply supports both.
Investment metrics
- 1% rule
- 2.17% ✓
- Cap rate
- 18.57%
- Cash-on-cash
- 43.85%
- DSCR
- 2.95
- GRM
- 3.8
CMA / ARV
- ARV (on-the-fly)
- $76,692
- Comps found
- 1
Show comp detail 1 sale within ~0.75 mi
| Address | Dist | Beds/Ba | Sqft | Sold | Price | $/sf | Match |
|---|---|---|---|---|---|---|---|
| 26801 NE 9th St | 0.06mi | 2/2.0 (-1) | 924 (0%) | 17mo | $76,400 | $83 | 78 |
Match score weights: distance 35% · size 25% · config 20% · recency 20%. Top-matched comps best support the ARV.
Projected returns pro-forma
-3.0% appreciation · 2.46% rent growth · sell at horizon
- IRR
- 40.2%
- Equity multiple
- 2.71×
- Total profit
- $51,099
- Equity at exit
- $15,934
- IRR
- 46.2%
- Equity multiple
- 5.32×
- Total profit
- $129,216
- Equity at exit
- $9,240
Cash invested: $29,923 (down + closing). Projections, not guarantees.
Landlord ↔ Tenant lean methodology
- Overall (STATE)
- 28 Tenant-Leaning
- State Washington
- 28 Tenant-Leaning · D+8
- County
- — inherits STATE
- City
- — inherits STATE
ZIP-level market 98607
- Rents YoY
- 2.5%
- Active inventory
- 547
- Price-to-rent
- 3.8×
Monthly cashflow live
- Estimated rent
- $2,319 medium interval (Pro) →
- Mortgage (P&I)
- −$560
- Tax est. 1.5%
- −$134 /mo · $1,603/yr
- Insurance
- −$45
- HOA
- −$0
- Vacancy / Maint / Mgmt
- −$487
- Net cashflow
- $1,093
Break-even live
UW: 25.0% down · 7.5% · 30yr · 1.5% tax · 5.0% vac · 8.0% maint · 8.0% mgmt
Financing live
Cash to close
- Down payment
- $26,717
- Closing costs
- $3,206
- Reserves months
- —
- Total cash needed
- —
Loan-product check · same deal, 3 products live
Conventional
25% down · 7.5% · 30yr
- Down + closing
- —
- Monthly P&I
- —
- Monthly cashflow
- —
- DSCR
- —
- Eligible?
- —
Personal DTI + credit; lowest rate.
DSCR
20% down · 8.5% · 30yr
- Down + closing
- —
- Monthly P&I
- —
- Monthly cashflow
- —
- DSCR
- —
- Eligible?
- —
No personal income docs; deal must DSCR.
Hard money
10% down · 12.0% · 12mo
- Down + closing
- —
- Monthly P&I
- —
- Monthly cashflow
- —
- DSCR
- —
- Eligible?
- —
Short-term bridge; refi at stabilization.
Listing history 14 events
-
2026-06-18days on market $106,868 Active 148 DOM
-
2026-06-17days on market $106,868 Active 147 DOM
-
2026-06-16days on market $106,868 Active 146 DOM
-
2026-06-15days on market $106,868 Active 145 DOM
-
2026-06-13days on market $106,868 Active 143 DOM
-
2026-06-13days on market $106,868 Active 142 DOM
-
2026-06-09days on market $106,868 Active 139 DOM
-
2026-06-08days on market $106,868 Active 138 DOM
-
2026-06-07days on market $106,868 Active 137 DOM
-
2026-06-03days on market $106,868 Active 133 DOM
-
2026-06-02days on market $106,868 Active 132 DOM
-
2026-06-01days on market $106,868 Active 131 DOM
-
2026-05-31days on market $106,868 Active 130 DOM
-
2026-01-21$106,868 Active 382-char remark
Show marketing remark (382 chars)
A Move-In-Ready Home in the Desirable Camas area featuring 3 Bedrooms, 1.5 Baths, an Open Concept of a Great Room with Laminate Floors throughout and Decent Size of Side Yard. Refrigerator, Washer and Dryer are included. Park rent fee ($780/month) includes water, sewer & garbage. Park does not allow rentals. All other furniture are negotiable. Buyer to verify all information.
ⓘ Source: listings_history table (triggers on properties + properties_extension) + one-shot
backfill from property_details.listing_events for pre-trigger history.
Nearby sold comps map
Loading sold comps map…
Walkable amenities ~0.75 mi
Loading nearby amenities…
Taxation est. · year 1
- Rental income
- $27,826
- − Mortgage interest
- −$5,986
- − Property taxes
- −$1,603
- − Insurance
- −$534
- − Repairs & maintenance
- −$2,226
- − Management
- −$2,226
- − Depreciation
- −$3,109
- Taxable income
- $12,141
- Est. tax owed @ 24.0%
- −$2,914
- After-tax cash flow
- $10,206/yr
For passive investors: Depreciation is non-cash, so a rental often shows a tax loss while cash-flowing — sheltering income. Rental losses are passive: they offset passive income freely, and up to $25,000/yr can offset ordinary (W-2) income if you actively participate and your MAGI is under $100k (phasing out to $0 by $150k); unused losses carry forward. On sale, claimed depreciation is recaptured at up to 25%, and gains may owe capital-gains tax (a 1031 exchange can defer both). Figures are a year-1 estimate at your 24.0% rate — not tax advice; consult a CPA.
Schools (NCES district)
- District
- Camas School District
- NCES district ID
- 5300810
- Math proficiency
- 73% ▲ 1.00%
- Reading proficiency
- 80% ▼ -2.00%
- Median HH income
- $85,054
- Composite
- 69.02/100
- National rank
- #656
- State rank
- #8 of 291 in WA
Livability — Fern Prairie
- Score
- 61/100
- State rank
- #433
- US rank
- #17502
Category grades
Schools grade is shown separately in the Schools card above.
Census & demographics
- Census place
- Fern Prairie, WA
- County
- Clark County · 513,189 people
- City population
- 35,661
- Metro
- Portland-Vancouver-Hillsboro, OR-WA
- Population (ZIP)
- 35,867
- Household income
- $128,318
- Rent vs Own
- Severe rent burden
- 636.0
Population outlook (Clark County) Hauer SSP2
- Today (2025)
- 529,610 people
- By 2030
- 563,242 · +6.4%
- By 2040
- 625,905 · +18.2%
- By 2050
- 681,558 · +28.7%
- By 2075
- 805,967 · +52.2%
- By 2100
- 877,450 · +65.7%
Race, ethnicity, and origin ACS 2023
- Neighborhood character
- Predominantly White (73%)
- Race & ethnicity
- White 73% Two or more races 11% Asian 10% Hispanic / Latino 5% Black 2%
- Hispanic origin (detail)
- Mexican 3%
- Common ancestry
- Italian 4% Portuguese 4% Lithuanian 2%
- Foreign-born
- 11% · China, Canada, South Korea
- Languages at home
- 87% English-only · Chinese 4% Russian/Polish/Slavic 2% Spanish 2%
Political lean MEDSL · Clark
- 2024 margin
- Lean D (+7.0) · D 52.1% · R 45.1% · Other 2.8%
- 2008→2024 swing
- +0.9pp no change · 2008: 6.1pp · 2024: 7.0pp
- All cycles
- 2024: D+7.0 2020: D+5.1 2016: D+0.1 2012: D+0.1 2008: D+6.1
Not yet ingested
- Civics
- —
Market trends
- HPI YoY
- ▼ -392.89%
- Current HPI
- 296.7273
- Rent YoY
- ▲ 2.46%
- Metro
- Portland-Vancouver-Hillsboro, OR-WA
- State GDP YoY
- ▲ 4.65%
- F500 in state
- 22
Industry mix (Fortune 500 HQ in WA)
| Industry | F500 HQs | Revenue |
|---|---|---|
| Retail | 2 | $269B |
|
||
| Technology / Retail | 1 | $638B |
|
||
| Technology | 1 | $245B |
|
||
| Telecommunications | 1 | $38B |
|
||
| Food / Beverage | 1 | $36B |
|
||
| Automotive / Trucks | 1 | $34B |
|
||
Price history
1 event — show timeline
- 2026-01-21 Listed $106,868 RMLS
Property tax history
-0.9%/yrLatest (2026): $108 · +58.1% YoY. Source: county tax records.
Cash-flow waterfall
monthlySold comps — $/sqft
last 12 mo · ≤1 miLoading sold comps…