12843 Garvey Ave #06 · Baldwin Park, CA
Flood risk No data
- FEMA flood zone
- —
- Chance of flooding over 30 yrs
- —
- Est. flood insurance / yr
- —
Fire risk No data
- Est. fire insurance / yr
- —
Heat risk No data
- Hot days now (above threshold)
- —
- Hot days in 30 yrs
- —
Wind risk No data
- Chance of severe wind over 30 yrs
- —
Air-quality risk No data
- Unhealthy air days now
- —
- Unhealthy air days in 30 yrs
- —
Risk factors via First Street. Map © Google.
Why this score? — see what drove the B- grade
The composite is a weighted blend of 9 inputs, each scored 0–100. Each bar is that input's sub-score; the figure is the points it added to the 100-point composite (weight × sub-score).
- Cash flow +30.0/30.0
- DSCR +10.0/10.0
- 1% rule +9.6/10.0
- ARV discount +7.5/15.0
- Livability +3.3/5.0
- Rent growth +2.5/5.0
- Schools +2.5/10.0
- Condition / age +2.5/5.0
- Appreciation +0.0/10.0
$134,900
🖨 Deal sheet (PDF) 📄 Offer letter ✓ Due diligence
Listing remarks MLS
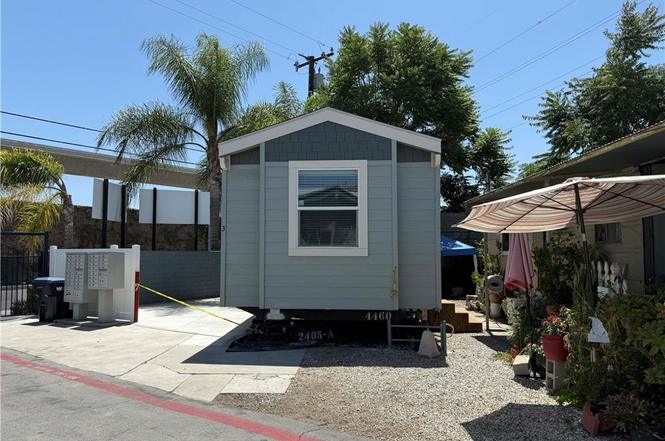
Situated in the gated, all-age, land-leased community of Cooks Trailer Park, this home is approximately 263 sqft. The home features Laguna lower cabinets and upper shelving with piping hardware. Corian countertops throughout, along with Vinyl Plank Flooring, 9' sidewalls, and flat ceilings. The kitchenette includes an under-counter refer and a 2-Burner gas cooktop. Location, location, location! Please get in touch with the property manager for the monthly space rent.
Key facts
- Gated community
- Quartz countertops
- Laminate flooring
Tags
Property features AI
Finance
- Other: Manager approval required for residency; Pets allowed with breed restrictions
- HOA & community: Land lease: $850 per month (park-managed)
Exterior
- Parking: Located in Cooks Trailer Park
- Security: Gated community
- Utilities: Public sewer; District/public water
- Home design: Single-story; Entry at side; Entry level: 1; Mobile home on site (14' x 36' model 67-E517-B); Density: 21-25 units per acre
- Construction: Shingle roof; Year built per builder
- Exterior features: No pool; Street lighting; Suburban neighborhood
Interior
- Kitchen: Microwave; Refrigerator; Gas range; Dishwasher; Quartz counters
- Bedrooms: All bedrooms on the main level
- Flooring: Laminate flooring
- Bathrooms: 1 full bathroom
- Heating & cooling: Forced air heating; Central cooling
- Interior features: Quartz counters; High ceilings (9 feet+); Gated community; Two or more access exits
- Laundry & utility: Inside laundry with washer and dryer included; Stackable washer/dryer
Neighborhood map
What this means for you Summary
Snapshot
- This is a 1-bed/1.0-bath manufactured listed at $135k.
Deal economics
- At list price, monthly cash flow is $626 ($8k/yr) — positive.
- The deal already cash-flows at list — no discount required.
- Meets the 1% rule at list price ($2k rent vs $135k).
- Cap rate 11.9% vs local median 2.8% in Baldwin Park — top-decile yield for the area; either an underpriced asset or a hidden risk that comps aren't pricing in. Stress-test before assuming the spread holds.
Location & tenants
- Location reads 66/100 on livability (#357 in CA) — a middle-class / working-renter tenant base. Strengths: commute A+, employment B+; Watch: crime C-, cost of living F, health & safety F.
- Baldwin Park Unified (suburban): math 20% / reading 37% proficiency, ranked #359 of 517 in CA (top 69%) — low school quality limits family demand, transient renter base, plan for 1-2y turnover; 74% free/reduced lunch — lower-income household profile, screen leases tightly.
- Zoned schools: De Anza Elementary (math 19% / reading 31%, grade F, #959 of 1,571 statewide, top 62%, 419 students, 89% FRL); Sierra Vista Middle (math 30% / reading 44%, grade F, #170 of 498 statewide, top 35%, 803 students, 88% FRL); Sierra Vista High (math 25% / reading 58%, grade F, #498 of 1,170 statewide, top 43%, 1,752 students, 84% FRL).
- Market conditions: 53 active listings in the ZIP; 2 comparable units currently listed for rent nearby; solid renter incomes; 19,697 units permitted in Los Angeles County in 2024 (9,426 in 5+ unit buildings).
Forward outlook
- Local home prices are declining (-3.0%/yr); year-one equity from $933 of loan paydown is wiped out by about $4k of value loss. Plan a longer hold.
- Los Angeles County population projected at +9% by 2050 — modest demand growth; plan on rents tracking national, not racing it.
- At projected returns (-3.0% appreciation + 3.0% rent growth), your $38k cash investment doubles in ~7 years — after that, you're playing with house money.
Negotiation context
- Only 8 days on market — expect competitive offers; lowballing is unlikely to land.
- Current owner paid $54k; list at $135k implies a 150% gain — meaningful room to come down on a strong offer.
Questions for the listing agent
- Is there a deadline driving the sale (1031 exchange, divorce, estate, relocation)? That informs how much negotiation room exists.
- Schools are D-rated, which usually means shorter tenancies and higher turnover. Who's the typical renter profile here, and what's been the actual vacancy rate?
- What's the average days-on-market for RENTAL listings here right now (not sales)? A rising rental-DOM trend means longer vacancies and softer asking-rent achievability than the comps imply.
- What's the recent tenant-quality profile in this submarket — average credit score on applications, eviction rate, late-payment / NSF rate, and stable-employment percentage? A property-management company in the area should have these aggregated.
- How much new for-sale + rental construction is in the pipeline within 1–3 miles? Heavy new supply typically softens prices + rents 12–24 months out; constrained supply supports both.
Investment metrics
- 1% rule
- 1.46% ✓
- Cap rate
- 11.86%
- Cash-on-cash
- 19.90%
- DSCR
- 1.89
- GRM
- 5.7
CMA / ARV
No comps found within radius.
Projected returns pro-forma
-3.0% appreciation · 3.0% rent growth · sell at horizon
- IRR
- 12.0%
- Equity multiple
- 1.48×
- Total profit
- $18,060
- Equity at exit
- $20,114
- IRR
- 21.0%
- Equity multiple
- 2.78×
- Total profit
- $67,211
- Equity at exit
- $11,664
Cash invested: $37,772 (down + closing). Projections, not guarantees.
Landlord ↔ Tenant lean methodology
- Overall (STATE)
- 18 Strongly Tenant-Friendly
- State California
- 18 Strongly Tenant-Friendly · D+13
- County
- — inherits STATE
- City
- — inherits STATE
ZIP-level market 91706
- Active inventory
- 53
- Price-to-rent
- 5.7×
Monthly cashflow live
- Estimated rent
- $1,973 medium interval (Pro) →
- Mortgage (P&I)
- −$707
- Tax est. 1.5%
- −$169 /mo · $2,024/yr
- Insurance
- −$56
- HOA
- −$0
- Vacancy / Maint / Mgmt
- −$414
- Net cashflow
- $626
Break-even live
Sensitivity live
| Price | -10% $720 | -5% $673 | +0% $626 | +5% $580 | +10% $533 |
|---|---|---|---|---|---|
| Rent | -10% $470 | -5% $548 | +0% $626 | +5% $704 | +10% $782 |
| Rate | -1.0pp $694 | -0.5pp $661 | base $626 | +0.5pp $591 | +1.0pp $556 |
UW: 25.0% down · 7.5% · 30yr · 1.5% tax · 5.0% vac · 8.0% maint · 8.0% mgmt
Financing live
Cash to close
- Down payment
- $33,725
- Closing costs
- $4,047
- Reserves months
- —
- Total cash needed
- —
Loan-product check · same deal, 3 products live
Conventional
25% down · 7.5% · 30yr
- Down + closing
- —
- Monthly P&I
- —
- Monthly cashflow
- —
- DSCR
- —
- Eligible?
- —
Personal DTI + credit; lowest rate.
DSCR
20% down · 8.5% · 30yr
- Down + closing
- —
- Monthly P&I
- —
- Monthly cashflow
- —
- DSCR
- —
- Eligible?
- —
No personal income docs; deal must DSCR.
Hard money
10% down · 12.0% · 12mo
- Down + closing
- —
- Monthly P&I
- —
- Monthly cashflow
- —
- DSCR
- —
- Eligible?
- —
Short-term bridge; refi at stabilization.
Rent comps 2 comps
| Address | Beds | Baths | Sqft | Rent | $/sqft | DOM | Units | Dist |
|---|---|---|---|---|---|---|---|---|
| 106 1/2 Santa Mariana Ave Unit 106 La Puente, CA | 1.0 | 1.0 | 300 | $1,675 | $5.58 | 45d | 1 | 1.15mi |
| 243 S Orange Blossom Ave Unit b La Puente, CA | 1.0 | 1.0 | 300 | $1,400 | $4.67 | 45d | 1 | 1.45mi |
Listing history 7 events
-
2026-06-18days on market $134,900 Coming Soon 8 DOM
-
2026-06-17days on market $134,900 Coming Soon 7 DOM
-
2026-06-16days on market $134,900 Coming Soon 6 DOM
-
2026-06-15days on market $134,900 Coming Soon 5 DOM
-
2026-06-13days on market $134,900 Coming Soon 3 DOM
-
2026-06-13remarks 493-char remark
-
2026-06-13$134,900 Coming Soon 2 DOM
ⓘ Source: listings_history table (triggers on properties + properties_extension) + one-shot
backfill from property_details.listing_events for pre-trigger history.
Nearby sold comps map
Loading sold comps map…
Walkable amenities ~0.75 mi
Loading nearby amenities…
Taxation est. · year 1
- Rental income
- $23,674
- − Mortgage interest
- −$7,556
- − Property taxes
- −$2,024
- − Insurance
- −$674
- − Repairs & maintenance
- −$1,894
- − Management
- −$1,894
- − Depreciation
- −$3,924
- Taxable income
- $5,708
- Est. tax owed @ 24.0%
- −$1,370
- After-tax cash flow
- $6,146/yr
For passive investors: Depreciation is non-cash, so a rental often shows a tax loss while cash-flowing — sheltering income. Rental losses are passive: they offset passive income freely, and up to $25,000/yr can offset ordinary (W-2) income if you actively participate and your MAGI is under $100k (phasing out to $0 by $150k); unused losses carry forward. On sale, claimed depreciation is recaptured at up to 25%, and gains may owe capital-gains tax (a 1031 exchange can defer both). Figures are a year-1 estimate at your 24.0% rate — not tax advice; consult a CPA.
Schools (NCES district)
- District
- Baldwin Park Unified
- NCES district ID
- 0603690
- Math proficiency
- 20% ▼ -9.00%
- Reading proficiency
- 37% ▼ -7.00%
- Median HH income
- $53,156
- Composite
- 25.2/100
- National rank
- #7510
- State rank
- #359 of 517 in CA
Livability — Baldwin Park
- Score
- 66/100
- State rank
- #357
- US rank
- #12192
Category grades
Schools grade is shown separately in the Schools card above.
Census & demographics
- Census place
- Baldwin Park, CA
- County
- Los Angeles County · 9,444,647 people
- City population
- 71,082
- Metro
- Los Angeles-Long Beach-Anaheim, CA
- Population (ZIP)
- 71,082
- Household income
- $81,122
- Rent vs Own
- Severe rent burden
- 1946.0
Population outlook (Los Angeles County) Hauer SSP2
- Today (2025)
- 10,940,515 people
- By 2030
- 11,256,481 · +2.9%
- By 2040
- 11,729,929 · +7.2%
- By 2050
- 11,948,407 · +9.2%
- By 2075
- 11,818,114 · +8.0%
- By 2100
- 10,842,928 · -0.9%
Race, ethnicity, and origin ACS 2023
- Neighborhood character
- Predominantly Hispanic (73%)
- Race & ethnicity
- Hispanic / Latino 73% Two or more races 24% Asian 22% Native American 3% White 3%
- Hispanic origin (detail)
- Mexican 63%
- Foreign-born
- 44% · Canada, China, Vietnam
- Languages at home
- 21% English-only · Spanish 60% Chinese 10% Vietnamese 4%
Political lean MEDSL · Los Angeles
- 2024 margin
- Solid D (+32.9) · D 64.8% · R 31.9% · Other 3.3%
- 2008→2024 swing
- -7.4pp toward R · 2008: 40.4pp · 2024: 32.9pp
- All cycles
- 2024: D+32.9 2020: D+44.2 2016: D+48.0 2012: D+40.0 2008: D+40.4
Not yet ingested
- Civics
- —
Market trends
- HPI YoY
- ▼ -1031.00%
- Current HPI
- 458.8227
- Rent YoY
- —
- Metro
- Los Angeles-Long Beach-Anaheim, CA
- State GDP YoY
- ▲ 3.21%
- F500 in state
- 116
Industry mix (Fortune 500 HQ in CA)
| Industry | F500 HQs | Revenue |
|---|---|---|
| Technology | 27 | $1,492B |
|
||
| Financial Services | 3 | $174B |
|
||
| Retail | 3 | $44B |
|
||
| Insurance | 3 | $26B |
|
||
| Media / Entertainment | 2 | $115B |
|
||
| Pharmaceuticals / Biotech | 2 | $62B |
|
||
Price history
+68.6% since first listed7 events — show timeline
- 2026-06-10 Coming Soon $134,900 CRMLS
- 2023-05-18 Sold (MLS) $54,000 CRMLS
- 2023-05-05 Pending — CRMLS
- 2022-11-10 Price Changed $59,999 CRMLS
- 2022-07-19 Price Changed $64,999 CRMLS
- 2022-01-28 Price Changed $69,999 CRMLS
- 2021-09-30 Listed $79,999 CRMLS
Cash-flow waterfall
monthlySold comps — $/sqft
last 12 mo · ≤1 miLoading sold comps…