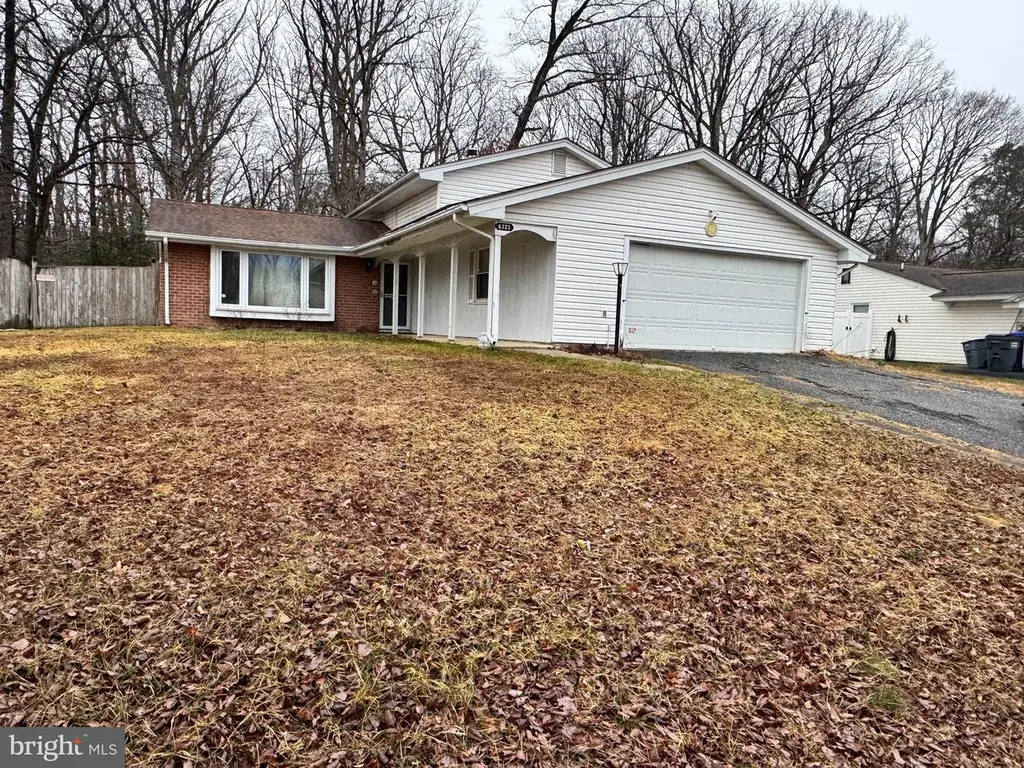
6323 Josephine Rd · Waldorf, MD
Flood risk 1/10 · Minimal
- FEMA flood zone
- X (unshaded)
- Chance of flooding over 30 yrs
- 0.0%
- Est. flood insurance / yr
- $507 – $1,088
Fire risk 5/10 · Moderate
- Est. fire insurance / yr
- $755 – $1,403
Heat risk 8/10 · Major
- Hot days now (above 104°F)
- 7 days/yr
- Hot days in 30 yrs
- 16 days/yr
Wind risk 6/10 · Moderate
- Chance of severe wind over 30 yrs
- 27.0%
Air-quality risk 2/10 · Minimal
- Unhealthy air days now
- 1 days/yr
- Unhealthy air days in 30 yrs
- 2 days/yr
Risk factors via First Street. Map © Google.
Why this score? — see what drove the C- grade
The composite is a weighted blend of 9 inputs, each scored 0–100. Each bar is that input's sub-score; the figure is the points it added to the 100-point composite (weight × sub-score).
- Cash flow +15.9/30.0
- ARV discount +15.0/15.0
- DSCR +4.9/10.0
- 1% rule +4.3/10.0
- Livability +3.6/5.0
- Rent growth +3.3/5.0
- Condition / age +2.5/5.0
- Schools +2.3/10.0
- Appreciation +0.0/10.0
$339,000
🖨 Deal sheet 📄 Offer letter ✓ Due diligence
Listing remarks MLS
Do not miss this rare, discounted foreclosure offering in desirable Pinefield subdivision. This 4 bedroom 3 full bath oversized property is ready for a full renovation. Renovate it for profit or make it your own and start with instant equity. The property is priced to sell in as-is condition. Cash or Hard Money Only. Buyer pays all transfer and recordation costs. Seller strongly prefers New World Title for settlement. Listing is for informational purposes, seller makes no guarantees in accuracy, buyers are expected to do their own due diligence.
Key facts
- Full renovation
- Instant equity
- 0.24 acre lot
Tags
Neighborhood map
What this means for you Summary
Snapshot
- This is a 4-bed/3.0-bath single-family listed at $339k.
Deal economics
- At list price, monthly cash flow is $159 ($2k/yr) — positive.
- The deal already cash-flows at list — no discount required.
- To meet the 1% rule (rent ≥ 1% of price), the offer needs to be $316k (6.7% below list).
- Recommended offer: $316k (6.7% below list) — sets the bar for 1% rule.
- Cap rate 6.9% vs local median 4.8% in Waldorf — top-decile yield for the area; either an underpriced asset or a hidden risk that comps aren't pricing in. Stress-test before assuming the spread holds.
Location & tenants
- Location reads 72/100 on livability (#141 in MD) — a middle-class / working-renter tenant base. Strengths: commute A+, employment A+, housing A+; Watch: schools D+, crime D-, amenities F.
- Charles County Public Schools (suburban): math 13% / reading 29% proficiency, ranked #14 of 24 in MD (top 58%) — low school quality limits family demand, transient renter base, plan for 1-2y turnover.
- Market conditions: Rents rising (+3.4%/yr); 181 active listings in the ZIP; 5 comparable units currently listed for rent nearby; rentals at typical pace (median 22d on market — plan ~3-4 weeks tenant-placement turnaround); high-income renter base; 1,542 units permitted in Charles County in 2024 (516 in 5+ unit buildings).
- This rent runs 32% of the median local income ($117k/yr) — at the standard rent-burdened threshold; future hikes will face affordability resistance.
Forward outlook
- Local home prices are declining (-3.0%/yr); year-one equity from $2k of loan paydown is wiped out by about $10k of value loss. Plan a longer hold.
- Charles County population projected at +27% by 2050 — long-run rental-demand tailwind backs the buy-and-hold thesis.
Negotiation context
- It's been on market 30 days — a 2% lower offer ($334k) is reasonable based on typical stale-listing flexibility.
- 6 sale attempts since 26y ago with the ask held roughly flat each time — persistent listings suggest the price (not the market) is what's stuck; bring a comps-based counter.
- Current owner paid $271k; 25% above their basis — modest negotiation headroom, anchor on the comps not their cost.
Risks & watch-outs
- Climate carrying-cost: major wind risk, 27% chance of damaging wind over 30y; moderate wildfire risk; extreme-heat days projected 7→16/yr by 2055 (HVAC capex compounding) — expect insurance premiums to compound above CPI over the hold.
Questions for the listing agent
- Built in 1978 — when were the roof, HVAC, electrical panel, plumbing, and water heater last replaced?
- Is there a deadline driving the sale (1031 exchange, divorce, estate, relocation)? That informs how much negotiation room exists.
- Schools are D-rated, which usually means shorter tenancies and higher turnover. Who's the typical renter profile here, and what's been the actual vacancy rate?
- Crime grade is D in this area — have there been break-ins, vandalism, or insurance claims at this property in the last 3 years? What carrier currently insures it and at what premium?
- What's the average days-on-market for RENTAL listings here right now (not sales)? A rising rental-DOM trend means longer vacancies and softer asking-rent achievability than the comps imply.
- What's the recent tenant-quality profile in this submarket — average credit score on applications, eviction rate, late-payment / NSF rate, and stable-employment percentage? A property-management company in the area should have these aggregated.
- How much new for-sale + rental construction is in the pipeline within 1–3 miles? Heavy new supply typically softens prices + rents 12–24 months out; constrained supply supports both.
Investment metrics
- 1% rule
- 0.93% ✗
- Cap rate
- 6.86%
- Cash-on-cash
- 2.02%
- DSCR
- 1.09
- GRM
- 8.9
CMA / ARV
- ARV (median comp)
- $455,737
- List price
- $339,000
- Delta
- -25.61%
- Verdict
- UNDERPRICED
- Comps
- 20 within 1.0 mi
Show comp detail 12 sales within ~0.75 mi
| Address | Dist | Beds/Ba | Sqft | Sold | Price | $/sf | Match |
|---|---|---|---|---|---|---|---|
| 2300 Hawks Landing Ct | 0.12mi | 4/2.5 | 2,208 (-4%) | 2mo | $540,000 | $245 | 84 |
| 3109 Tudor Rd | 0.40mi | 4/3.0 | 2,236 (-3%) | 2mo | $445,000 | $199 | 74 |
| 2709 Pinewood Dr | 0.38mi | 4/3.0 | 2,206 (-4%) | 1mo | $340,000 | $154 | 74 |
| 2730 Pinewood Dr | 0.22mi | 4/3.0 | 2,086 (-10%) | 2mo | $476,900 | $229 | 71 |
| 5914 Michael Rd | 0.18mi | 4/3.0 | 2,086 (-10%) | 5mo | $479,000 | $230 | 71 |
| 2525 Green Pine Ct | 0.53mi | 4/2.5 | 2,316 (+0%) | 3mo | $510,000 | $220 | 71 |
| 5923 Michael Rd | 0.16mi | 4/3.0 | 1,968 (-15%) | 1mo | $460,000 | $234 | 67 |
| 5202 Caroline Cir | 0.27mi | 4/3.0 | 2,086 (-10%) | 6mo | $285,000 | $137 | 66 |
| 2434 Pinefield Rd | 0.28mi | 5/4.0 (+1) | 2,614 (+13%) | 0mo | $500,000 | $191 | 56 |
| 2540 Green Pine Ct | 0.58mi | 4/2.5 | 2,062 (-11%) | 6mo | $490,000 | $238 | 48 |
| 3907 Brewster Ct | 0.65mi | 4/3.0 | 2,086 (-10%) | 7mo | $415,000 | $199 | 48 |
| 1405 Harwich Cir | 0.62mi | 4/3.0 | 2,560 (+11%) | 8mo | $525,000 | $205 | 46 |
Match score weights: distance 35% · size 25% · config 20% · recency 20%. Top-matched comps best support the ARV.
Projected returns pro-forma
-3.0% appreciation · 3.37% rent growth · sell at horizon
- IRR
- -12.7%
- Equity multiple
- 0.54×
- Total profit
- $-43,548
- Equity at exit
- $50,546
- IRR
- -3.1%
- Equity multiple
- 0.79×
- Total profit
- $-19,768
- Equity at exit
- $29,311
Cash invested: $94,920 (down + closing). Projections, not guarantees.
Landlord ↔ Tenant lean methodology
- Overall (STATE)
- 27 Tenant-Leaning
- State Maryland
- 27 Tenant-Leaning · D+14
- County
- — inherits STATE
- City
- — inherits STATE
ZIP-level market 20601
- Home prices YoY
- -24.2%
- Rents YoY
- 3.4%
- Active inventory
- 181
- Price-to-rent
- 8.9×
Monthly cashflow live
- Estimated rent
- $3,164 high interval (Pro) →
- Mortgage (P&I)
- −$1,778
- Tax from tax record
- −$421 /mo · $5,055/yr
- Insurance
- −$141
- HOA
- −$0
- Vacancy / Maint / Mgmt
- −$664
- Net cashflow
- $159
Break-even live
UW: 25.0% down · 7.5% · 30yr · 1.5% tax · 5.0% vac · 8.0% maint · 8.0% mgmt
Financing live
Cash to close
- Down payment
- $84,750
- Closing costs
- $10,170
- Reserves months
- —
- Total cash needed
- —
Loan-product check · same deal, 3 products live
Conventional
25% down · 7.5% · 30yr
- Down + closing
- —
- Monthly P&I
- —
- Monthly cashflow
- —
- DSCR
- —
- Eligible?
- —
Personal DTI + credit; lowest rate.
DSCR
20% down · 8.5% · 30yr
- Down + closing
- —
- Monthly P&I
- —
- Monthly cashflow
- —
- DSCR
- —
- Eligible?
- —
No personal income docs; deal must DSCR.
Hard money
10% down · 12.0% · 12mo
- Down + closing
- —
- Monthly P&I
- —
- Monthly cashflow
- —
- DSCR
- —
- Eligible?
- —
Short-term bridge; refi at stabilization.
Rent comps 5 comps
| Address | Beds | Baths | Sqft | Rent | $/sqft | DOM | Units | Dist |
|---|---|---|---|---|---|---|---|---|
| 5004 Nicholas Rd Waldorf, MD | 4.0 | 2.0 | 1864 | $2,700 | $1.45 | 22d | 1 | 0.40mi |
| 1314 Harwich Dr Waldorf, MD | 4.0 | 2.0 | 1974 | $3,995 | $2.02 | 1d | 1 | 0.56mi |
| 3506 Lisa Ln Waldorf, MD | 4.0 | 2.0 | 1822 | $2,950 | $1.62 | 43d | 1 | 0.83mi |
| 2450 Indian Ct Waldorf, MD | 3.0 | 2.5 | 2600 | $2,900 | $1.12 | 24d | 1 | 0.98mi |
| 2450 Indian Ct Waldorf, MD | 3.0 | 2.5 | 2600 | $2,900 | $1.12 | 22d | 1 | 0.98mi |
Listing history 21 events
-
2026-05-07status Pending 552-char remark
Show marketing remark (552 chars)
Do not miss this rare, discounted foreclosure offering in desirable Pinefield subdivision. This 4 bedroom 3 full bath oversized property is ready for a full renovation. Renovate it for profit or make it your own and start with instant equity. The property is priced to sell in as-is condition. Cash or Hard Money Only. Buyer pays all transfer and recordation costs. Seller strongly prefers New World Title for settlement. Listing is for informational purposes, seller makes no guarantees in accuracy, buyers are expected to do their own due diligence.
-
2026-04-07$339,000 Active 552-char remark
Show marketing remark (552 chars)
Do not miss this rare, discounted foreclosure offering in desirable Pinefield subdivision. This 4 bedroom 3 full bath oversized property is ready for a full renovation. Renovate it for profit or make it your own and start with instant equity. The property is priced to sell in as-is condition. Cash or Hard Money Only. Buyer pays all transfer and recordation costs. Seller strongly prefers New World Title for settlement. Listing is for informational purposes, seller makes no guarantees in accuracy, buyers are expected to do their own due diligence.
-
2025-09-23historical
-
2025-07-08price $410,000
-
2025-05-22$435,000 Active
-
2025-05-07historical
-
2016-07-14soldstatus $271,000
-
2016-07-05soldstatus $271,000 Sold
-
2016-07-05soldstatus $271,000
-
2016-05-29status Contingent (No Kick Out)
-
2016-03-22price $269,900
-
2015-11-15$279,900 Active
-
2014-12-19historical Temporarily Off-Market
-
2014-12-19historical
-
2014-12-11Active
-
2014-12-10$259,900
-
2000-12-07soldstatus $169,900
-
2000-12-01soldstatus $169,900
-
2000-11-06historical
-
2000-09-30$169,900
-
1992-01-07soldstatus $115,000
ⓘ Source: listings_history table (triggers on properties + properties_extension) + one-shot
backfill from property_details.listing_events for pre-trigger history.
Tax reassessment forecast MD · Partial reset (capped growth)
- Current annual tax
- $5,055 · $421/mo
- Projected year-2 tax
- $5,055 · $421/mo
- Expected delta
- $0/yr ($0/mo · 0.0%)
ⓘ Screening estimate from a state-policy table — verify with the county assessor before closing.
Climate risk First Street
- Flood 1/10 Low FEMA zone X (unshaded) · 0% chance over 30 yrs
- Wildfire 5/10 Major
- Heat 8/10 Severe 7 d/yr ≥104°F today · 16 d/yr by 30 yrs out
- Wind 6/10 Major 27% chance of damaging wind over 30 yrs
- Air quality 2/10 Low 1 unhealthy d/yr today · 2 by 30 yrs out
Nearby sold comps map
Loading sold comps map…
Walkable amenities ~0.75 mi
Loading nearby amenities…
Taxation est. · year 1
- Rental income
- $37,970
- − Mortgage interest
- −$18,989
- − Property taxes
- −$5,055
- − Insurance
- −$1,695
- − Repairs & maintenance
- −$3,038
- − Management
- −$3,038
- − Depreciation
- −$9,862
- Taxable loss
- −$3,706
- Est. tax savings @ 24.0%
- +$889
- After-tax cash flow
- $2,803/yr
For passive investors: Depreciation is non-cash, so a rental often shows a tax loss while cash-flowing — sheltering income. Rental losses are passive: they offset passive income freely, and up to $25,000/yr can offset ordinary (W-2) income if you actively participate and your MAGI is under $100k (phasing out to $0 by $150k); unused losses carry forward. On sale, claimed depreciation is recaptured at up to 25%, and gains may owe capital-gains tax (a 1031 exchange can defer both). Figures are a year-1 estimate at your 24.0% rate — not tax advice; consult a CPA.
Schools (NCES district)
- District
- Charles County Public Schools
- NCES district ID
- 2400270
- Math proficiency
- 13% ▼ -19.00%
- Reading proficiency
- 29% ▼ -13.00%
- Median HH income
- $90,389
- Composite
- 22.54/100
- National rank
- #8087
- State rank
- #14 of 24 in MD
Livability — Waldorf
- Score
- 72/100
- State rank
- #141
- US rank
- #6083
Category grades
Schools grade is shown separately in the Schools card above.
Census & demographics
- Census place
- Waldorf, MD
- County
- Charles County · 103,527 people
- City population
- 103,527
- Metro
- Washington-Arlington-Alexandria, DC-VA-MD-WV
- Population (ZIP)
- 26,945
- Household income
- $117,480
- Rent vs Own
- Severe rent burden
- 369.0
Population outlook (Charles County) Hauer SSP2
- Today (2025)
- 176,616 people
- By 2030
- 186,471 · +5.6%
- By 2040
- 206,472 · +16.9%
- By 2050
- 224,883 · +27.3%
- By 2075
- 272,101 · +54.1%
- By 2100
- 303,564 · +71.9%
Race, ethnicity, and origin ACS 2023
- Neighborhood character
- Diverse neighborhood (Simpson 0.62)
- Race & ethnicity
- Black 55% White 24% Hispanic / Latino 9% Two or more races 9% Asian 3%
- Hispanic origin (detail)
- Mexican 3% Puerto Rican 2%
- Common ancestry
- Lithuanian 1% Romanian 1% Italian 1%
- Foreign-born
- 10% · Canada, China
- Languages at home
- 87% English-only · Spanish 8% Tagalog/Filipino 1% French/Haitian/Cajun 1%
Political lean MEDSL · Charles
- 2024 margin
- Solid D (+40.7) · D 69.2% · R 28.5% · Other 2.2%
- 2008→2024 swing
- +15.2pp toward D · 2008: 25.5pp · 2024: 40.7pp
- All cycles
- 2024: D+40.7 2020: D+40.9 2016: D+30.2 2012: D+31.3 2008: D+25.5
Not yet ingested
- Civics
- —
Market trends
- HPI YoY
- ▼ -76.84%
- Current HPI
- 241.1912
- Rent YoY
- ▲ 3.37%
- Metro
- Washington-Arlington-Alexandria, DC-VA-MD-WV
- State GDP YoY
- ▲ 2.97%
- F500 in state
- 12
Industry mix (Fortune 500 HQ in MD)
| Industry | F500 HQs | Revenue |
|---|---|---|
| Aerospace / Defense | 1 | $71B |
|
||
| Utilities | 1 | $25B |
|
||
| Hotels | 1 | $24B |
|
||
| Consumer Goods | 1 | $7B |
|
||
| Real Estate | 1 | $6B |
|
||
| Chemicals | 1 | $2B |
|
||
Price history
+194.8% since first listed21 events — show timeline
- 2026-05-07 Pending — BRIGHT MLS
- 2026-04-07 Listed $339,000 BRIGHT MLS
- 2025-09-23 Listing Removed — BRIGHT MLS
- 2025-07-08 Price Changed $410,000 BRIGHT MLS
- 2025-05-22 Listed $435,000 BRIGHT MLS
- 2025-05-07 Coming Soon — BRIGHT MLS
- 2016-07-14 Sold (Public Records) $271,000 Public Records
- 2016-07-05 Sold (MLS) $271,000 BRIGHT MLS
- 2016-07-05 Sold (MLS) $271,000 MRIS
- 2016-05-29 Pending — MRIS
- 2016-03-22 Price Changed $269,900 MRIS
- 2015-11-15 Listed $279,900 MRIS
- 2014-12-19 Listing Removed — BRIGHT MLS
- 2014-12-19 Delisted — MRIS
- 2014-12-11 Listed — MRIS
- 2014-12-10 Listed $259,900 BRIGHT MLS
- 2000-12-07 Sold (Public Records) $169,900 Public Records
- 2000-12-01 Sold (MLS) $169,900 MRIS
- 2000-11-06 Delisted — MRIS
- 2000-09-30 Listed $169,900 MRIS
- 1992-01-07 Sold (Public Records) $115,000 Public Records
Property tax history
+4.2%/yrLatest (2025): $5,055 · +7.2% YoY. Source: county tax records.
Cash-flow waterfall
monthlySold comps — $/sqft
last 12 mo · ≤1 miLoading sold comps…