20329 Mission Rd SE · Cass Lake, MN
Flood risk 4/10 · Minor
- FEMA flood zone
- —
- Chance of flooding over 30 yrs
- 0.2%
- Est. flood insurance / yr
- —
Fire risk 4/10 · Minor
- Est. fire insurance / yr
- $888 – $1,650
Heat risk 1/10 · Minimal
- Hot days now (above 93°F)
- 7 days/yr
- Hot days in 30 yrs
- 12 days/yr
Wind risk 1/10 · Minimal
- Chance of severe wind over 30 yrs
- —
Air-quality risk 4/10 · Minor
- Unhealthy air days now
- 4 days/yr
- Unhealthy air days in 30 yrs
- 5 days/yr
Risk factors via First Street. Map © Google.
Why this score? — see what drove the B- grade
The composite is a weighted blend of 9 inputs, each scored 0–100. Each bar is that input's sub-score; the figure is the points it added to the 100-point composite (weight × sub-score).
- Cash flow +24.8/30.0
- Appreciation +8.4/10.0
- DSCR +8.0/10.0
- ARV discount +7.5/15.0
- 1% rule +6.2/10.0
- Schools +3.9/10.0
- Livability +3.6/5.0
- Rent growth +2.5/5.0
- Condition / age +2.5/5.0
$94,900
🖨 Deal sheet (PDF) 📄 Offer letter ✓ Due diligence
Listing remarks MLS
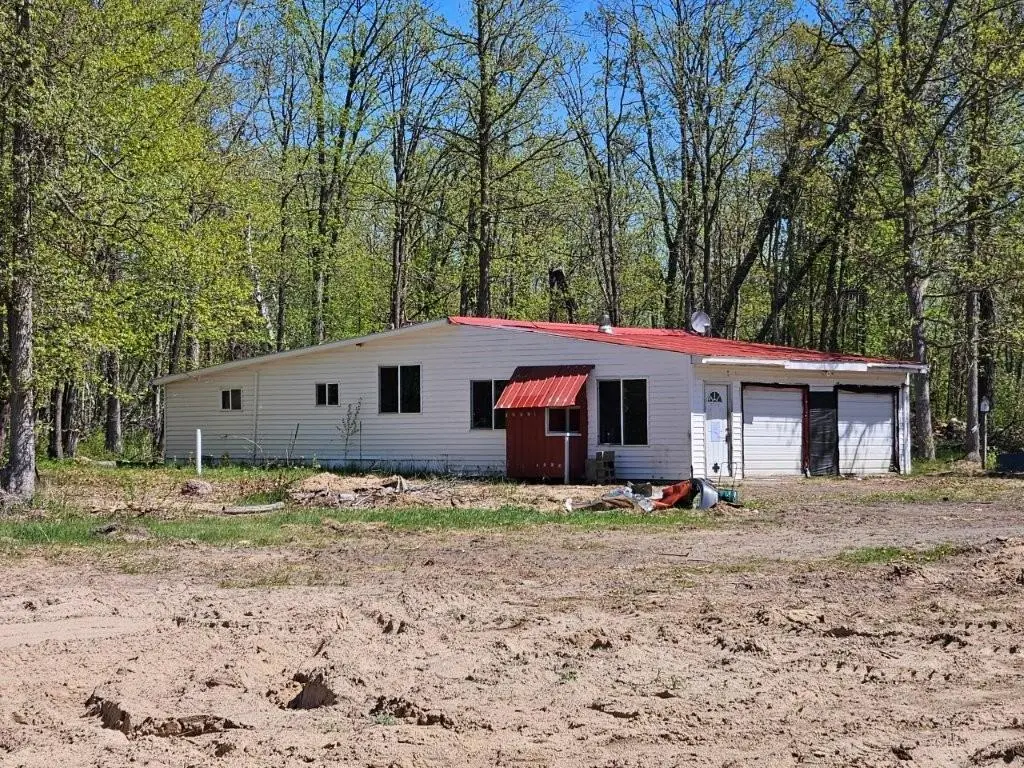
Two bedroom home with double attached garage on 10 beautiful wooded acres. AS-IS. Old moble home also on property.
Key facts
- Heavily wooded
- 10.12 acre lot
- 2 garage spots
Tags
Property features AI
Exterior
- Parking: Attached garage with gravel driveway; 2-car garage (24 x 28)
- Utilities: Drilled well with 4-inch submersible pump; Private sewer; Propane fuel; Electric service by Beltrami Electric Cooperative
- Home design: Residential property; One-story; Entry on main level
- Construction: Frame construction; Roof older than 8 years; Other foundation
- Exterior features: Vinyl exterior; Heavy tree coverage; Paved county road frontage; Publicly maintained road
Interior
- Kitchen: Range; Refrigerator
- Bedrooms: 2 bedrooms (both on main level)
- Bathrooms: 1 full bathroom (main level)
- Heating & cooling: Forced air heating; No central air
- Interior features: Fuel tank (rented); Living/Dining room configuration; Crawl space basement
- Laundry & utility: Utility room on main level
Neighborhood map
What this means for you Summary
Snapshot
- This is a 2-bed/1.0-bath other listed at $95k.
Deal economics
- At list price, monthly cash flow is $201 ($2k/yr) — positive.
- The deal already cash-flows at list — no discount required.
- Meets the 1% rule at list price ($1k rent vs $95k).
- Recommended offer: $93k (1.5% below list) — sets the bar for market timing.
- Cap rate 8.8% vs local median 2.2% in Cass Lake — top-decile yield for the area; either an underpriced asset or a hidden risk that comps aren't pricing in. Stress-test before assuming the spread holds.
Location & tenants
- Location reads 71/100 on livability (#319 in MN) — a middle-class / working-renter tenant base. Strengths: employment A+, cost of living A+, health & safety A+; Watch: crime D, amenities F, commute F.
- Bemidji Public School District (rural): math 42% / reading 50% proficiency, ranked #173 of 301 in MN (top 58%) — families likely to look elsewhere, expect single-tenant / working-renter base with shorter leases.
- Zoned schools: Lincoln Elementary (math 67% / reading 62%, grade B, #130 of 857 statewide, top 18%, 328 students, 50% FRL); Bemidji Middle (math 37% / reading 46%, grade F, #138 of 258 statewide, top 55%, 1,013 students, 48% FRL); Bemidji Senior High (math 47% / reading 67%, grade C, #64 of 471 statewide, top 16%, 1,432 students, 38% FRL) — zoned schools at 45% FRL track the district average.
- Market conditions: 58 active listings in the ZIP; 165 units permitted in Beltrami County in 2024 (81 in 5+ unit buildings).
Forward outlook
- In year one you build about $7k of equity ($656 loan paydown + $7k appreciation (6.9% local appreciation)).
- At projected returns (6.9% appreciation + 3.0% rent growth), your $27k cash investment doubles in ~3 years — after that, you're playing with house money.
- By year 5, paydown + projected appreciation supports a ~$32k cash-out refi (75% LTV) — recoverable capital for the next deal without selling this one.
Negotiation context
- It's been on market 27 days — a 2% lower offer ($93k) is reasonable based on typical stale-listing flexibility.
- 4 sale attempts since 16y ago with the ask held roughly flat each time — persistent listings suggest the price (not the market) is what's stuck; bring a comps-based counter.
- Current owner paid $22k; list at $95k implies a 322% gain — meaningful room to come down on a strong offer.
Questions for the listing agent
- Is there a deadline driving the sale (1031 exchange, divorce, estate, relocation)? That informs how much negotiation room exists.
- Schools are F-rated, which usually means shorter tenancies and higher turnover. Who's the typical renter profile here, and what's been the actual vacancy rate?
- Crime grade is D in this area — have there been break-ins, vandalism, or insurance claims at this property in the last 3 years? What carrier currently insures it and at what premium?
- What's the average days-on-market for RENTAL listings here right now (not sales)? A rising rental-DOM trend means longer vacancies and softer asking-rent achievability than the comps imply.
- What's the recent tenant-quality profile in this submarket — average credit score on applications, eviction rate, late-payment / NSF rate, and stable-employment percentage? A property-management company in the area should have these aggregated.
- How much new for-sale + rental construction is in the pipeline within 1–3 miles? Heavy new supply typically softens prices + rents 12–24 months out; constrained supply supports both.
Investment metrics
- 1% rule
- 1.12% ✓
- Cap rate
- 8.83%
- Cash-on-cash
- 9.07%
- DSCR
- 1.40
- GRM
- 7.4
CMA / ARV
No comps found within radius.
Projected returns pro-forma
6.89% appreciation · 3.0% rent growth · sell at horizon
- IRR
- 24.7%
- Equity multiple
- 2.71×
- Total profit
- $45,311
- Equity at exit
- $65,101
- IRR
- 22.9%
- Equity multiple
- 5.60×
- Total profit
- $122,217
- Equity at exit
- $123,067
Cash invested: $26,572 (down + closing). Projections, not guarantees.
Landlord ↔ Tenant lean methodology
- Overall (STATE)
- 46 Balanced
- State Minnesota
- 46 Balanced · D+2
- County
- — inherits STATE
- City
- — inherits STATE
ZIP-level market 56633
- Home prices YoY
- 2.1%
- Active inventory
- 58
- Price-to-rent
- 7.4×
Monthly cashflow live
- Estimated rent
- $1,067 medium interval (Pro) →
- Mortgage (P&I)
- −$498
- Tax from tax record
- −$105 /mo · $1,258/yr
- Insurance
- −$40
- HOA
- −$0
- Lot rent
- −$0
- Vacancy / Maint / Mgmt
- −$224
- Net cashflow
- $201
Break-even live
Sensitivity live
| Price | -10% $254 | -5% $228 | +0% $201 | +5% $174 | +10% $147 |
|---|---|---|---|---|---|
| Rent | -10% $116 | -5% $159 | +0% $201 | +5% $243 | +10% $285 |
| Rate | -1.0pp $249 | -0.5pp $225 | base $201 | +0.5pp $176 | +1.0pp $151 |
UW: 25.0% down · 7.5% · 30yr · 1.5% tax · 5.0% vac · 8.0% maint · 8.0% mgmt
Financing live
Cash to close
- Down payment
- $23,725
- Closing costs
- $2,847
- Reserves months
- —
- Total cash needed
- —
Loan-product check · same deal, 3 products live
Conventional
25% down · 7.5% · 30yr
- Down + closing
- —
- Monthly P&I
- —
- Monthly cashflow
- —
- DSCR
- —
- Eligible?
- —
Personal DTI + credit; lowest rate.
DSCR
20% down · 8.5% · 30yr
- Down + closing
- —
- Monthly P&I
- —
- Monthly cashflow
- —
- DSCR
- —
- Eligible?
- —
No personal income docs; deal must DSCR.
Hard money
10% down · 12.0% · 12mo
- Down + closing
- —
- Monthly P&I
- —
- Monthly cashflow
- —
- DSCR
- —
- Eligible?
- —
Short-term bridge; refi at stabilization.
Listing history 23 events
-
2026-06-22days on market $94,900 Active 27 DOM
-
2026-06-21days on market $94,900 Active 26 DOM
-
2026-06-19days on market $94,900 Active 24 DOM
-
2026-06-18days on market $94,900 Active 23 DOM
-
2026-06-17days on market $94,900 Active 22 DOM
-
2026-06-16days on market $94,900 Active 21 DOM
-
2026-06-15days on market $94,900 Active 20 DOM
-
2026-06-14days on market $94,900 Active 18 DOM
-
2026-06-12days on market $94,900 Active 17 DOM
-
2026-06-09days on market $94,900 Active 14 DOM
-
2026-06-08days on market $94,900 Active 13 DOM
-
2026-06-07days on market $94,900 Active 12 DOM
-
2026-06-05days on market $94,900 Active 9 DOM
-
2026-06-02days on market $94,900 Active 7 DOM
-
2026-06-01days on market $94,900 Active 6 DOM
-
2026-05-31days on market $94,900 Active 5 DOM
-
2026-05-30days on market $94,900 Active 4 DOM
-
2026-05-26$94,900 Active
-
2011-03-03historical
-
2011-02-28soldstatus $22,500 114-char remark
Show marketing remark (114 chars)
Two bedroom home with double attached garage on 10 beautiful wooded acres. AS-IS. Old moble home also on property.
-
2010-11-16$33,900
-
2010-09-17$33,900 114-char remark
Show marketing remark (114 chars)
Two bedroom home with double attached garage on 10 beautiful wooded acres. AS-IS. Old moble home also on property.
-
2010-09-17$33,900
Show marketing remark (114 chars)
Two bedroom home with double attached garage on 10 beautiful wooded acres. AS-IS. Old moble home also on property.
ⓘ Source: listings_history table (triggers on properties + properties_extension) + one-shot
backfill from property_details.listing_events for pre-trigger history.
Tax reassessment forecast MN · Partial reset (capped growth)
- Current annual tax
- $1,258 · $105/mo
- Projected year-2 tax
- $1,258 · $105/mo
- Expected delta
- $0/yr ($0/mo · 0.0%)
ⓘ Screening estimate from a state-policy table — verify with the county assessor before closing.
Climate risk First Street
- Flood 4/10 Moderate 20% chance over 30 yrs
- Wildfire 4/10 Moderate
- Heat 1/10 Low 7 d/yr ≥93°F today · 12 d/yr by 30 yrs out
- Wind 1/10 Low
- Air quality 4/10 Moderate 4 unhealthy d/yr today · 5 by 30 yrs out
Nearby sold comps map
Loading sold comps map…
Walkable amenities ~0.75 mi
Loading nearby amenities…
Taxation est. · year 1
- Rental income
- $12,802
- − Mortgage interest
- −$5,316
- − Property taxes
- −$1,258
- − Insurance
- −$474
- − Repairs & maintenance
- −$1,024
- − Management
- −$1,024
- − Depreciation
- −$2,761
- Taxable income
- $945
- Est. tax owed @ 24.0%
- −$227
- After-tax cash flow
- $2,183/yr
For passive investors: Depreciation is non-cash, so a rental often shows a tax loss while cash-flowing — sheltering income. Rental losses are passive: they offset passive income freely, and up to $25,000/yr can offset ordinary (W-2) income if you actively participate and your MAGI is under $100k (phasing out to $0 by $150k); unused losses carry forward. On sale, claimed depreciation is recaptured at up to 25%, and gains may owe capital-gains tax (a 1031 exchange can defer both). Figures are a year-1 estimate at your 24.0% rate — not tax advice; consult a CPA.
Schools (NCES district)
- District
- Bemidji Public School District
- NCES district ID
- 2704440
- Math proficiency
- 42% ▼ -9.00%
- Reading proficiency
- 50% ▼ -5.00%
- Median HH income
- $47,735
- Composite
- 39.22/100
- National rank
- #4013
- State rank
- #173 of 301 in MN
Livability — Cass Lake
- Score
- 71/100
- State rank
- #319
- US rank
- #7129
Category grades
Schools grade is shown separately in the Schools card above.
Census & demographics
- Population (ZIP)
- 4,863
Population outlook (Beltrami County) Hauer SSP2
- Today (2025)
- 46,437 people
- By 2030
- 46,736 · +0.6%
- By 2040
- 46,804 · +0.8%
- By 2050
- 46,299 · -0.3%
- By 2075
- 44,037 · -5.2%
- By 2100
- 38,567 · -16.9%
Race, ethnicity, and origin ACS 2023
- Neighborhood character
- Highly diverse neighborhood (Simpson 0.90)
- Race & ethnicity
- Native American 51% White 32% Two or more races 12% Hispanic / Latino 4% Asian 1%
- Common ancestry
- Portuguese 7% Lithuanian 2% Italian 1%
- Foreign-born
- 2% · Canada
- Languages at home
- 88% English-only · Other Asian/Pacific 1%
Political lean MEDSL · Beltrami
- 2024 margin
- Lean R (+5.7) · D 46.3% · R 52.0% · Other 1.7%
- 2008→2024 swing
- -15.8pp toward R · 2008: 10.2pp · 2024: -5.7pp
- All cycles
- 2024: R+5.7 2020: R+3.1 2016: R+9.8 2012: D+9.9 2008: D+10.2
Not yet ingested
- Civics
- —
Market trends
- HPI YoY
- ▲ 6.89%
- Current HPI
- 340.4577
- Rent YoY
- —
- Metro
- —
- State GDP YoY
- ▲ 2.41%
- F500 in state
- 34
Industry mix (Fortune 500 HQ in MN)
| Industry | F500 HQs | Revenue |
|---|---|---|
| Healthcare | 2 | $407B |
|
||
| Retail | 2 | $150B |
|
||
| Consumer Goods | 2 | $32B |
|
||
| Industrial Machinery | 2 | $6B |
|
||
| Agriculture | 1 | $40B |
|
||
| Healthcare / Medical Devices | 1 | $32B |
|
||
Price history
+179.9% since first listed6 events — show timeline
- 2026-05-26 Listed $94,900 NORTHSTARMLS as Distributed by MLS Grid
- 2011-03-03 Listing Removed — NORTHSTARMLS as Distributed by MLS Grid
- 2011-02-28 Sold (MLS) $22,500 NORTHSTARMLS as Distributed by MLS Grid
- 2010-11-16 Listed $33,900 NORTHSTARMLS as Distributed by MLS Grid
- 2010-09-17 Listed $33,900 NORTHSTARMLS as Distributed by MLS Grid
- 2010-09-17 Listed $33,900 NORTHSTARMLS as Distributed by MLS Grid
Property tax history
+6.2%/yrLatest (2025): $1,258 · +18.5% YoY. Source: county tax records.
Cash-flow waterfall
monthlySold comps — $/sqft
last 12 mo · ≤1 miLoading sold comps…