405 E Wilson St · Villa Rica, GA
Flood risk 1/10 · Minimal
- FEMA flood zone
- X (unshaded)
- Chance of flooding over 30 yrs
- 0.0%
- Est. flood insurance / yr
- $507 – $1,088
Fire risk 3/10 · Minor
- Est. fire insurance / yr
- $963 – $1,789
Heat risk 5/10 · Moderate
- Hot days now (above 103°F)
- 7 days/yr
- Hot days in 30 yrs
- 19 days/yr
Wind risk 5/10 · Moderate
- Chance of severe wind over 30 yrs
- 25.0%
Air-quality risk 3/10 · Minor
- Unhealthy air days now
- 4 days/yr
- Unhealthy air days in 30 yrs
- 4 days/yr
Risk factors via First Street. Map © Google.
Why this score? — see what drove the C- grade
The composite is a weighted blend of 9 inputs, each scored 0–100. Each bar is that input's sub-score; the figure is the points it added to the 100-point composite (weight × sub-score).
- Cash flow +15.5/30.0
- ARV discount +15.0/15.0
- DSCR +4.8/10.0
- Schools +3.6/10.0
- Livability +3.2/5.0
- Rent growth +3.1/5.0
- 1% rule +2.9/10.0
- Condition / age +2.5/5.0
- Appreciation +0.0/10.0
$259,900
🖨 Deal sheet (PDF) 📄 Offer letter ✓ Due diligence
Listing remarks MLS
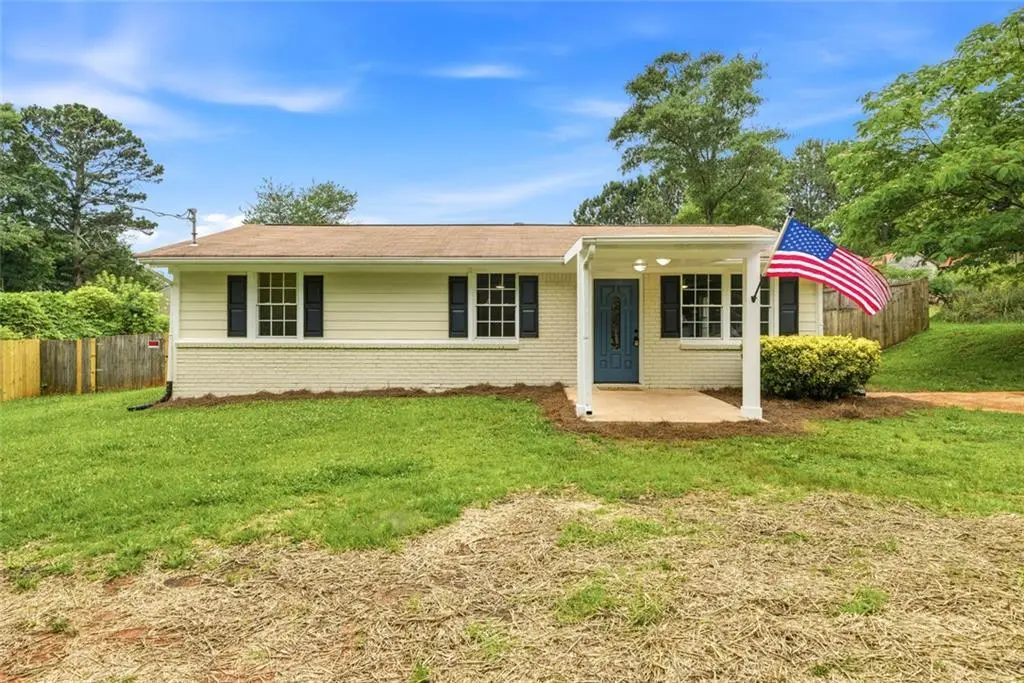
Spacious Ranch Just Steps from Downtown Villa Rica! Come home to over 2000 sq ft of thoughtful living in this spacious ranch, ideally located within walking distance of The Mill Amphitheater and the charming shops and dining of historic downtown Villa Rica. The open concept kitchen sits at the heart of the home, connecting two large living areas along with four spacious bedrooms and bathrooms. This flexible roommate layout easily accommodates multi-generational living or guests. Outside, spend summer nights on the massive covered back porch overlooking your flat, private, fenced backyard. Location, space, and comfort, this home has it all.
Key facts
- Open concept kitchen
- 0.46 acre lot
- Parking
Tags
Property features AI
Exterior
- Parking: Driveway parking; Open parking (1 total space)
- Utilities: Public water; Public sewer; Electricity available; Sewer available; Water available
- Home design: Single-level home
- Construction: Composition roof; Slab foundation; Other construction materials; Updated/remodeled property condition
- Exterior features: Deck; Back yard fencing (fenced)
Interior
- Kitchen: Kitchen island; Refrigerator; Dishwasher
- Bedrooms: Four main-level bedrooms; Roommate floor plan
- Flooring: Tile flooring; Laminate flooring
- Bathrooms: Four full bathrooms (all on the main level); Master bath with other/custom features
- Heating & cooling: Central heating; Central air conditioning
- Interior features: One fireplace; Updated/remodeled interior; No shared/common walls; Other interior features
- Laundry & utility: Laundry room; Common area laundry
Neighborhood map
What this means for you Summary
Snapshot
- This is a 4-bed/4.0-bath single-family listed at $260k.
Deal economics
- At list price, monthly cash flow is $105 ($1k/yr) — positive.
- The deal already cash-flows at list — no discount required.
- To meet the 1% rule (rent ≥ 1% of price), the offer needs to be $207k (20.5% below list).
- Recommended offer: $207k (20.5% below list) — sets the bar for 1% rule.
- Cap rate 6.8% vs local median 4.0% in Villa Rica — top-decile yield for the area; either an underpriced asset or a hidden risk that comps aren't pricing in. Stress-test before assuming the spread holds.
Location & tenants
- Location reads 65/100 on livability (#224 in GA) — a middle-class / working-renter tenant base. Strengths: cost of living A+, housing A+, employment B; Watch: amenities F, commute F, health & safety F.
- Carroll County (rural): math 42% / reading 41% proficiency, ranked #38 of 174 in GA (top 22%) — families likely to look elsewhere, expect single-tenant / working-renter base with shorter leases.
- Zoned schools: Villa Rica Elementary School (math 42% / reading 32%, grade F, #485 of 1,228 statewide, top 41%, 432 students, 69% FRL); Villa Rica Middle (math 25% / reading 32%, grade F, #260 of 470 statewide, top 56%, 464 students, 70% FRL); Villa Rica High School (math 16% / reading 34%, grade F, #181 of 424 statewide, top 43%, 1,807 students, 56% FRL).
- Market conditions: Rents rising (+2.4%/yr); 669 active listings in the ZIP; 9 comparable units currently listed for rent nearby; rentals at typical pace (median 26d on market — plan ~3-4 weeks tenant-placement turnaround); 44% of comp listings sitting > 30 days — soft ceiling on asking rent; solid renter incomes; 876 units permitted in Carroll County in 2024 (150 in 5+ unit buildings).
Forward outlook
- Local home prices are declining (-3.0%/yr); year-one equity from $2k of loan paydown is wiped out by about $8k of value loss. Plan a longer hold.
- Carroll County population projected at +12% by 2050 — modest demand growth; plan on rents tracking national, not racing it.
Negotiation context
- It's been on market 19 days — a 2% lower offer ($256k) is reasonable based on typical stale-listing flexibility.
- 8 sale attempts since 12y ago with the ask held roughly flat each time — persistent listings suggest the price (not the market) is what's stuck; bring a comps-based counter.
- Current owner paid $36k; list at $260k implies a 632% gain — meaningful room to come down on a strong offer.
Risks & watch-outs
- Climate carrying-cost: moderate wind risk, 25% chance of damaging wind over 30y; extreme-heat days projected 7→19/yr by 2055 (HVAC capex compounding) — expect insurance premiums to compound above CPI over the hold.
Questions for the listing agent
- Built in 1979 — when were the roof, HVAC, electrical panel, plumbing, and water heater last replaced?
- Is there a deadline driving the sale (1031 exchange, divorce, estate, relocation)? That informs how much negotiation room exists.
- What's the average days-on-market for RENTAL listings here right now (not sales)? A rising rental-DOM trend means longer vacancies and softer asking-rent achievability than the comps imply.
- What's the recent tenant-quality profile in this submarket — average credit score on applications, eviction rate, late-payment / NSF rate, and stable-employment percentage? A property-management company in the area should have these aggregated.
- How much new for-sale + rental construction is in the pipeline within 1–3 miles? Heavy new supply typically softens prices + rents 12–24 months out; constrained supply supports both.
Investment metrics
- 1% rule
- 0.79% ✗
- Cap rate
- 6.78%
- Cash-on-cash
- 1.73%
- DSCR
- 1.08
- GRM
- 10.5
CMA / ARV
- ARV (on-the-fly)
- $360,472
- Comps found
- 12
Show comp detail 12 sales within ~0.75 mi
| Address | Dist | Beds/Ba | Sqft | Sold | Price | $/sf | Match |
|---|---|---|---|---|---|---|---|
| 25 Sixth St | 0.30mi | 4/2.5 | 2,272 (-1%) | 17mo | $120,000 | $53 | 64 |
| 704 Anchor Ave | 0.53mi | 4/2.0 | 2,250 (-2%) | 4mo | $434,990 | $193 | 60 |
| 44 Maple Valley Dr | 0.41mi | 4/3.5 | 2,372 (+3%) | 21mo | $650,000 | $274 | 56 |
| 313 Canoe Pl | 0.47mi | 3/3.0 (-1) | 2,385 (+4%) | 10mo | $522,362 | $219 | 54 |
| 315 Canoe Pl | 0.46mi | 3/3.0 (-1) | 2,371 (+3%) | 15mo | $551,319 | $233 | 52 |
| 232 S Candler St | 0.43mi | 3/2.0 (-1) | 2,050 (-11%) | 4mo | $215,000 | $105 | 46 |
| 101 Azalea Dr | 0.62mi | 4/2.5 | 2,178 (-5%) | 13mo | $341,000 | $157 | 46 |
| 100 Azalea Dr | 0.63mi | 3/2.5 (-1) | 2,111 (-8%) | 1mo | $295,000 | $140 | 45 |
| 919 Sundown Pt | 0.53mi | 4/2.5 | 2,618 (+14%) | 1mo | $399,990 | $153 | 45 |
| 906 Sundown Pt | 0.53mi | 4/2.5 | 2,618 (+14%) | 4mo | $399,990 | $153 | 42 |
| 408 Chastain Ct | 0.68mi | 3/2.0 (-1) | 2,180 (-5%) | 6mo | $335,000 | $154 | 42 |
| 30 Daisy Ln | 0.73mi | 4/2.5 | 2,157 (-6%) | 18mo | $380,000 | $176 | 34 |
Match score weights: distance 35% · size 25% · config 20% · recency 20%. Top-matched comps best support the ARV.
Projected returns pro-forma
-3.0% appreciation · 2.42% rent growth · sell at horizon
- IRR
- -14.2%
- Equity multiple
- 0.49×
- Total profit
- $-36,763
- Equity at exit
- $38,752
- IRR
- -6.3%
- Equity multiple
- 0.60×
- Total profit
- $-28,811
- Equity at exit
- $22,471
Cash invested: $72,772 (down + closing). Projections, not guarantees.
Landlord ↔ Tenant lean methodology
- Overall (STATE)
- 90 Strongly Landlord-Friendly
- State Georgia
- 90 Strongly Landlord-Friendly · R+3
- County
- — inherits STATE
- City
- — inherits STATE
ZIP-level market 30180
- Home prices YoY
- -12.8%
- Rents YoY
- 2.4%
- Active inventory
- 669
- Price-to-rent
- 10.5×
Monthly cashflow live
- Estimated rent
- $2,066 high interval (Pro) →
- Mortgage (P&I)
- −$1,363
- Tax from tax record
- −$56 /mo · $670/yr
- Insurance
- −$108
- HOA
- −$0
- Vacancy / Maint / Mgmt
- −$434
- Net cashflow
- $105
Break-even live
Sensitivity live
| Price | -10% $252 | -5% $179 | +0% $105 | +5% $31 | +10% $-42 |
|---|---|---|---|---|---|
| Rent | -10% $-58 | -5% $23 | +0% $105 | +5% $187 | +10% $268 |
| Rate | -1.0pp $236 | -0.5pp $171 | base $105 | +0.5pp $38 | +1.0pp $-31 |
UW: 25.0% down · 7.5% · 30yr · 1.5% tax · 5.0% vac · 8.0% maint · 8.0% mgmt
Financing live
Cash to close
- Down payment
- $64,975
- Closing costs
- $7,797
- Reserves months
- —
- Total cash needed
- —
Loan-product check · same deal, 3 products live
Conventional
25% down · 7.5% · 30yr
- Down + closing
- —
- Monthly P&I
- —
- Monthly cashflow
- —
- DSCR
- —
- Eligible?
- —
Personal DTI + credit; lowest rate.
DSCR
20% down · 8.5% · 30yr
- Down + closing
- —
- Monthly P&I
- —
- Monthly cashflow
- —
- DSCR
- —
- Eligible?
- —
No personal income docs; deal must DSCR.
Hard money
10% down · 12.0% · 12mo
- Down + closing
- —
- Monthly P&I
- —
- Monthly cashflow
- —
- DSCR
- —
- Eligible?
- —
Short-term bridge; refi at stabilization.
Rent comps 9 comps
| Address | Beds | Baths | Sqft | Rent | $/sqft | DOM | Units | Dist |
|---|---|---|---|---|---|---|---|---|
| 170 Alton Cir Villa Rica, GA | 3.0 | 2.5 | 1796 | $1,820 | $1.01 | 13d | 1 | 0.07mi |
| 221 Alton Cir Villa Rica, GA | 3.0 | 2.0 | 1586 | $1,525 | $0.96 | 7d | 1 | 0.08mi |
| 408 Erin Ct Villa Rica, GA | 3.0 | 2.5 | 1772 | $1,495 | $0.84 | 45d | 1 | 0.24mi |
| 106 Maple St Villa Rica, GA | 3.0 | 2.0 | 1585 | $1,700 | $1.07 | 26d | 1 | 0.66mi |
| 334 Augusta Woods Dr Villa Rica, GA | 4.0 | 2.5 | 2410 | $2,085 | $0.87 | 45d | 1 | 1.17mi |
| 347 Augusta Woods Dr Villa Rica, GA | 3.0 | 2.5 | 1800 | $1,845 | $1.02 | 45d | 1 | 1.22mi |
| 323 Oakhaven Way Villa Rica, GA | 5.0 | 3.0 | 2443 | $2,330 | $0.95 | 13d | 1 | 1.24mi |
| 313 Kenmore Ct Villa Rica, GA | 4.0 | 2.5 | 2313 | $2,145 | $0.93 | 14d | 1 | 1.39mi |
| 115 Old Stone Rd Villa Rica, GA | 3.0 | 2.0 | 1767 | $1,800 | $1.02 | 45d | 1 | 1.39mi |
Listing history 14 events
-
2026-06-18statusdays on market $259,900 Under Contract 19 DOM
-
2026-06-18days on market $259,900 Active 20 DOM
-
2026-06-17days on market $259,900 Active 19 DOM
-
2026-06-16days on market $259,900 Active 18 DOM
-
2026-06-15days on market $259,900 Active 17 DOM
-
2026-06-13days on market $259,900 Active 15 DOM
-
2026-06-09days on market $259,900 Active 11 DOM
-
2026-06-08days on market $259,900 Active 10 DOM
-
2026-06-07days on market $259,900 Active 9 DOM
-
2026-06-04days on market $259,900 Active 6 DOM
-
2026-06-03days on market $259,900 Active 5 DOM
-
2026-06-02days on market $259,900 Active 4 DOM
-
2026-06-01days on market $259,900 Active 3 DOM
-
2026-05-31days on market $259,900 Active 2 DOM
ⓘ Source: listings_history table (triggers on properties + properties_extension) + one-shot
backfill from property_details.listing_events for pre-trigger history.
Tax reassessment forecast GA · Resets to sale price
- Current annual tax
- $670 · $56/mo
- Projected year-2 tax
- $2,391 · $199/mo
- Expected delta
- +$1,721/yr (+$143/mo · 256.7%)
ⓘ Screening estimate from a state-policy table — verify with the county assessor before closing.
Climate risk First Street
- Flood 1/10 Low FEMA zone X (unshaded) · 0% chance over 30 yrs
- Wildfire 3/10 Moderate
- Heat 5/10 Major 7 d/yr ≥103°F today · 19 d/yr by 30 yrs out
- Wind 5/10 Major 25% chance of damaging wind over 30 yrs
- Air quality 3/10 Moderate 4 unhealthy d/yr today · 4 by 30 yrs out
Nearby sold comps map
Loading sold comps map…
Walkable amenities ~0.75 mi
Loading nearby amenities…
Taxation est. · year 1
- Rental income
- $24,791
- − Mortgage interest
- −$14,558
- − Property taxes
- −$670
- − Insurance
- −$1,300
- − Repairs & maintenance
- −$1,983
- − Management
- −$1,983
- − Depreciation
- −$7,561
- Taxable loss
- −$3,265
- Est. tax savings @ 24.0%
- +$784
- After-tax cash flow
- $2,043/yr
For passive investors: Depreciation is non-cash, so a rental often shows a tax loss while cash-flowing — sheltering income. Rental losses are passive: they offset passive income freely, and up to $25,000/yr can offset ordinary (W-2) income if you actively participate and your MAGI is under $100k (phasing out to $0 by $150k); unused losses carry forward. On sale, claimed depreciation is recaptured at up to 25%, and gains may owe capital-gains tax (a 1031 exchange can defer both). Figures are a year-1 estimate at your 24.0% rate — not tax advice; consult a CPA.
Schools (NCES district)
- District
- Carroll County
- NCES district ID
- 1300840
- Math proficiency
- 42% ▼ -7.00%
- Reading proficiency
- 41% ▼ -8.00%
- Median HH income
- $48,692
- Composite
- 35.62/100
- National rank
- #4888
- State rank
- #38 of 174 in GA
Livability — Villa Rica
- Score
- 65/100
- State rank
- #224
- US rank
- #13182
Category grades
Schools grade is shown separately in the Schools card above.
Census & demographics
- Census place
- Villa Rica, GA
- County
- Carroll County · 124,888 people
- City population
- 43,013
- Metro
- Atlanta-Sandy Springs-Alpharetta, GA
- Population (ZIP)
- 43,013
- Household income
- $88,514
- Rent vs Own
- Severe rent burden
- 853.0
Population outlook (Carroll County) Hauer SSP2
- Today (2025)
- 123,370 people
- By 2030
- 127,186 · +3.1%
- By 2040
- 133,534 · +8.2%
- By 2050
- 137,612 · +11.5%
- By 2075
- 142,892 · +15.8%
- By 2100
- 136,294 · +10.5%
Race, ethnicity, and origin ACS 2023
- Neighborhood character
- Diverse neighborhood (Simpson 0.59)
- Race & ethnicity
- White 57% Black 29% Hispanic / Latino 7% Two or more races 7% Asian 2%
- Hispanic origin (detail)
- Mexican 5% Puerto Rican 1%
- Common ancestry
- German 1% Slovak 1% Italian 1%
- Foreign-born
- 8% · Canada
- Languages at home
- 92% English-only · Spanish 5% Other Indo-European 2% French/Haitian/Cajun 1%
Political lean MEDSL · Carroll
- 2024 margin
- Solid R (+41.2) · D 29.1% · R 70.3%
- 2008→2024 swing
- -8.2pp toward R · 2008: -32.9pp · 2024: -41.2pp
- All cycles
- 2024: R+41.2 2020: R+39.0 2016: R+40.1 2012: R+37.7 2008: R+32.9
Not yet ingested
- Civics
- —
Market trends
- HPI YoY
- ▼ -46.97%
- Current HPI
- 321.1874
- Rent YoY
- ▲ 2.42%
- Metro
- Atlanta-Sandy Springs-Alpharetta, GA
- State GDP YoY
- ▲ 2.66%
- F500 in state
- 28
Industry mix (Fortune 500 HQ in GA)
| Industry | F500 HQs | Revenue |
|---|---|---|
| Paper / Packaging | 2 | $29B |
|
||
| Retail | 1 | $160B |
|
||
| Transportation / Logistics | 1 | $91B |
|
||
| Airlines | 1 | $62B |
|
||
| Consumer Goods | 1 | $47B |
|
||
| Utilities | 1 | $25B |
|
||
Price history
+404.7% since first listed24 events — show timeline
- 2026-05-29 Listed $259,900 FMLS
- 2026-05-29 Listed $259,900 GAMLS
- 2024-12-16 Listing Removed — GAMLS
- 2024-11-12 Listing Removed — GAMLS
- 2024-10-12 Price Changed $285,100 GAMLS
- 2024-10-12 Relisted — GAMLS
- 2024-10-11 Listing Removed — GAMLS
- 2024-10-06 Relisted — GAMLS
- 2024-10-05 Listing Removed — GAMLS
- 2024-10-02 Price Changed $309,500 GAMLS
- 2024-09-20 Listed $325,000 GAMLS
- 2024-09-20 Listed $285,100 GAMLS
- 2016-02-10 Price Changed $35,500 FMLS
- 2015-06-04 Price Changed $35,501 FMLS
- 2014-04-12 Price Changed $35,500 GAMLS
- 2014-03-28 Listing Removed — FMLS
- 2014-03-25 Sold (MLS) $35,501 GAMLS
- 2014-03-25 Sold (MLS) $35,501 FMLS
- 2014-02-04 Pending — GAMLS
- 2014-02-04 Pending — FMLS
- 2014-02-04 Price Changed $35,501 GAMLS
- 2014-01-04 Listed $35,500 GAMLS
- 2014-01-03 Listed $35,500 FMLS
- 2006-07-07 Sold (Public Records) $51,500 Public Records
Property tax history
+1.3%/yrLatest (2025): $670 · -0.1% YoY. Source: county tax records.
Cash-flow waterfall
monthlySold comps — $/sqft
last 12 mo · ≤1 miLoading sold comps…