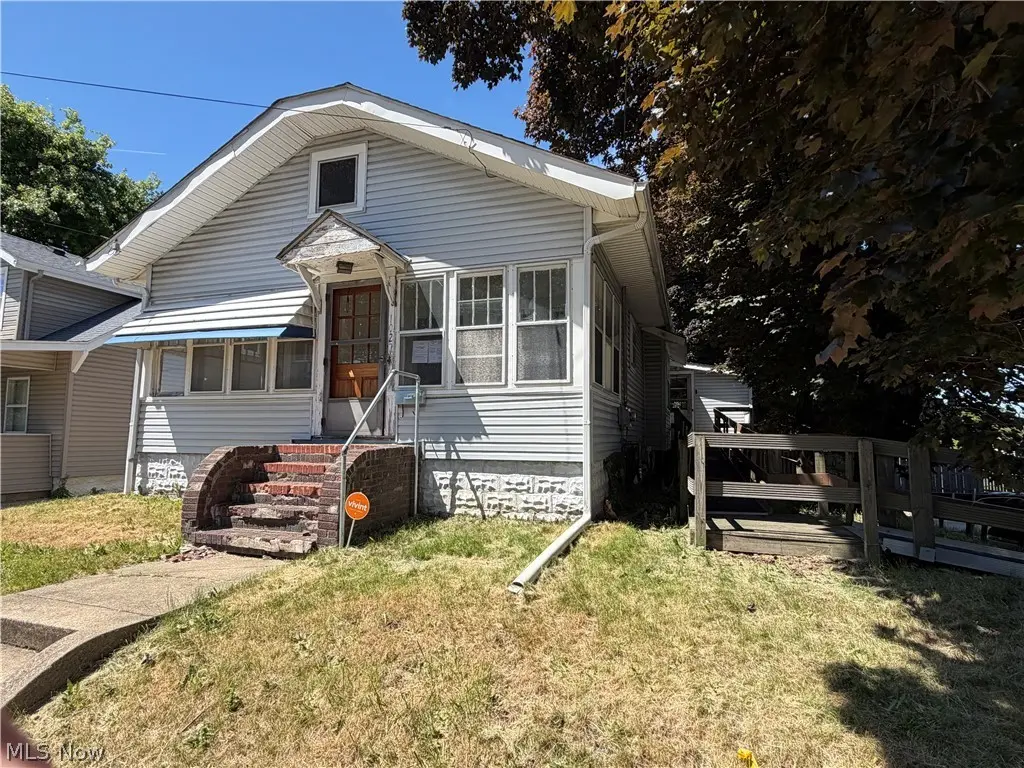
1027 Austin Ave · Akron, OH
Flood risk 1/10 · Minimal
- FEMA flood zone
- X (unshaded)
- Chance of flooding over 30 yrs
- 0.0%
- Est. flood insurance / yr
- $473 – $860
Fire risk 1/10 · Minimal
- Est. fire insurance / yr
- $713 – $1,323
Heat risk 3/10 · Minor
- Hot days now (above 96°F)
- 7 days/yr
- Hot days in 30 yrs
- 17 days/yr
Wind risk 1/10 · Minimal
- Chance of severe wind over 30 yrs
- —
Air-quality risk 2/10 · Minimal
- Unhealthy air days now
- 1 days/yr
- Unhealthy air days in 30 yrs
- 2 days/yr
Risk factors via First Street. Map © Google.
Why this score? — see what drove the B grade
The composite is a weighted blend of 9 inputs, each scored 0–100. Each bar is that input's sub-score; the figure is the points it added to the 100-point composite (weight × sub-score).
- Cash flow +30.0/30.0
- 1% rule +10.0/10.0
- DSCR +10.0/10.0
- ARV discount +7.5/15.0
- Rent growth +4.4/5.0
- Livability +4.0/5.0
- Condition / age +2.5/5.0
- Schools +2.1/10.0
- Appreciation +0.0/10.0
$49,900
🖨 Deal sheet (PDF) 📄 Offer letter ✓ Due diligence
Listing remarks
Opportunity awaits in this 2-bedroom, 1-bath ranch situated on a manageable lot. The home offers a functional layout and appears to have solid structural integrity, providing a strong foundation for your vision. Extensive updates and improvements are needed throughout, making this an ideal project for investors, renovators, or buyers looking to build equity. Property is being sold as-is. Bring your ideas and restore this home to its full potential.
Key facts
- 6,155 sq ft lot
- Garage
- Built 1927
Property features AI
Exterior
- Parking: Attached garage (1 car); Basement access to garage; Built-in garage
- Utilities: Public water; Public sewer
- Home design: Single-story home; Property listed as fixer condition; Above-grade finished area approximately 980
- Construction: Vinyl siding; Asphalt/fiberglass shingle pitched roof
- Exterior features: Public water and public sewer
Interior
- Bedrooms: Two main-level bedrooms
- Bathrooms: One full bathroom on the main level
- Heating & cooling: Forced-air gas heating
- Interior features: Full, unfinished basement with walk-out access; Total of 5 rooms
Neighborhood map
What this means for you Summary
Snapshot
- This is a 2-bed/1.0-bath single-family listed at $50k.
Deal economics
- At list price, monthly cash flow is $446 ($5k/yr) — positive.
- The deal already cash-flows at list — no discount required.
- Meets the 1% rule at list price ($1k rent vs $50k).
- Cap rate 17.0% vs local median 6.6% in Akron — top-decile yield for the area; either an underpriced asset or a hidden risk that comps aren't pricing in. Stress-test before assuming the spread holds.
Location & tenants
- Location reads 81/100 on livability (#104 in OH, #1,591 nationally) — a professional / high-income tenant draw. Strengths: amenities A+, commute A+, cost of living A+; Watch: crime F, employment F.
- Akron City (urban): math 22% / reading 30% proficiency, ranked #602 of 656 in OH (top 92%) — low school quality limits family demand, transient renter base, plan for 1-2y turnover; 66% free/reduced lunch — lower-income household profile, screen leases tightly.
- Market conditions: Rents rising fast (+7.6%/yr); 69 active listings in the ZIP; 40 comparable units currently listed for rent nearby; rentals lingering (median 45d on market — plan ~5-8 weeks vacancy on turnover, expect pricing pressure); 55% of comp listings sitting > 30 days — soft ceiling on asking rent; lower-income renter base — watch delinquency; 1,114 units permitted in Summit County in 2024 (397 in 5+ unit buildings).
Forward outlook
- Local home prices are declining (-3.0%/yr); year-one equity from $345 of loan paydown is wiped out by about $1k of value loss. Plan a longer hold.
- Summit County population projected to shrink 6% by 2050 — rents likely to lag national; underwrite the cash flow, not the appreciation.
- At projected returns (-3.0% appreciation + 7.6% rent growth), your $14k cash investment doubles in ~3 years — after that, you're playing with house money.
Negotiation context
- Only 13 days on market — expect competitive offers; lowballing is unlikely to land.
- 3 sale attempts since 32y ago with the ask held roughly flat each time — persistent listings suggest the price (not the market) is what's stuck; bring a comps-based counter.
- Current owner paid $26k; list at $50k implies a 92% gain — meaningful room to come down on a strong offer.
Risks & watch-outs
- Watch-outs: built in 1927 — expect roof / HVAC / electrical / plumbing capex.
Questions for the listing agent
- Built in 1927 — when were the roof, HVAC, electrical panel, plumbing, and water heater last replaced?
- Is there a deadline driving the sale (1031 exchange, divorce, estate, relocation)? That informs how much negotiation room exists.
- Crime grade is F in this area — have there been break-ins, vandalism, or insurance claims at this property in the last 3 years? What carrier currently insures it and at what premium?
- What's the average days-on-market for RENTAL listings here right now (not sales)? A rising rental-DOM trend means longer vacancies and softer asking-rent achievability than the comps imply.
- What's the recent tenant-quality profile in this submarket — average credit score on applications, eviction rate, late-payment / NSF rate, and stable-employment percentage? A property-management company in the area should have these aggregated.
- How much new for-sale + rental construction is in the pipeline within 1–3 miles? Heavy new supply typically softens prices + rents 12–24 months out; constrained supply supports both.
Investment metrics
- 1% rule
- 2.01% ✓
- Cap rate
- 17.01%
- Cash-on-cash
- 38.27%
- DSCR
- 2.70
- GRM
- 4.2
CMA / ARV
- ARV (on-the-fly)
- $110,740
- Comps found
- 12
Show comp detail 12 sales within ~0.75 mi
| Address | Dist | Beds/Ba | Sqft | Sold | Price | $/sf | Match |
|---|---|---|---|---|---|---|---|
| 920 Clement St | 0.11mi | 2/1.0 | 940 (-4%) | 2mo | $95,000 | $101 | 86 |
| 985 Clement St | 0.19mi | 3/1.0 (+1) | 988 (+1%) | 4mo | $120,000 | $121 | 81 |
| 766 Staeger St | 0.31mi | 3/1.0 (+1) | 960 (-2%) | 4mo | $100,900 | $105 | 74 |
| 1078 Lindsay Ave | 0.28mi | 3/1.5 (+1) | 1,005 (+3%) | 3mo | $107,150 | $107 | 73 |
| 982 Merton Ave | 0.59mi | 2/1.0 | 984 (+0%) | 2mo | $106,000 | $108 | 70 |
| 529 Anderson Ave | 0.57mi | 3/1.0 (+1) | 960 (-2%) | 2mo | $156,500 | $163 | 63 |
| 540 Anderson Ave | 0.54mi | 2/1.5 | 928 (-5%) | 3mo | $125,000 | $135 | 62 |
| 870 E Archwood Ave | 0.31mi | 3/1.0 (+1) | 1,088 (+11%) | 2mo | $123,000 | $113 | 61 |
| 871 N Firestone Blvd | 0.29mi | 3/1.0 (+1) | 1,107 (+13%) | 1mo | $74,000 | $67 | 59 |
| 801 Triplett Blvd | 0.51mi | 3/1.0 (+1) | 1,040 (+6%) | 3mo | $165,000 | $159 | 59 |
| 627 Arden Pl | 0.53mi | 2/1.0 | 840 (-14%) | 1mo | $99,000 | $118 | 50 |
| 1216 Bittaker St | 0.70mi | 3/2.0 (+1) | 1,090 (+11%) | 4mo | $95,000 | $87 | 36 |
Match score weights: distance 35% · size 25% · config 20% · recency 20%. Top-matched comps best support the ARV.
Projected returns pro-forma
-3.0% appreciation · 7.63% rent growth · sell at horizon
- IRR
- 39.5%
- Equity multiple
- 2.80×
- Total profit
- $25,188
- Equity at exit
- $7,440
- IRR
- 48.1%
- Equity multiple
- 6.77×
- Total profit
- $80,570
- Equity at exit
- $4,314
Cash invested: $13,972 (down + closing). Projections, not guarantees.
Landlord ↔ Tenant lean methodology
- Overall (STATE)
- 73 Landlord-Friendly
- State Ohio
- 73 Landlord-Friendly · R+6
- County
- — inherits STATE
- City
- — inherits STATE
ZIP-level market 44306
- Rents YoY
- 7.6%
- Active inventory
- 69
- Price-to-rent
- 4.2×
Monthly cashflow live
- Estimated rent
- $1,001 high interval (Pro) →
- Mortgage (P&I)
- −$262
- Tax est. 1.5%
- −$62 /mo · $748/yr
- Insurance
- −$21
- HOA
- −$0
- Vacancy / Maint / Mgmt
- −$210
- Net cashflow
- $446
Break-even live
Sensitivity live
| Price | -10% $480 | -5% $463 | +0% $446 | +5% $428 | +10% $411 |
|---|---|---|---|---|---|
| Rent | -10% $367 | -5% $406 | +0% $446 | +5% $485 | +10% $525 |
| Rate | -1.0pp $471 | -0.5pp $458 | base $446 | +0.5pp $433 | +1.0pp $420 |
UW: 25.0% down · 7.5% · 30yr · 1.5% tax · 5.0% vac · 8.0% maint · 8.0% mgmt
Financing live
Cash to close
- Down payment
- $12,475
- Closing costs
- $1,497
- Reserves months
- —
- Total cash needed
- —
Loan-product check · same deal, 3 products live
Conventional
25% down · 7.5% · 30yr
- Down + closing
- —
- Monthly P&I
- —
- Monthly cashflow
- —
- DSCR
- —
- Eligible?
- —
Personal DTI + credit; lowest rate.
DSCR
20% down · 8.5% · 30yr
- Down + closing
- —
- Monthly P&I
- —
- Monthly cashflow
- —
- DSCR
- —
- Eligible?
- —
No personal income docs; deal must DSCR.
Hard money
10% down · 12.0% · 12mo
- Down + closing
- —
- Monthly P&I
- —
- Monthly cashflow
- —
- DSCR
- —
- Eligible?
- —
Short-term bridge; refi at stabilization.
Rent comps 40 comps
| Address | Beds | Baths | Sqft | Rent | $/sqft | DOM | Units | Dist |
|---|---|---|---|---|---|---|---|---|
| 920 Clement St Akron, OH | 2.0 | 1.0 | 940 | $995 | $1.06 | 15d | 1 | 0.11mi |
| 1055 Neville Ave Akron, OH | 2.0 | 1.0 | 600 | $700 | $1.17 | 44d | 1 | 0.13mi |
| 1017 Neville Ave Akron, OH | 2.0 | 1.0 | 600 | $675 | $1.12 | 44d | 1 | 0.13mi |
| 1093 Georgia Ave Akron, OH | 2.0 | 1.0 | 752 | $1,103 | $1.47 | 15d | 1 | 0.22mi |
| 1125 Georgia Ave Akron, OH | 3.0 | 1.0 | 1060 | $1,300 | $1.23 | 15d | 1 | 0.26mi |
| 778 Ravenswood St Akron, OH | 2.0 | 1.0 | 616 | $1,150 | $1.87 | 24d | 1 | 0.26mi |
| 1078 Lindsay Ave Akron, OH | 3.0 | 2.0 | 1005 | $1,350 | $1.34 | 44d | 1 | 0.30mi |
| 958 Hunt St #2 Akron, OH | 1.0 | 1.0 | 700 | $600 | $0.86 | 44d | 1 | 0.30mi |
| 958 Hunt St Unit A Akron, OH | 1.0 | 1.0 | 800 | $750 | $0.94 | 44d | 1 | 0.30mi |
| 1070 Super Genius Cir Akron, OH | 2.0–4.0 | 1.0–2.0 | 1145 | $919 | $0.80 | 15d | 1 | 0.36mi |
| 972 Concord Ave Akron, OH | 2.0 | 1.0 | 720 | $1,173 | $1.63 | 44d | 1 | 0.36mi |
| 864 Wyley Ave Akron, OH | 2.0 | 1.0 | 800 | $1,500 | $1.88 | 44d | 1 | 0.37mi |
| 902 Cole Ave Akron, OH | 3.0 | 1.0 | 984 | $1,050 | $1.07 | 15d | 1 | 0.48mi |
| 1005 Pardee Ave Akron, OH | 2.0 | 1.0 | 862 | $1,025 | $1.19 | 44d | 1 | 0.51mi |
| 780 Anderson Ave #13 Akron, OH | 1.0 | 1.0 | 700 | $785 | $1.12 | 44d | 1 | 0.53mi |
| 780 Anderson Ave #12 Akron, OH | 1.0 | 1.0 | 700 | $785 | $1.12 | 15d | 1 | 0.53mi |
| 1204 Inman St Akron, OH | 3.0 | 1.0 | 1080 | $1,200 | $1.11 | 24d | 1 | 0.54mi |
| 794 Anderson Ave #9 Akron, OH | 1.0 | 1.0 | 600 | $785 | $1.31 | 24d | 1 | 0.55mi |
| 668 Roscoe Ave Akron, OH | 2.0 | 1.0 | 720 | $875 | $1.22 | 44d | 1 | 0.56mi |
| 769 Anderson Ave #6 Akron, OH | 1.0 | 1.0 | 600 | $785 | $1.31 | 15d | 1 | 0.56mi |
| 783 Anderson Ave Apt 5 Akron, OH | 2.0 | 1.0 | 900 | $900 | $1.00 | 44d | 1 | 0.56mi |
| 764 Lindsay Ave Akron, OH | 3.0 | 1.0 | 1000 | $1,295 | $1.29 | 15d | 1 | 0.56mi |
| 783 Anderson Ave Apt 10 Akron, OH | 2.0 | 1.0 | 900 | $900 | $1.00 | 15d | 1 | 0.57mi |
| 779 Anderson Ave Apt 11 Akron, OH | 2.0 | 1.0 | 900 | $900 | $1.00 | 44d | 1 | 0.57mi |
| 779 Anderson Ave Apt 10 Akron, OH | 2.0 | 1.0 | 900 | $900 | $1.00 | 15d | 1 | 0.57mi |
| 779 Anderson Ave Apt 11 Akron, OH | 2.0 | 1.0 | 900 | $900 | $1.00 | 24d | 1 | 0.57mi |
| 551 Baltimore Ave Unit 551 Akron, OH | 2.0 | 1.0 | 588 | $850 | $1.45 | 44d | 1 | 0.59mi |
| 551 Baltimore Ave Akron, OH | 2.0 | 1.0 | 588 | $850 | $1.45 | 24d | 1 | 0.60mi |
| 571 Chittenden St Akron, OH | 3.0 | 1.0 | 982 | $1,200 | $1.22 | 44d | 1 | 0.61mi |
| 1313 Coventry St Akron, OH | 2.0 | 1.0 | 913 | $1,250 | $1.37 | 15d | 1 | 0.77mi |
| 548 Winans Ave Akron, OH | 1.0 | 1.0 | 700 | $1,100 | $1.57 | 44d | 1 | 0.89mi |
| 621 Hudson Ave Akron, OH | 3.0 | 1.0 | 780 | $1,100 | $1.41 | 15d | 1 | 0.93mi |
| 1102 Neptune Ave Akron, OH | 3.0 | 1.0 | 1000 | $1,200 | $1.20 | 44d | 1 | 0.95mi |
| 1442 Virginia Ave Akron, OH | 2.0 | 1.0 | 840 | $795 | $0.95 | 44d | 1 | 0.95mi |
| 1566 Coventry St Akron, OH | 1.0 | 1.5 | 600 | $795 | $1.32 | 44d | 1 | 0.98mi |
| 1036 Neptune Ave Akron, OH | 3.0 | 1.0 | 1000 | $1,350 | $1.35 | 44d | 1 | 0.99mi |
| 1588 Coventry St Unit 7 Akron, OH | 1.0 | 1.0 | 600 | $795 | $1.32 | 24d | 1 | 1.01mi |
| 629 Morgan Ave Akron, OH | 2.0 | 1.0 | 960 | $1,200 | $1.25 | 44d | 1 | 1.06mi |
| 377 Talbot Ave Akron, OH | 2.0 | 1.0 | 1070 | $1,050 | $0.98 | 44d | 1 | 1.11mi |
| 167 Chittenden St Unit 3 Akron, OH | 1.0 | 1.0 | 575 | $700 | $1.22 | 44d | 1 | 1.38mi |
Listing history 11 events
-
2026-06-18days on market $49,900 Active 13 DOM
-
2026-06-17days on market $49,900 Active 12 DOM
-
2026-06-16days on market $49,900 Active 11 DOM
-
2026-06-15days on market $49,900 Active 10 DOM
-
2026-06-14days on market $49,900 Active 8 DOM
-
2026-06-13days on market $49,900 Active 7 DOM
-
2026-06-10days on market $49,900 Active 5 DOM
-
2026-06-09days on market $49,900 Active 4 DOM
-
2026-06-08days on market $49,900 Active 3 DOM
-
2026-06-07remarks 452-char remark
-
2026-06-07$49,900 Active 2 DOM
ⓘ Source: listings_history table (triggers on properties + properties_extension) + one-shot
backfill from property_details.listing_events for pre-trigger history.
Climate risk First Street
- Flood 1/10 Low FEMA zone X (unshaded) · 0% chance over 30 yrs
- Wildfire 1/10 Low
- Heat 3/10 Moderate 7 d/yr ≥96°F today · 17 d/yr by 30 yrs out
- Wind 1/10 Low
- Air quality 2/10 Low 1 unhealthy d/yr today · 2 by 30 yrs out
Nearby sold comps map
Loading sold comps map…
Walkable amenities ~0.75 mi
Loading nearby amenities…
Taxation est. · year 1
- Rental income
- $12,007
- − Mortgage interest
- −$2,795
- − Property taxes
- −$748
- − Insurance
- −$250
- − Repairs & maintenance
- −$961
- − Management
- −$961
- − Depreciation
- −$1,452
- Taxable income
- $4,841
- Est. tax owed @ 24.0%
- −$1,162
- After-tax cash flow
- $4,185/yr
For passive investors: Depreciation is non-cash, so a rental often shows a tax loss while cash-flowing — sheltering income. Rental losses are passive: they offset passive income freely, and up to $25,000/yr can offset ordinary (W-2) income if you actively participate and your MAGI is under $100k (phasing out to $0 by $150k); unused losses carry forward. On sale, claimed depreciation is recaptured at up to 25%, and gains may owe capital-gains tax (a 1031 exchange can defer both). Figures are a year-1 estimate at your 24.0% rate — not tax advice; consult a CPA.
Schools (NCES district)
- District
- Akron City
- NCES district ID
- 3904348
- Math proficiency
- 22% ▼ -17.00%
- Reading proficiency
- 30% ▼ -12.00%
- Median HH income
- $33,811
- Composite
- 21.31/100
- National rank
- #8383
- State rank
- #602 of 656 in OH
Livability — Akron
- Score
- 81/100
- State rank
- #104
- US rank
- #1591
Category grades
Schools grade is shown separately in the Schools card above.
Census & demographics
- Census place
- Akron, OH
- County
- Summit County · 440,783 people
- City population
- 174,375
- Metro
- Akron, OH
- Population (ZIP)
- 20,905
- Household income
- $41,688
- Rent vs Own
- Severe rent burden
- 1251.0
Population outlook (Summit County) Hauer SSP2
- Today (2025)
- 546,583 people
- By 2030
- 544,028 · -0.5%
- By 2040
- 531,363 · -2.8%
- By 2050
- 514,923 · -5.8%
- By 2075
- 481,765 · -11.9%
- By 2100
- 432,265 · -20.9%
Race, ethnicity, and origin ACS 2023
- Neighborhood character
- Diverse neighborhood (Simpson 0.62)
- Race & ethnicity
- White 48% Black 38% Two or more races 8% Hispanic / Latino 3% Asian 2%
- Common ancestry
- Lithuanian 2% Iranian 1% Scotch-Irish 1%
- Foreign-born
- 4% · Vietnam, Canada, Philippines
- Languages at home
- 94% English-only · Spanish 2% Other Asian/Pacific 1% Vietnamese 1%
Political lean MEDSL · Summit
- 2024 margin
- Lean D (+7.0) · D 53.0% · R 46.0%
- 2008→2024 swing
- -9.6pp toward R · 2008: 16.6pp · 2024: 7.0pp
- All cycles
- 2024: D+7.0 2020: D+9.6 2016: D+8.2 2012: D+14.8 2008: D+16.6
Not yet ingested
- Civics
- —
Market trends
- HPI YoY
- ▼ -101.46%
- Current HPI
- 132.768
- Rent YoY
- ▲ 7.63%
- Metro
- Akron, OH
- State GDP YoY
- ▲ 1.98%
- F500 in state
- 48
Industry mix (Fortune 500 HQ in OH)
| Industry | F500 HQs | Revenue |
|---|---|---|
| Insurance | 3 | $145B |
|
||
| Industrial Machinery | 3 | $49B |
|
||
| Financial Services | 3 | $24B |
|
||
| Consumer Goods | 2 | $93B |
|
||
| Aerospace / Defense | 2 | $47B |
|
||
| Utilities | 2 | $33B |
|
||
Price history
+91.9% since first listed6 events — show timeline
- 2026-06-05 Listed $49,900 MLSNOW
- 1995-12-15 Listing Removed — MLSNOW
- 1995-09-08 Listed $39,900 MLSNOW
- 1994-12-19 Listing Removed — MLSNOW
- 1994-07-15 Listed $39,900 MLSNOW
- 1985-10-07 Sold (Public Records) $26,000 Public Records
Property tax history
+16.1%/yrLatest (2025): $2,919 · +117.7% YoY. Source: county tax records.
Cash-flow waterfall
monthlySold comps — $/sqft
last 12 mo · ≤1 miLoading sold comps…