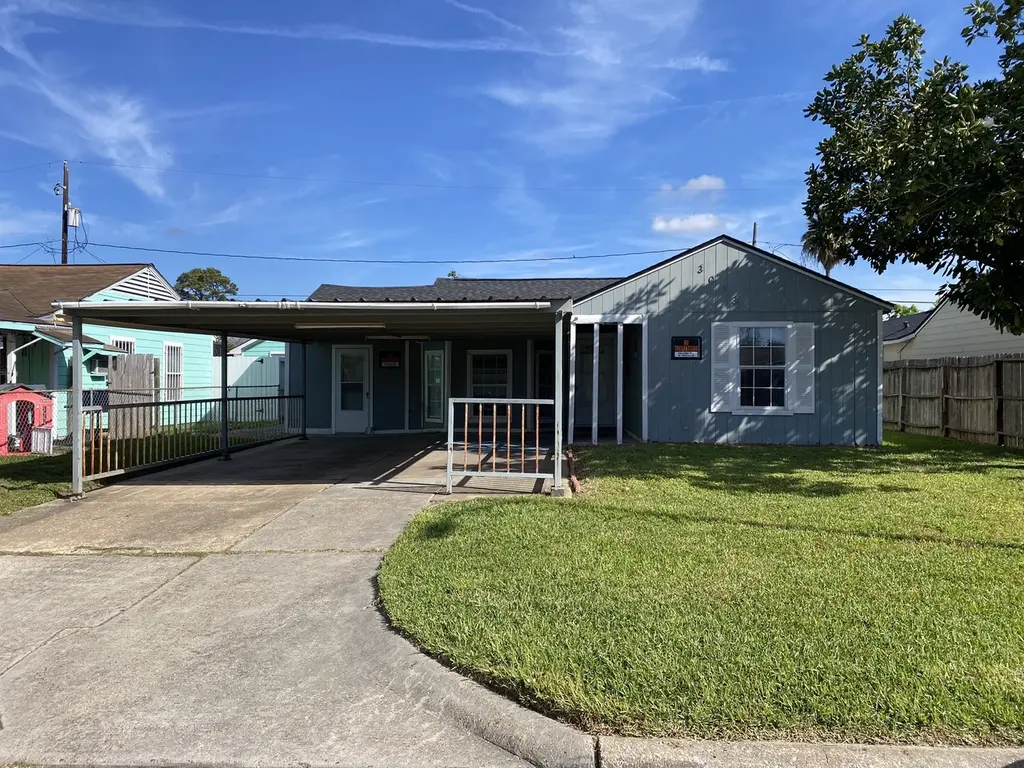
3013 Fern St · Pasadena, TX
Flood risk 6/10 · Moderate
- FEMA flood zone
- X (unshaded)
- Chance of flooding over 30 yrs
- 0.69%
- Est. flood insurance / yr
- $507 – $1,088
Fire risk 3/10 · Minor
- Est. fire insurance / yr
- $1,222 – $2,270
Heat risk 9/10 · Severe
- Hot days now (above 109°F)
- 7 days/yr
- Hot days in 30 yrs
- 22 days/yr
Wind risk 9/10 · Severe
- Chance of severe wind over 30 yrs
- 99.0%
Air-quality risk 2/10 · Minimal
- Unhealthy air days now
- 2 days/yr
- Unhealthy air days in 30 yrs
- 2 days/yr
Risk factors via First Street. Map © Google.
Why this score? — see what drove the D grade
The composite is a weighted blend of 9 inputs, each scored 0–100. Each bar is that input's sub-score; the figure is the points it added to the 100-point composite (weight × sub-score).
- Cash flow +12.9/30.0
- ARV discount +11.5/15.0
- Schools +4.3/10.0
- 1% rule +3.9/10.0
- DSCR +3.9/10.0
- Livability +3.3/5.0
- Condition / age +2.5/5.0
- Rent growth +0.1/5.0
- Appreciation +0.0/10.0
$164,800
🖨 Deal sheet (PDF) 📄 Offer letter ✓ Due diligence
Listing remarks
Great Location. This is a DIAMOND in the rough! A a handy man special, this house is ready to be molded into your perfect home. Call your agent and make an appointment today, it will not last. Bring All Reasonable Offers, Motivated Seller
Key facts
- 5,501 sq ft lot
- Parking
- Built 1952
Property features AI
Exterior
- Parking: Driveway parking
- Utilities: Public water; Public sewer
- Home design: Residential property; Single-story entry (first floor living areas)
- Construction: Built in 1952; Cement siding; Composition roof; Slab foundation
- Exterior features: Fully fenced yard; Handicap accessible; Concrete driveway/road surface; Located in a subdivision
Interior
- Kitchen: Kitchen on the first floor (20 x 11)
- Bedrooms: Primary bedroom on the first floor (18 x 9); Additional bedroom on the first floor (13 x 9); Home configured with two possible bedrooms
- Flooring: Laminate flooring; Tile flooring
- Bathrooms: Two full bathrooms
- Interior features: Tub/shower; Kitchen and dining combined; Wheelchair accessible
- Laundry & utility: Washer hookup; Electric dryer hookup; Utility room on the first floor (10 x 7)
Neighborhood map
What this means for you Summary
Snapshot
- This is a 3-bed/1.0-bath single-family listed at $165k.
Deal economics
- At list price, monthly cash flow is $-13 ($-151/yr) — negative.
- To cash-flow at today's rent, offer at most $163k (1.4% below list).
- To meet the 1% rule (rent ≥ 1% of price), the offer needs to be $147k (10.8% below list).
- Recommended offer: $147k (10.8% below list) — sets the bar for 1% rule.
- Cap rate 6.2% vs local median 3.5% in Pasadena — top-decile yield for the area; either an underpriced asset or a hidden risk that comps aren't pricing in. Stress-test before assuming the spread holds.
Location & tenants
- Location reads 66/100 on livability (#600 in TX) — a middle-class / working-renter tenant base. Strengths: cost of living A+, housing A+; Watch: employment D+, crime F, amenities F.
- Deer Park ISD (suburban): math 50% / reading 47% proficiency, ranked #170 of 826 in TX (top 21%) — families likely to look elsewhere, expect single-tenant / working-renter base with shorter leases.
- Zoned schools: Deepwater El (math 29% / reading 27%, grade F, #2,740 of 4,322 statewide, top 64%, 631 students, 89% FRL); Deepwater J H (math 47% / reading 36%, grade F, #595 of 1,662 statewide, top 37%, 643 students, 86% FRL); Deer Park H S (math 57% / reading 59%, grade C, #320 of 1,632 statewide, top 20%, 4,026 students, 38% FRL) — zoned schools average 71% FRL vs 40% district-wide (30 pts higher); higher-poverty schools than district average — tighter screening recommended.
- Market conditions: Rents falling (-9.4%/yr); 82 active listings in the ZIP; 16 comparable units currently listed for rent nearby; rentals at typical pace (median 24d on market — plan ~3-4 weeks tenant-placement turnaround); 44% of comp listings sitting > 30 days — soft ceiling on asking rent; 29,883 units permitted in Harris County in 2024 (8,621 in 5+ unit buildings).
Forward outlook
- Local home prices are declining (-3.0%/yr); year-one equity from $1k of loan paydown is wiped out by about $5k of value loss. Plan a longer hold.
- Harris County population projected at +47% by 2050 — long-run rental-demand tailwind backs the buy-and-hold thesis.
Negotiation context
- It's been on market 57 days — a 3% lower offer ($160k) is reasonable based on typical stale-listing flexibility.
- 2 sale attempts with the ask held roughly flat each time — persistent listings suggest the price (not the market) is what's stuck; bring a comps-based counter.
Risks & watch-outs
- Watch-outs: built in 1952 — expect roof / HVAC / electrical / plumbing capex.
- Climate carrying-cost: major flood risk; severe wind risk, 99% chance of damaging wind over 30y; extreme-heat days projected 7→22/yr by 2055 (HVAC capex compounding) — expect insurance premiums to compound above CPI over the hold.
Questions for the listing agent
- What do current leases actually rent for vs. the listed asking? Can we see a recent rent roll and the last 12 months of T-12 income?
- It's been on market 57 days. Have you received any prior offers? Is the seller open to a 11% concession, seller financing, or rate buy-down credit?
- Built in 1952 — when were the roof, HVAC, electrical panel, plumbing, and water heater last replaced?
- Is there a deadline driving the sale (1031 exchange, divorce, estate, relocation)? That informs how much negotiation room exists.
- Schools are D-rated, which usually means shorter tenancies and higher turnover. Who's the typical renter profile here, and what's been the actual vacancy rate?
- Crime grade is F in this area — have there been break-ins, vandalism, or insurance claims at this property in the last 3 years? What carrier currently insures it and at what premium?
- The area grade is low — what's the realistic commute time and amenity access for the typical tenant pool here? Any planned neighborhood developments (good or bad) we should know about?
- What's the average days-on-market for RENTAL listings here right now (not sales)? A rising rental-DOM trend means longer vacancies and softer asking-rent achievability than the comps imply.
- What's the recent tenant-quality profile in this submarket — average credit score on applications, eviction rate, late-payment / NSF rate, and stable-employment percentage? A property-management company in the area should have these aggregated.
- How much new for-sale + rental construction is in the pipeline within 1–3 miles? Heavy new supply typically softens prices + rents 12–24 months out; constrained supply supports both.
Investment metrics
- 1% rule
- 0.89% ✗
- Cap rate
- 6.20%
- Cash-on-cash
- -0.33%
- DSCR
- 0.99
- GRM
- 9.3
CMA / ARV
- ARV (median comp)
- $180,823
- List price
- $164,800
- Delta
- -8.86%
- Verdict
- FAIR
- Comps
- 20 within 1.0 mi
Show comp detail 12 sales within ~0.75 mi
| Address | Dist | Beds/Ba | Sqft | Sold | Price | $/sf | Match |
|---|---|---|---|---|---|---|---|
| 3207 Washington St | 0.24mi | 3/1.0 | 1,162 (-0%) | 2mo | $146,900 | $126 | 87 |
| 3119 Washington St | 0.18mi | 3/2.0 | 1,142 (-2%) | 1mo | $124,500 | $109 | 83 |
| 3122 Fern St | 0.16mi | 3/1.0 | 1,024 (-12%) | 1mo | $180,000 | $176 | 71 |
| 3515 Meadowlake Rd | 0.55mi | 3/1.5 | 1,125 (-3%) | 1mo | $169,000 | $150 | 66 |
| 3202 Hays St | 0.22mi | 3/1.0 | 1,000 (-14%) | 3mo | $182,000 | $182 | 64 |
| 2716 N Harris Ave | 0.65mi | 3/1.0 | 1,107 (-5%) | 0mo | $179,900 | $163 | 61 |
| 119 Burke Rd | 0.45mi | 4/2.0 (+1) | 1,235 (+6%) | 2mo | $215,000 | $174 | 58 |
| 2616 Windsor Ln | 0.65mi | 4/2.0 (+1) | 1,220 (+5%) | 1mo | $229,990 | $189 | 52 |
| 619 Burke Rd | 0.63mi | 4/2.0 (+1) | 1,225 (+5%) | 1mo | $150,000 | $122 | 52 |
| 120 Sherman Ave | 0.43mi | 4/2.0 (+1) | 1,304 (+12%) | 2mo | $214,900 | $165 | 49 |
| 2510 Windsor Ln | 0.71mi | 4/2.0 (+1) | 1,221 (+5%) | 2mo | $199,990 | $164 | 48 |
| 2308 Garvey Dr | 0.73mi | 4/2.0 (+1) | 1,281 (+10%) | 0mo | $239,900 | $187 | 40 |
Match score weights: distance 35% · size 25% · config 20% · recency 20%. Top-matched comps best support the ARV.
Projected returns pro-forma
-3.0% appreciation · 0.0% rent growth · sell at horizon
- IRR
- -20.3%
- Equity multiple
- 0.31×
- Total profit
- $-31,769
- Equity at exit
- $24,572
- IRR
- -22.3%
- Equity multiple
- 0.02×
- Total profit
- $-45,161
- Equity at exit
- $14,249
Cash invested: $46,144 (down + closing). Projections, not guarantees.
Landlord ↔ Tenant lean methodology
- Overall (STATE)
- 87 Strongly Landlord-Friendly
- State Texas
- 87 Strongly Landlord-Friendly · R+5
- County
- — inherits STATE
- City
- — inherits STATE
ZIP-level market 77503
- Home prices YoY
- -13.7%
- Rents YoY
- -9.4%
- Active inventory
- 82
- Price-to-rent
- 9.3×
Monthly cashflow live
- Estimated rent
- $1,469 high interval (Pro) →
- Mortgage (P&I)
- −$864
- Tax from tax record
- −$240 /mo · $2,885/yr
- Insurance
- −$69
- HOA
- −$0
- Vacancy / Maint / Mgmt
- −$309
- Net cashflow
- $-13
Break-even live
Sensitivity live
| Price | -10% $81 | -5% $34 | +0% $-13 | +5% $-59 | +10% $-106 |
|---|---|---|---|---|---|
| Rent | -10% $-129 | -5% $-71 | +0% $-13 | +5% $45 | +10% $103 |
| Rate | -1.0pp $70 | -0.5pp $29 | base $-13 | +0.5pp $-55 | +1.0pp $-99 |
UW: 25.0% down · 7.5% · 30yr · 1.5% tax · 5.0% vac · 8.0% maint · 8.0% mgmt
Financing live
Cash to close
- Down payment
- $41,200
- Closing costs
- $4,944
- Reserves months
- —
- Total cash needed
- —
Loan-product check · same deal, 3 products live
Conventional
25% down · 7.5% · 30yr
- Down + closing
- —
- Monthly P&I
- —
- Monthly cashflow
- —
- DSCR
- —
- Eligible?
- —
Personal DTI + credit; lowest rate.
DSCR
20% down · 8.5% · 30yr
- Down + closing
- —
- Monthly P&I
- —
- Monthly cashflow
- —
- DSCR
- —
- Eligible?
- —
No personal income docs; deal must DSCR.
Hard money
10% down · 12.0% · 12mo
- Down + closing
- —
- Monthly P&I
- —
- Monthly cashflow
- —
- DSCR
- —
- Eligible?
- —
Short-term bridge; refi at stabilization.
Rent comps 16 comps
| Address | Beds | Baths | Sqft | Rent | $/sqft | DOM | Units | Dist |
|---|---|---|---|---|---|---|---|---|
| 3112 Grant St Pasadena, TX | 3.0 | 1.0 | 1330 | $1,625 | $1.22 | 23d | 1 | 0.11mi |
| 3119 Chestershire Dr Pasadena, TX | 3.0 | 1.0 | 1081 | $1,625 | $1.50 | 45d | 1 | 0.28mi |
| 707 Preston Ave Pasadena, TX | 3.0 | 2.0 | 1250 | $1,089 | $0.87 | 23d | 1 | 0.52mi |
| 707 Preston Ave Pasadena, TX | 2.0 | 2.0 | 965 | $949 | $0.98 | 46d | 1 | 0.52mi |
| 2405 Pomona Dr Pasadena, TX | 3.0 | 1.0 | 1162 | $1,499 | $1.29 | 45d | 1 | 0.68mi |
| 719 Burke Rd Pasadena, TX | 3.0 | 2.0 | 1158 | $2,000 | $1.73 | 6d | 1 | 0.76mi |
| 205 Tilden Dr Pasadena, TX | 3.0 | 1.0 | 1208 | $1,550 | $1.28 | 45d | 1 | 1.02mi |
| 3502 Longwood Dr Unit B Pasadena, TX | 2.0 | 1.0 | 738 | $1,195 | $1.62 | 20d | 1 | 1.02mi |
| 909 Birnham Woods Blvd Pasadena, TX | 3.0 | 1.5–2.0 | 1234 | $1,737 | $1.41 | 0d | 6 | 1.05mi |
| 915 Birnham Woods Blvd Pasadena, TX | 3.0 | 1.0 | 1340 | $1,550 | $1.16 | 45d | 1 | 1.12mi |
| 3207 Red Bluff Rd Pasadena, TX | 2.0 | 1.0 | 800 | $1,150 | $1.44 | 45d | 1 | 1.13mi |
| 2401 Southmore Ave Pasadena, TX | 1.0–3.0 | 1.0–2.0 | 835 | $1,325 | $1.59 | 5d | 4 | 1.16mi |
| 1750 Jenkins Rd Pasadena, TX | 2.0 | 2.0 | 926 | $1,135 | $1.23 | 45d | 1 | 1.26mi |
| 1744 Jenkins Rd Pasadena, TX | 1.0–2.0 | 1.0–2.0 | 807 | $1,365 | $1.69 | 7d | 1 | 1.27mi |
| 1111 E. Beltway 8 Pasadena, TX | 2.0 | 1.0 | 900 | $825 | $0.92 | 7d | 1 | 1.40mi |
| 3500 Red Bluff Rd Pasadena, TX | 1.0–2.0 | 1.0–1.5 | 804 | $1,050 | $1.31 | 0d | 72 | 1.48mi |
Listing history 17 events
-
2026-06-18status $164,800 Pending 57 DOM
-
2026-06-18days on market $164,800 Active 57 DOM
-
2026-06-17days on market $164,800 Active 56 DOM
-
2026-06-16days on market $164,800 Active 55 DOM
-
2026-06-15days on market $164,800 Active 54 DOM
-
2026-06-13days on market $164,800 Active 52 DOM
-
2026-06-09days on market $164,800 Active 48 DOM
-
2026-06-08days on market $164,800 Active 47 DOM
-
2026-06-07days on market $164,800 Active 46 DOM
-
2026-06-04days on market $164,800 Active 43 DOM
-
2026-06-02days on market $164,800 Active 41 DOM
-
2026-06-01days on market $164,800 Active 40 DOM
-
2026-05-31days on market $164,800 Active 39 DOM
-
2026-04-22historical
-
2026-04-22$170,000 Active 238-char remark
-
2026-03-19$170,000 Active
-
1996-12-03soldstatus
ⓘ Source: listings_history table (triggers on properties + properties_extension) + one-shot
backfill from property_details.listing_events for pre-trigger history.
Tax reassessment forecast TX · Resets to sale price
- Current annual tax
- $2,885 · $240/mo
- Projected year-2 tax
- $3,016 · $251/mo
- Expected delta
- +$131/yr (+$11/mo · 4.5%)
ⓘ Screening estimate from a state-policy table — verify with the county assessor before closing.
Climate risk First Street
- Flood 6/10 Major FEMA zone X (unshaded) · 69% chance over 30 yrs
- Wildfire 3/10 Moderate
- Heat 9/10 Extreme 7 d/yr ≥109°F today · 22 d/yr by 30 yrs out
- Wind 9/10 Extreme 99% chance of damaging wind over 30 yrs
- Air quality 2/10 Low 2 unhealthy d/yr today · 2 by 30 yrs out
Nearby sold comps map
Loading sold comps map…
Walkable amenities ~0.75 mi
Loading nearby amenities…
Taxation est. · year 1
- Rental income
- $17,631
- − Mortgage interest
- −$9,231
- − Property taxes
- −$2,885
- − Insurance
- −$824
- − Repairs & maintenance
- −$1,410
- − Management
- −$1,410
- − Depreciation
- −$4,794
- Taxable loss
- −$2,924
- Est. tax savings @ 24.0%
- +$702
- After-tax cash flow
- $551/yr
For passive investors: Depreciation is non-cash, so a rental often shows a tax loss while cash-flowing — sheltering income. Rental losses are passive: they offset passive income freely, and up to $25,000/yr can offset ordinary (W-2) income if you actively participate and your MAGI is under $100k (phasing out to $0 by $150k); unused losses carry forward. On sale, claimed depreciation is recaptured at up to 25%, and gains may owe capital-gains tax (a 1031 exchange can defer both). Figures are a year-1 estimate at your 24.0% rate — not tax advice; consult a CPA.
Schools (NCES district)
- District
- Deer Park ISD
- NCES district ID
- 4816530
- Math proficiency
- 50% ▼ -10.00%
- Reading proficiency
- 47% ▼ -3.00%
- Median HH income
- $68,227
- Composite
- 43.3/100
- National rank
- #3039
- State rank
- #170 of 826 in TX
Livability — Pasadena
- Score
- 66/100
- State rank
- #600
- US rank
- #11438
Category grades
Schools grade is shown separately in the Schools card above.
Census & demographics
- Census place
- Pasadena, TX
- County
- Harris County · 4,702,590 people
- City population
- 109,190
- Metro
- Houston-The Woodlands-Sugar Land, TX
- Population (ZIP)
- 23,866
- Household income
- $66,797
- Rent vs Own
- Severe rent burden
- 1101.0
Population outlook (Harris County) Hauer SSP2
- Today (2025)
- 5,571,493 people
- By 2030
- 6,089,821 · +9.3%
- By 2040
- 7,142,806 · +28.2%
- By 2050
- 8,185,864 · +46.9%
- By 2075
- 10,574,329 · +89.8%
- By 2100
- 12,109,958 · +117.4%
Race, ethnicity, and origin ACS 2023
- Neighborhood character
- Predominantly Hispanic (75%)
- Race & ethnicity
- Hispanic / Latino 75% Two or more races 34% White 20% Native American 2% Black 2%
- Hispanic origin (detail)
- Mexican 62% Puerto Rican 3%
- Common ancestry
- Italian 3% Romanian 1% Lithuanian 1%
- Foreign-born
- 25% · Canada
- Languages at home
- 50% English-only · Spanish 49%
Political lean MEDSL · Harris
- 2024 margin
- Lean D (+5.5) · D 52.0% · R 46.4% · Other 1.6%
- 2008→2024 swing
- +3.9pp toward D · 2008: 1.6pp · 2024: 5.5pp
- All cycles
- 2024: D+5.5 2020: D+13.3 2016: D+12.4 2012: D+0.1 2008: D+1.6
Not yet ingested
- Civics
- —
Market trends
- HPI YoY
- ▼ -46.01%
- Current HPI
- 288.9079
- Rent YoY
- ▼ -9.41%
- Metro
- Houston-The Woodlands-Sugar Land, TX
- State GDP YoY
- ▲ 3.95%
- F500 in state
- 110
Industry mix (Fortune 500 HQ in TX)
| Industry | F500 HQs | Revenue |
|---|---|---|
| Energy | 16 | $1,198B |
|
||
| Technology | 5 | $198B |
|
||
| Engineering / Construction | 4 | $72B |
|
||
| Energy Services | 3 | $60B |
|
||
| Utilities | 3 | $41B |
|
||
| Healthcare | 2 | $330B |
|
||
Price history
-3.1% since first listed6 events — show timeline
- 2026-06-18 Pending — HARMLS
- 2026-05-26 Price Changed $164,800 HARMLS
- 2026-04-22 Listing Removed — HARMLS
- 2026-04-22 Listed $170,000 HARMLS
- 2026-03-19 Listed $170,000 HARMLS
- 1996-12-03 Sold (Public Records) — Public Records
Property tax history
+3.3%/yrLatest (2025): $2,885 · +11.3% YoY. Source: county tax records.
Cash-flow waterfall
monthlySold comps — $/sqft
last 12 mo · ≤1 miLoading sold comps…