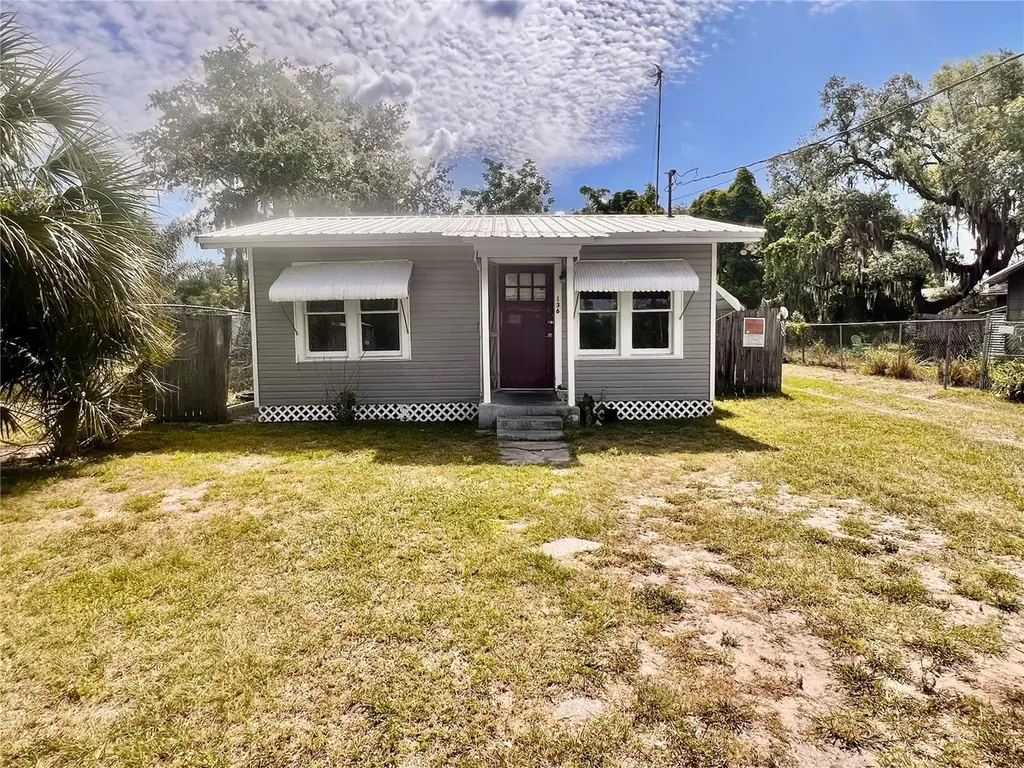
136 Arizona Ave · Crystal Lake, FL
Flood risk 1/10 · Minimal
- FEMA flood zone
- X (unshaded)
- Chance of flooding over 30 yrs
- 0.0%
- Est. flood insurance / yr
- $507 – $1,088
Fire risk 2/10 · Minimal
- Est. fire insurance / yr
- $947 – $1,759
Heat risk 8/10 · Major
- Hot days now (above 108°F)
- 7 days/yr
- Hot days in 30 yrs
- 23 days/yr
Wind risk 9/10 · Severe
- Chance of severe wind over 30 yrs
- 99.0%
Air-quality risk 2/10 · Minimal
- Unhealthy air days now
- 1 days/yr
- Unhealthy air days in 30 yrs
- 2 days/yr
Risk factors via First Street. Map © Google.
Why this score? — see what drove the C grade
The composite is a weighted blend of 9 inputs, each scored 0–100. Each bar is that input's sub-score; the figure is the points it added to the 100-point composite (weight × sub-score).
- Cash flow +25.0/30.0
- DSCR +8.2/10.0
- ARV discount +7.5/15.0
- 1% rule +6.2/10.0
- Schools +3.5/10.0
- Livability +3.3/5.0
- Rent growth +2.8/5.0
- Condition / age +2.5/5.0
- Appreciation +0.0/10.0
$119,000
🖨 Deal sheet 📄 Offer letter ✓ Due diligence
Listing remarks
Under contract-accepting backup offers. Welcome to 136 Arizona Ave, a charming Lakeland home offering flexibility, convenience, and incredible potential. The property features a smart layout with comfortable living spaces and a bright kitchen. The home was previously configured to create a rental opportunity by dividing the second bedroom with an easily removable wall, allowing you to keep the setup for extra income or restore the room to its original full size with minimal effort. Enjoy a spacious living area, a functional floor plan, and a large yard perfect for outdoor gatherings, gardening, or future enhancements. Whether you're a first-time buyer, investor, or someone looking for a hom
Key facts
- Bright kitchen
- Spacious living area
- Removable wall
Tags
Property features AI
Finance
- Other: Zoning: R-2; Living area about 905 sq ft (building area 925 sq ft); Total rooms: 3; Public records listed living area; Lot surface: Asphalt road
- Financial info: No lease restrictions; Unfurnished
- HOA & community: No HOA/association
Exterior
- Utilities: No water source specified; Public sewer; Cable available; Electricity connected; Sewer connected; Water connected
- Home design: Single-family residence; Residential property; Fixer condition; One story; Faces west; Entry level: One
- Construction: Frame construction; Metal roof; Crawlspace foundation; Built on a 0.09-acre lot (approx. 50 x 77)
- Exterior features: Storage
Interior
- Kitchen: Range; Refrigerator
- Bedrooms: 2 bedrooms
- Flooring: Carpet; Ceramic tile; Wood
- Bathrooms: 1 full bathroom
- Heating & cooling: No central heating; Wall/window unit(s) for cooling
- Interior features: Ceiling fans
- Laundry & utility: Laundry: Other
Neighborhood map
What this means for you Summary
Snapshot
- This is a 2-bed/1.0-bath single-family listed at $119k.
Deal economics
- At list price, monthly cash flow is $261 ($3k/yr) — positive.
- The deal already cash-flows at list — no discount required.
- Meets the 1% rule at list price ($1k rent vs $119k).
- Recommended offer: $117k (1.5% below list) — sets the bar for market timing.
Location & tenants
- Location reads 66/100 on livability (#620 in FL) — a middle-class / working-renter tenant base. Strengths: cost of living A+, housing A+, health & safety A; Watch: amenities F, commute F, employment F.
- Polk (suburban): math 39% / reading 43% proficiency, ranked #62 of 73 in FL (top 85%) — families likely to look elsewhere, expect single-tenant / working-renter base with shorter leases.
- Zoned schools: Crystal Lake Elementary School (math 12% / reading 22%, grade F, #2,121 of 2,144 statewide, top 99%, 409 students, 60% FRL) — zoned schools at 60% FRL track the district average.
- Zoned-school proficiency averages 17% at this address vs 41% district-wide (-24 pts) — the specific schools serving this property underperform the Polk average; the district grade overstates school quality for this exact location.
- Market conditions: Rents rising (+1.1%/yr); 253 active listings in the ZIP; 19 comparable units currently listed for rent nearby; rentals at typical pace (median 23d on market — plan ~3-4 weeks tenant-placement turnaround); 10,384 units permitted in Polk County in 2024 (1,716 in 5+ unit buildings).
- This rent runs 30% of the median local income ($53k/yr) — at the standard rent-burdened threshold; future hikes will face affordability resistance.
Forward outlook
- Local home prices are declining (-3.0%/yr); year-one equity from $823 of loan paydown is wiped out by about $4k of value loss. Plan a longer hold.
- Polk County population projected at +33% by 2050 — long-run rental-demand tailwind backs the buy-and-hold thesis.
Negotiation context
- It's been on market 24 days — a 2% lower offer ($117k) is reasonable based on typical stale-listing flexibility.
- 4 sale attempts since 20y ago with the ask held roughly flat each time — persistent listings suggest the price (not the market) is what's stuck; bring a comps-based counter.
- Current owner paid $6k; list at $119k implies a 2064% gain — meaningful room to come down on a strong offer.
Risks & watch-outs
- Watch-outs: built in 1955 — expect roof / HVAC / electrical / plumbing capex.
- Climate carrying-cost: severe wind risk, 99% chance of damaging wind over 30y; extreme-heat days projected 7→23/yr by 2055 (HVAC capex compounding) — expect insurance premiums to compound above CPI over the hold.
Questions for the listing agent
- Built in 1955 — when were the roof, HVAC, electrical panel, plumbing, and water heater last replaced?
- Is there a deadline driving the sale (1031 exchange, divorce, estate, relocation)? That informs how much negotiation room exists.
- What's the average days-on-market for RENTAL listings here right now (not sales)? A rising rental-DOM trend means longer vacancies and softer asking-rent achievability than the comps imply.
- What's the recent tenant-quality profile in this submarket — average credit score on applications, eviction rate, late-payment / NSF rate, and stable-employment percentage? A property-management company in the area should have these aggregated.
- How much new for-sale + rental construction is in the pipeline within 1–3 miles? Heavy new supply typically softens prices + rents 12–24 months out; constrained supply supports both.
Investment metrics
- 1% rule
- 1.12% ✓
- Cap rate
- 8.92%
- Cash-on-cash
- 9.40%
- DSCR
- 1.42
- GRM
- 7.5
CMA / ARV
No comps found within radius.
Projected returns pro-forma
-3.0% appreciation · 1.05% rent growth · sell at horizon
- IRR
- -4.3%
- Equity multiple
- 0.84×
- Total profit
- $-5,221
- Equity at exit
- $17,743
- IRR
- 3.1%
- Equity multiple
- 1.20×
- Total profit
- $6,766
- Equity at exit
- $10,289
Cash invested: $33,320 (down + closing). Projections, not guarantees.
Landlord ↔ Tenant lean methodology
- Overall (STATE)
- 87 Strongly Landlord-Friendly
- State Florida
- 87 Strongly Landlord-Friendly · R+3
- County
- — inherits STATE
- City
- — inherits STATE
ZIP-level market 33801
- Home prices YoY
- -15.9%
- Rents YoY
- 1.1%
- Active inventory
- 253
- Price-to-rent
- 7.5×
Monthly cashflow live
- Estimated rent
- $1,328 high interval (Pro) →
- Mortgage (P&I)
- −$624
- Tax from tax record
- −$114 /mo · $1,370/yr
- Insurance
- −$50
- HOA
- −$0
- Vacancy / Maint / Mgmt
- −$279
- Net cashflow
- $261
Break-even live
UW: 25.0% down · 7.5% · 30yr · 1.5% tax · 5.0% vac · 8.0% maint · 8.0% mgmt
Financing live
Cash to close
- Down payment
- $29,750
- Closing costs
- $3,570
- Reserves months
- —
- Total cash needed
- —
Loan-product check · same deal, 3 products live
Conventional
25% down · 7.5% · 30yr
- Down + closing
- —
- Monthly P&I
- —
- Monthly cashflow
- —
- DSCR
- —
- Eligible?
- —
Personal DTI + credit; lowest rate.
DSCR
20% down · 8.5% · 30yr
- Down + closing
- —
- Monthly P&I
- —
- Monthly cashflow
- —
- DSCR
- —
- Eligible?
- —
No personal income docs; deal must DSCR.
Hard money
10% down · 12.0% · 12mo
- Down + closing
- —
- Monthly P&I
- —
- Monthly cashflow
- —
- DSCR
- —
- Eligible?
- —
Short-term bridge; refi at stabilization.
Rent comps 19 comps
| Address | Beds | Baths | Sqft | Rent | $/sqft | DOM | Units | Dist |
|---|---|---|---|---|---|---|---|---|
| 2184 Colonial Ave Lakeland, FL | 3.0 | 2.0 | 1123 | $1,645 | $1.46 | 23d | 1 | 0.30mi |
| 2248 Weber St Lakeland, FL | 2.0 | 1.0 | 640 | $1,335 | $2.09 | 3d | 1 | 0.58mi |
| 2417 Golfview St Lakeland, FL | 3.0 | 1.0 | 798 | $1,395 | $1.75 | 10d | 1 | 0.70mi |
| 2023 Tennyson St Unit 2025 Lakeland, FL | 2.0 | 1.0 | 884 | $1,095 | $1.24 | 23d | 1 | 0.72mi |
| 832 N Combee Rd Lakeland, FL | 2.0 | 1.0 | 560 | $1,195 | $2.13 | 23d | 1 | 0.80mi |
| 1736 E Fern Rd Lakeland, FL | 2.0 | 1.0 | 820 | $1,325 | $1.62 | 23d | 1 | 0.99mi |
| 3245 E Main St Lakeland, FL | 2.0 | 1.0 | 750 | $1,100 | $1.47 | 23d | 1 | 1.05mi |
| 3245 E Main St Unit 2 Lakeland, FL | 2.0 | 2.0 | 700 | $1,250 | $1.79 | 14d | 1 | 1.05mi |
| 2625 Kelly Ln Lakeland, FL | 1.0 | 1.0 | 560 | $1,200 | $2.14 | 23d | 1 | 1.15mi |
| 2929 Nine Iron Dr Lakeland, FL | 2.0 | 1.0 | 850 | $875 | $1.03 | 3d | 1 | 1.24mi |
| 2437 Idlewild St Lakeland, FL | 1.0 | 1.0 | 550 | $1,099 | $2.00 | 14d | 1 | 1.31mi |
| 2437 Idlewild St Lakeland, FL | 1.0 | 1.0 | 550 | $1,099 | $2.00 | 23d | 1 | 1.31mi |
| 2839 8 Iron Dr Unit 2841 Lakeland, FL | 2.0 | 1.5 | 900 | $1,397 | $1.55 | 23d | 1 | 1.32mi |
| 2415 Idlewild St Lakeland, FL | 2.0 | 1.0 | 900 | $1,300 | $1.44 | 23d | 1 | 1.33mi |
| 1108 Bartow Rd Lakeland, FL | 1.0–2.0 | 1.0 | 797 | $1,395 | $1.75 | 3d | 2 | 1.33mi |
| 2830 Skyview Dr Lakeland, FL | 2.0 | 1.0 | 850 | $1,175 | $1.38 | 23d | 1 | 1.34mi |
| 1104 Bartow Rd Lakeland, FL | 1.0–2.0 | 1.0 | 760 | $1,225 | $1.61 | 23d | 1 | 1.35mi |
| 1885 N Crystal Lake Dr Apt 7 Lakeland, FL | 2.0 | 1.5 | 900 | $1,395 | $1.55 | 23d | 1 | 1.37mi |
| 1505 Goodyear Ave Unit 17 Lakeland, FL | 2.0 | 1.0 | 792 | $950 | $1.20 | 23d | 1 | 1.41mi |
Listing history 8 events
-
2026-05-23status Pending
-
2026-04-29$119,000 Active
-
2007-05-11historical
-
2007-02-16historical
-
2007-02-14$55,000
-
2006-12-07$52,500
-
2006-08-16$52,500
-
1974-05-01soldstatus $5,500
ⓘ Source: listings_history table (triggers on properties + properties_extension) + one-shot
backfill from property_details.listing_events for pre-trigger history.
Tax reassessment forecast FL · Resets to sale price
- Current annual tax
- $1,370 · $114/mo
- Projected year-2 tax
- $1,370 · $114/mo
- Expected delta
- $0/yr ($0/mo · 0.0%)
ⓘ Screening estimate from a state-policy table — verify with the county assessor before closing.
Climate risk First Street
- Flood 1/10 Low FEMA zone X (unshaded) · 0% chance over 30 yrs
- Wildfire 2/10 Low
- Heat 8/10 Severe 7 d/yr ≥108°F today · 23 d/yr by 30 yrs out
- Wind 9/10 Extreme 99% chance of damaging wind over 30 yrs
- Air quality 2/10 Low 1 unhealthy d/yr today · 2 by 30 yrs out
Nearby sold comps map
Loading sold comps map…
Walkable amenities ~0.75 mi
Loading nearby amenities…
Taxation est. · year 1
- Rental income
- $15,931
- − Mortgage interest
- −$6,666
- − Property taxes
- −$1,370
- − Insurance
- −$595
- − Repairs & maintenance
- −$1,274
- − Management
- −$1,274
- − Depreciation
- −$3,462
- Taxable income
- $1,289
- Est. tax owed @ 24.0%
- −$309
- After-tax cash flow
- $2,822/yr
For passive investors: Depreciation is non-cash, so a rental often shows a tax loss while cash-flowing — sheltering income. Rental losses are passive: they offset passive income freely, and up to $25,000/yr can offset ordinary (W-2) income if you actively participate and your MAGI is under $100k (phasing out to $0 by $150k); unused losses carry forward. On sale, claimed depreciation is recaptured at up to 25%, and gains may owe capital-gains tax (a 1031 exchange can defer both). Figures are a year-1 estimate at your 24.0% rate — not tax advice; consult a CPA.
Schools (NCES district)
- District
- Polk
- NCES district ID
- 1201590
- Math proficiency
- 39% ▼ -11.00%
- Reading proficiency
- 43% ▼ -4.00%
- Median HH income
- $43,979
- Composite
- 34.74/100
- National rank
- #5132
- State rank
- #62 of 73 in FL
Livability — Crystal Lake
- Score
- 66/100
- State rank
- #620
- US rank
- #12023
Category grades
Schools grade is shown separately in the Schools card above.
Census & demographics
- Census place
- Crystal Lake, FL
- County
- Polk County · 740,051 people
- City population
- 33,460
- Metro
- Lakeland-Winter Haven, FL
- Population (ZIP)
- 35,394
- Household income
- $53,061
- Rent vs Own
- Severe rent burden
- 1291.0
Population outlook (Polk County) Hauer SSP2
- Today (2025)
- 752,975 people
- By 2030
- 804,621 · +6.9%
- By 2040
- 906,117 · +20.3%
- By 2050
- 1,000,476 · +32.9%
- By 2075
- 1,197,520 · +59.0%
- By 2100
- 1,271,518 · +68.9%
Race, ethnicity, and origin ACS 2023
- Neighborhood character
- Diverse neighborhood (Simpson 0.58)
- Race & ethnicity
- White 60% Hispanic / Latino 19% Black 16% Two or more races 8% Asian 1%
- Hispanic origin (detail)
- Mexican 5% Puerto Rican 8% Cuban 3%
- Common ancestry
- Romanian 2% Slovak 2% Lithuanian 1%
- Foreign-born
- 8% · Canada
- Languages at home
- 83% English-only · Spanish 14% French/Haitian/Cajun 1%
Political lean MEDSL · Polk
- 2024 margin
- Strong R (+20.7) · D 39.2% · R 59.9%
- 2008→2024 swing
- -14.6pp toward R · 2008: -6.1pp · 2024: -20.7pp
- All cycles
- 2024: R+20.7 2020: R+14.4 2016: R+14.1 2012: R+6.8 2008: R+6.1
Not yet ingested
- Civics
- —
Market trends
- HPI YoY
- ▼ -70.91%
- Current HPI
- 373.7159
- Rent YoY
- ▲ 1.05%
- Metro
- Lakeland-Winter Haven, FL
- State GDP YoY
- ▲ 3.28%
- F500 in state
- 36
Industry mix (Fortune 500 HQ in FL)
| Industry | F500 HQs | Revenue |
|---|---|---|
| Industrial Technology | 2 | $29B |
|
||
| Insurance | 2 | $17B |
|
||
| Retail | 1 | $60B |
|
||
| Technology Distribution | 1 | $58B |
|
||
| Homebuilding | 1 | $35B |
|
||
| Technology Manufacturing | 1 | $35B |
|
||
Price history
+2063.6% since first listed8 events — show timeline
- 2026-05-23 Pending — Stellar MLS as Distributed by MLS Grid
- 2026-04-29 Listed $119,000 Stellar MLS as Distributed by MLS Grid
- 2007-05-11 Listing Removed — Stellar MLS as Distributed by MLS Grid
- 2007-02-16 Listing Removed — Stellar MLS as Distributed by MLS Grid
- 2007-02-14 Listed $55,000 Stellar MLS as Distributed by MLS Grid
- 2006-12-07 Listed $52,500 Stellar MLS as Distributed by MLS Grid
- 2006-08-16 Listed $52,500 Stellar MLS as Distributed by MLS Grid
- 1974-05-01 Sold (Public Records) $5,500 Public Records
Property tax history
+15.0%/yrLatest (2025): $1,370 · +11.1% YoY. Source: county tax records.
Cash-flow waterfall
monthlySold comps — $/sqft
last 12 mo · ≤1 miLoading sold comps…