10 7117 Cr-59 · Lexington, OH
Flood risk No data
- FEMA flood zone
- —
- Chance of flooding over 30 yrs
- —
- Est. flood insurance / yr
- —
Fire risk No data
- Est. fire insurance / yr
- —
Heat risk No data
- Hot days now (above threshold)
- —
- Hot days in 30 yrs
- —
Wind risk No data
- Chance of severe wind over 30 yrs
- —
Air-quality risk No data
- Unhealthy air days now
- —
- Unhealthy air days in 30 yrs
- —
Risk factors via First Street. Map © Google.
Why this score? — see what drove the B grade
The composite is a weighted blend of 9 inputs, each scored 0–100. Each bar is that input's sub-score; the figure is the points it added to the 100-point composite (weight × sub-score).
- Cash flow +30.0/30.0
- 1% rule +10.0/10.0
- DSCR +10.0/10.0
- ARV discount +7.5/15.0
- Schools +4.9/10.0
- Livability +3.9/5.0
- Rent growth +2.5/5.0
- Condition / age +2.5/5.0
- Appreciation +0.0/10.0
$59,900
🖨 Deal sheet 📄 Offer letter ✓ Due diligence
Listing remarks
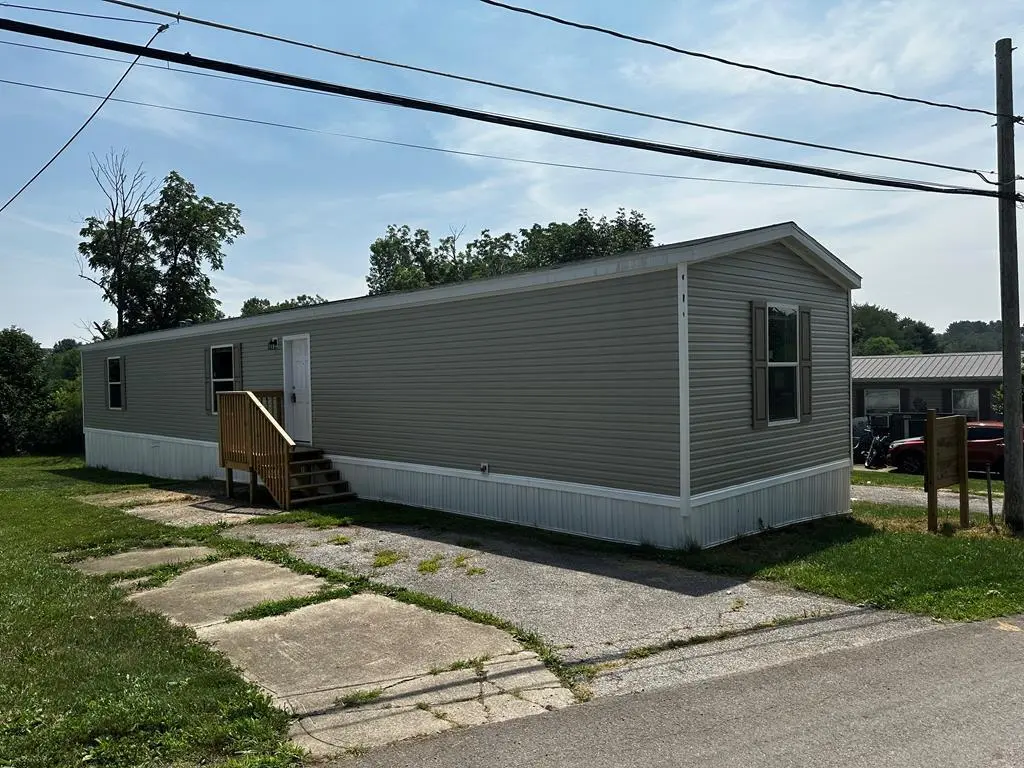
Step into this larger-than-average 2025 single-wide home, newly built and located in the desirable Northmor School District. This all-electric property is designed for easy living, featuring a simple AC hookup. The open-concept layout welcomes you with a bright living room that flows directly into a modern kitchen equipped with brand-new appliances and ample storage. Three bedrooms and two full bathrooms provide comfortable living space, while the primary suite offers a private bath and walk-in closet. Washer and dryer hookups add everyday convenience. With its expanded layout, modern finishes, and worry-free new construction, this home is ready for its first owner. Come see why this upgrad
Key facts
- Brand new appliances
- Simple ac hookup
- Modern kitchen
Tags
Property features AI
Exterior
- Parking: Asphalt parking
- Utilities: Shared well water; Public sewer
- Home design: Residential mobile home
- Construction: Vinyl siding
- Exterior features: Composition roof
Interior
- Bathrooms: 2 full bathrooms
- Interior features: Dishwasher; Refrigerator; Oven
Neighborhood map
What this means for you Summary
Snapshot
- This is a 3-bed/2.0-bath land listed at $60k.
Deal economics
- At list price, monthly cash flow is $973 ($12k/yr) — positive.
- The deal already cash-flows at list — no discount required.
- Meets the 1% rule at list price ($2k rent vs $60k).
- Recommended offer: $59k (1.5% below list) — sets the bar for market timing.
- Cap rate 25.8% vs local median 4.4% in Lexington — top-decile yield for the area; either an underpriced asset or a hidden risk that comps aren't pricing in. Stress-test before assuming the spread holds.
Location & tenants
- Location reads 77/100 on livability (#198 in OH, #3,037 nationally) — a middle-class / working-renter tenant base. Strengths: schools A+, cost of living A+, housing A+; Watch: amenities D-, commute F.
- Northmor Local (rural): math 54% / reading 60% proficiency, ranked #336 of 656 in OH (top 51%) — acceptable for families but not a draw, mixed tenant base, ~2y average lease.
- Market conditions: 62 active listings in the ZIP; 129 units permitted in Morrow County in 2024 (0 in 5+ unit buildings).
- This rent runs 34% of the median local income ($62k/yr) — at the standard rent-burdened threshold; future hikes will face affordability resistance.
Forward outlook
- Local home prices are declining (-3.0%/yr); year-one equity from $414 of loan paydown is wiped out by about $2k of value loss. Plan a longer hold.
- Morrow County population projected at -10% by 2050 — secular population decline; favor cash flow + early exit over multi-decade hold.
- At projected returns (-3.0% appreciation + 3.0% rent growth), your $17k cash investment doubles in ~2 years — after that, you're playing with house money.
Negotiation context
- It's been on market 27 days — a 2% lower offer ($59k) is reasonable based on typical stale-listing flexibility.
- 2 sale attempts with the ask held roughly flat each time — persistent listings suggest the price (not the market) is what's stuck; bring a comps-based counter.
Questions for the listing agent
- Is there a deadline driving the sale (1031 exchange, divorce, estate, relocation)? That informs how much negotiation room exists.
- Schools are A-rated — typically a magnet for longer-tenancy family renters. What's the average tenant stay here, and is there a school-zone premium baked into asking?
- What's the average days-on-market for RENTAL listings here right now (not sales)? A rising rental-DOM trend means longer vacancies and softer asking-rent achievability than the comps imply.
- What's the recent tenant-quality profile in this submarket — average credit score on applications, eviction rate, late-payment / NSF rate, and stable-employment percentage? A property-management company in the area should have these aggregated.
- How much new for-sale + rental construction is in the pipeline within 1–3 miles? Heavy new supply typically softens prices + rents 12–24 months out; constrained supply supports both.
Investment metrics
- 1% rule
- 2.93% ✓
- Cap rate
- 25.78%
- Cash-on-cash
- 69.58%
- DSCR
- 4.10
- GRM
- 2.8
CMA / ARV
No comps found within radius.
Projected returns pro-forma
-3.0% appreciation · 3.0% rent growth · sell at horizon
- IRR
- 69.1%
- Equity multiple
- 4.12×
- Total profit
- $52,262
- Equity at exit
- $8,931
- IRR
- 73.2%
- Equity multiple
- 8.48×
- Total profit
- $125,376
- Equity at exit
- $5,179
Cash invested: $16,772 (down + closing). Projections, not guarantees.
Landlord ↔ Tenant lean methodology
- Overall (STATE)
- 73 Landlord-Friendly
- State Ohio
- 73 Landlord-Friendly · R+6
- County
- — inherits STATE
- City
- — inherits STATE
ZIP-level market 44904
- Active inventory
- 62
- Price-to-rent
- 2.8×
Monthly cashflow live
- Estimated rent
- $1,755 medium interval (Pro) →
- Mortgage (P&I)
- −$314
- Tax est. 1.5%
- −$75 /mo · $898/yr
- Insurance
- −$25
- HOA
- −$0
- Vacancy / Maint / Mgmt
- −$369
- Net cashflow
- $973
Break-even live
UW: 25.0% down · 7.5% · 30yr · 1.5% tax · 5.0% vac · 8.0% maint · 8.0% mgmt
Financing live
Cash to close
- Down payment
- $14,975
- Closing costs
- $1,797
- Reserves months
- —
- Total cash needed
- —
Loan-product check · same deal, 3 products live
Conventional
25% down · 7.5% · 30yr
- Down + closing
- —
- Monthly P&I
- —
- Monthly cashflow
- —
- DSCR
- —
- Eligible?
- —
Personal DTI + credit; lowest rate.
DSCR
20% down · 8.5% · 30yr
- Down + closing
- —
- Monthly P&I
- —
- Monthly cashflow
- —
- DSCR
- —
- Eligible?
- —
No personal income docs; deal must DSCR.
Hard money
10% down · 12.0% · 12mo
- Down + closing
- —
- Monthly P&I
- —
- Monthly cashflow
- —
- DSCR
- —
- Eligible?
- —
Short-term bridge; refi at stabilization.
Listing history 23 events
-
2026-06-19days on market $59,900 Active 27 DOM
-
2026-06-18days on market $59,900 Active 26 DOM
-
2026-06-17days on market $59,900 Active 25 DOM
-
2026-06-16days on market $59,900 Active 24 DOM
-
2026-06-15days on market $59,900 Active 23 DOM
-
2026-06-14days on market $59,900 Active 21 DOM
-
2026-06-12days on market $59,900 Active 20 DOM
-
2026-06-09days on market $59,900 Active 17 DOM
-
2026-06-08days on market $59,900 Active 16 DOM
-
2026-06-07days on market $59,900 Active 15 DOM
-
2026-06-02days on market $59,900 Active 10 DOM
-
2026-06-01days on market $59,900 Active 9 DOM
-
2026-05-31days on market $59,900 Active 8 DOM
-
2026-05-30days on market $59,900 Active 7 DOM
-
2026-05-22$59,900 Active
-
2026-03-06price $64,800
-
2026-03-02price $64,900
-
2026-01-20price $65,300
-
2025-12-30price $65,800
-
2025-12-01price $66,300
-
2025-11-10$67,300 Active
-
2016-06-15soldstatus $225,000
-
2003-12-11soldstatus $725,000
ⓘ Source: listings_history table (triggers on properties + properties_extension) + one-shot
backfill from property_details.listing_events for pre-trigger history.
Nearby sold comps map
Loading sold comps map…
Walkable amenities ~0.75 mi
Loading nearby amenities…
Taxation est. · year 1
- Rental income
- $21,061
- − Mortgage interest
- −$3,355
- − Property taxes
- −$898
- − Insurance
- −$300
- − Repairs & maintenance
- −$1,685
- − Management
- −$1,685
- − Depreciation
- −$1,743
- Taxable income
- $11,395
- Est. tax owed @ 24.0%
- −$2,735
- After-tax cash flow
- $8,936/yr
For passive investors: Depreciation is non-cash, so a rental often shows a tax loss while cash-flowing — sheltering income. Rental losses are passive: they offset passive income freely, and up to $25,000/yr can offset ordinary (W-2) income if you actively participate and your MAGI is under $100k (phasing out to $0 by $150k); unused losses carry forward. On sale, claimed depreciation is recaptured at up to 25%, and gains may owe capital-gains tax (a 1031 exchange can defer both). Figures are a year-1 estimate at your 24.0% rate — not tax advice; consult a CPA.
Schools (NCES district)
- District
- Northmor Local
- NCES district ID
- 3904881
- Math proficiency
- 54% ▼ -7.00%
- Reading proficiency
- 60% ▼ -3.00%
- Median HH income
- $49,371
- Composite
- 48.51/100
- National rank
- #2120
- State rank
- #336 of 656 in OH
Livability — Lexington
- Score
- 77/100
- State rank
- #198
- US rank
- #3037
Category grades
Schools grade is shown separately in the Schools card above.
Census & demographics
- County
- Richland County · 43,943 people
- City population
- 13,450
- Metro
- Mansfield, OH
- Population (ZIP)
- 13,450
- Household income
- $62,364
- Rent vs Own
- Severe rent burden
- 237.0
Population outlook (Morrow County) Hauer SSP2
- Today (2025)
- 35,607 people
- By 2030
- 35,482 · -0.4%
- By 2040
- 34,369 · -3.5%
- By 2050
- 32,038 · -10.0%
- By 2075
- 25,090 · -29.5%
- By 2100
- 17,123 · -51.9%
Race, ethnicity, and origin ACS 2023
- Neighborhood character
- Predominantly White (96%)
- Race & ethnicity
- White 96% Two or more races 2% Hispanic / Latino 2%
- Common ancestry
- Lithuanian 4% Italian 3% Slovak 2%
- Foreign-born
- 3% · Canada
- Languages at home
- 96% English-only · Spanish 1% German/W. Germanic 1% French/Haitian/Cajun 1%
Political lean MEDSL · Morrow
- 2024 margin
- Solid R (+55.7) · D 21.7% · R 77.5%
- 2008→2024 swing
- -32.4pp toward R · 2008: -23.4pp · 2024: -55.7pp
- All cycles
- 2024: R+55.7 2020: R+54.3 2016: R+49.5 2012: R+24.6 2008: R+23.4
Not yet ingested
- Civics
- —
Market trends
- HPI YoY
- ▼ -130.61%
- Current HPI
- 203.175
- Rent YoY
- —
- Metro
- Mansfield, OH
- State GDP YoY
- ▲ 1.98%
- F500 in state
- 48
Industry mix (Fortune 500 HQ in OH)
| Industry | F500 HQs | Revenue |
|---|---|---|
| Insurance | 3 | $145B |
|
||
| Industrial Machinery | 3 | $49B |
|
||
| Financial Services | 3 | $24B |
|
||
| Consumer Goods | 2 | $93B |
|
||
| Aerospace / Defense | 2 | $47B |
|
||
| Utilities | 2 | $33B |
|
||
Price history
-91.7% since first listed9 events — show timeline
- 2026-05-22 Listed $59,900 MARMLS
- 2026-03-06 Price Changed $64,800 MARMLS
- 2026-03-02 Price Changed $64,900 MARMLS
- 2026-01-20 Price Changed $65,300 MARMLS
- 2025-12-30 Price Changed $65,800 MARMLS
- 2025-12-01 Price Changed $66,300 MARMLS
- 2025-11-10 Listed $67,300 MARMLS
- 2016-06-15 Sold (Public Records) $225,000 Public Records
- 2003-12-11 Sold (Public Records) $725,000 Public Records
Property tax history
+4.3%/yrLatest (2025): $3,849 · -7.6% YoY. Source: county tax records.
Cash-flow waterfall
monthlySold comps — $/sqft
last 12 mo · ≤1 miLoading sold comps…