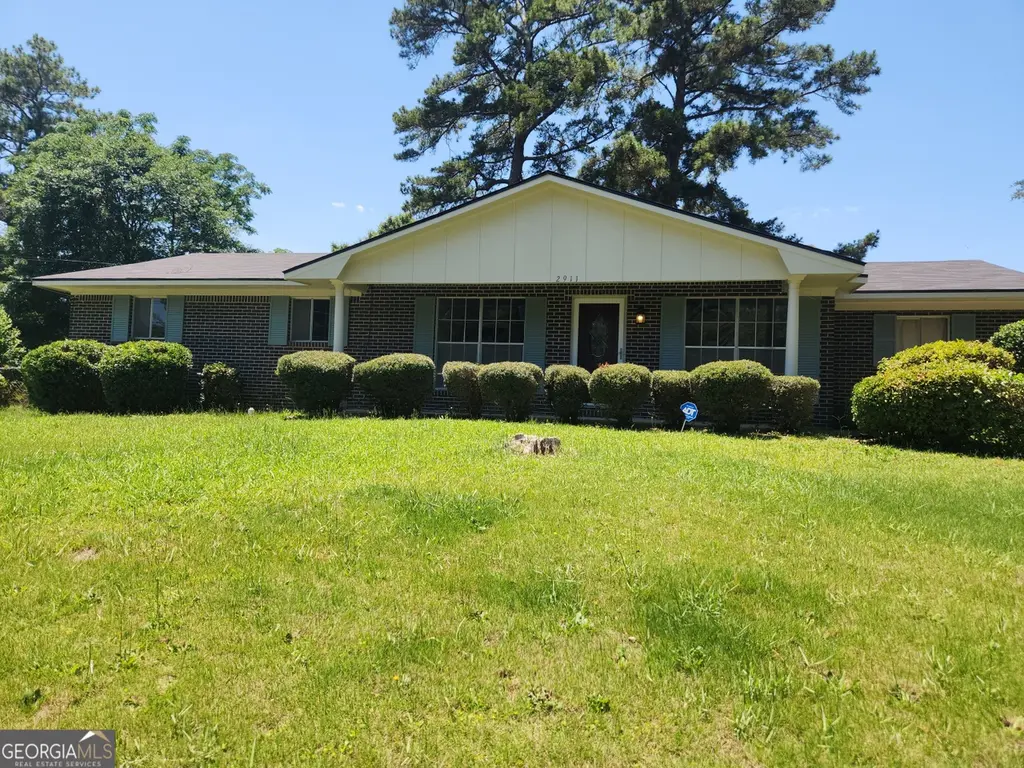
2911 Foresthill Dr · Columbus, GA
Flood risk 1/10 · Minimal
- FEMA flood zone
- X (unshaded)
- Chance of flooding over 30 yrs
- 0.0%
- Est. flood insurance / yr
- $507 – $1,088
Fire risk 4/10 · Minor
- Est. fire insurance / yr
- $963 – $1,789
Heat risk 7/10 · Major
- Hot days now (above 107°F)
- 7 days/yr
- Hot days in 30 yrs
- 19 days/yr
Wind risk 6/10 · Moderate
- Chance of severe wind over 30 yrs
- 68.0%
Air-quality risk 4/10 · Minor
- Unhealthy air days now
- 5 days/yr
- Unhealthy air days in 30 yrs
- 6 days/yr
Risk factors via First Street. Map © Google.
Why this score? — see what drove the C+ grade
The composite is a weighted blend of 9 inputs, each scored 0–100. Each bar is that input's sub-score; the figure is the points it added to the 100-point composite (weight × sub-score).
- Cash flow +24.7/30.0
- ARV discount +13.7/15.0
- DSCR +8.0/10.0
- 1% rule +5.2/10.0
- Rent growth +3.7/5.0
- Livability +3.2/5.0
- Condition / age +2.5/5.0
- Schools +2.2/10.0
- Appreciation +0.0/10.0
$150,000
🖨 Deal sheet 📄 Offer letter ✓ Due diligence
Listing remarks
Welcome to this charming 3-bedroom, 2-bathroom brick ranch home located in the established Forest Hills neighborhood! Situated on a spacious corner lot, this brick home offers a functional floor plan perfect for everyday living and entertaining. Enjoy the convenience of a single-story layout with easy flow throughout. Key Features Include: Solid brick exterior with durable construction; Large lot with plenty of outdoor space for gardening, play, or future expansion; Attached carport for convenient parking and storage; Central heating and air conditioning. Concrete slab foundation. Whether you're a first-time homebuyer, looking for a solid investment property, or searching for a home with ro
Key facts
- Attached carport
- Large lot
- Brick ranch home
Tags
Property features AI
Finance
- HOA & community: No homeowners association
Exterior
- Parking: Attached carport with side/rear entrance
- Utilities: Public water; Public sewer (connected); Electricity available; Natural gas available; High speed internet available; Cable available; Phone available
- Home design: Single family residence; House; Resale property
- Construction: Built in 1968; Brick exterior; Composition roof
- Exterior features: Corner lot; Street lights in the community
Interior
- Kitchen: Refrigerator included
- Bedrooms: Three bedrooms (all on the main level)
- Flooring: Carpet; Laminate
- Bathrooms: Two full bathrooms (main level)
- Heating & cooling: Central heating; Central air conditioning
- Interior features: One-level living; Bonus room; Family room; Mud room / laundry area; No basement
- Laundry & utility: Mud room laundry area
Neighborhood map
What this means for you Summary
Snapshot
- This is a 3-bed/2.0-bath single-family listed at $150k.
Deal economics
- At list price, monthly cash flow is $312 ($4k/yr) — positive.
- The deal already cash-flows at list — no discount required.
- Meets the 1% rule at list price ($2k rent vs $150k).
- Cap rate 8.8% vs local median 4.7% in Columbus — top-decile yield for the area; either an underpriced asset or a hidden risk that comps aren't pricing in. Stress-test before assuming the spread holds.
Location & tenants
- Location reads 64/100 on livability (#254 in GA) — a middle-class / working-renter tenant base. Strengths: cost of living A+, housing A+, health & safety B; Watch: amenities D+, crime F, commute F.
- Muscogee County (urban): math 21% / reading 30% proficiency, ranked #120 of 174 in GA (top 69%) — low school quality limits family demand, transient renter base, plan for 1-2y turnover; 61% free/reduced lunch — lower-income household profile, screen leases tightly.
- Zoned schools: Forrest Road Elementary School (math 8% / reading 8%, grade F, #1,125 of 1,228 statewide, top 93%, 404 students, 96% FRL); Fort Middle School (math 11% / reading 22%, grade F, #388 of 470 statewide, top 83%, 511 students, 97% FRL); Kendrick High School (math 2% / reading 5%, grade F, #413 of 424 statewide, top 99%, 876 students, 97% FRL) — zoned schools average 97% FRL vs 61% district-wide (36 pts higher); higher-poverty schools than district average — tighter screening recommended.
- Zoned-school proficiency averages 9% at this address vs 26% district-wide (-16 pts) — the specific schools serving this property underperform the Muscogee County average; the district grade overstates school quality for this exact location.
- Market conditions: Rents rising fast (+4.8%/yr); 256 active listings in the ZIP; 16 comparable units currently listed for rent nearby; rentals lingering (median 44d on market — plan ~5-8 weeks vacancy on turnover, expect pricing pressure); 50% of comp listings sitting > 30 days — soft ceiling on asking rent; 291 units permitted in Muscogee County in 2024 (30 in 5+ unit buildings).
- This rent runs 34% of the median local income ($54k/yr) — at the standard rent-burdened threshold; future hikes will face affordability resistance.
Forward outlook
- Local home prices are declining (-3.0%/yr); year-one equity from $1k of loan paydown is wiped out by about $4k of value loss. Plan a longer hold.
- Muscogee County population projected at +15% by 2050 — modest demand growth; plan on rents tracking national, not racing it.
- At projected returns (-3.0% appreciation + 4.8% rent growth), your $42k cash investment doubles in ~10 years — after that, you're playing with house money.
Negotiation context
- Only 4 days on market — expect competitive offers; lowballing is unlikely to land.
Risks & watch-outs
- Climate carrying-cost: major wind risk, 68% chance of damaging wind over 30y; extreme-heat days projected 7→19/yr by 2055 (HVAC capex compounding) — expect insurance premiums to compound above CPI over the hold.
Questions for the listing agent
- Built in 1968 — when were the roof, HVAC, electrical panel, plumbing, and water heater last replaced?
- Is there a deadline driving the sale (1031 exchange, divorce, estate, relocation)? That informs how much negotiation room exists.
- Schools are F-rated, which usually means shorter tenancies and higher turnover. Who's the typical renter profile here, and what's been the actual vacancy rate?
- Crime grade is F in this area — have there been break-ins, vandalism, or insurance claims at this property in the last 3 years? What carrier currently insures it and at what premium?
- What's the average days-on-market for RENTAL listings here right now (not sales)? A rising rental-DOM trend means longer vacancies and softer asking-rent achievability than the comps imply.
- What's the recent tenant-quality profile in this submarket — average credit score on applications, eviction rate, late-payment / NSF rate, and stable-employment percentage? A property-management company in the area should have these aggregated.
- How much new for-sale + rental construction is in the pipeline within 1–3 miles? Heavy new supply typically softens prices + rents 12–24 months out; constrained supply supports both.
Investment metrics
- 1% rule
- 1.02% ✓
- Cap rate
- 8.79%
- Cash-on-cash
- 8.92%
- DSCR
- 1.40
- GRM
- 8.2
CMA / ARV
- ARV (on-the-fly)
- $174,150
- Comps found
- 12
Show comp detail 12 sales within ~0.75 mi
| Address | Dist | Beds/Ba | Sqft | Sold | Price | $/sf | Match |
|---|---|---|---|---|---|---|---|
| 6788 Mitchell Dr | 0.32mi | 3/2.0 | 1,354 (+0%) | 1mo | $143,000 | $106 | 84 |
| 6340 Lemongrass Dr | 0.37mi | 3/2.0 | 1,410 (+4%) | 0mo | $240,730 | $171 | 75 |
| 3041 Waddell Dr | 0.08mi | 3/1.5 | 1,204 (-11%) | 3mo | $137,000 | $114 | 74 |
| 2735 Schatulga Rd | 0.41mi | 3/2.0 | 1,395 (+3%) | 2mo | $170,000 | $122 | 74 |
| 6636 Foxboro Dr | 0.24mi | 3/2.0 | 1,205 (-11%) | 0mo | $130,000 | $108 | 71 |
| 5646 Boby Dr | 0.48mi | 3/2.0 | 1,302 (-4%) | 3mo | $166,000 | $127 | 69 |
| 6085 Hunter Ridge Cir | 0.69mi | 3/2.0 | 1,358 (+1%) | 1mo | $194,000 | $143 | 66 |
| 6302 Morning Dew Dr | 0.58mi | 3/2.0 | 1,410 (+4%) | 2mo | $228,500 | $162 | 64 |
| 6303 Morning Dew Dr | 0.58mi | 3/2.0 | 1,472 (+9%) | 3mo | $239,160 | $162 | 56 |
| 6703 Aldora Dr | 0.54mi | 3/2.0 | 1,204 (-11%) | 2mo | $155,000 | $129 | 55 |
| 6946 Boby Ct | 0.49mi | 3/2.0 | 1,530 (+13%) | 2mo | $210,000 | $137 | 53 |
| 2143 Hunter Ct | 0.59mi | 3/2.0 | 1,181 (-12%) | 1mo | $141,650 | $120 | 51 |
Match score weights: distance 35% · size 25% · config 20% · recency 20%. Top-matched comps best support the ARV.
Projected returns pro-forma
-3.0% appreciation · 4.82% rent growth · sell at horizon
- IRR
- -1.0%
- Equity multiple
- 0.96×
- Total profit
- $-1,637
- Equity at exit
- $22,365
- IRR
- 10.3%
- Equity multiple
- 1.86×
- Total profit
- $36,075
- Equity at exit
- $12,969
Cash invested: $42,000 (down + closing). Projections, not guarantees.
Landlord ↔ Tenant lean methodology
- Overall (STATE)
- 90 Strongly Landlord-Friendly
- State Georgia
- 90 Strongly Landlord-Friendly · R+3
- County
- — inherits STATE
- City
- — inherits STATE
ZIP-level market 31907
- Rents YoY
- 4.8%
- Active inventory
- 256
- Price-to-rent
- 8.2×
Monthly cashflow live
- Estimated rent
- $1,531 high interval (Pro) →
- Mortgage (P&I)
- −$787
- Tax from tax record
- −$48 /mo · $580/yr
- Insurance
- −$62
- HOA
- −$0
- Vacancy / Maint / Mgmt
- −$322
- Net cashflow
- $312
Break-even live
UW: 25.0% down · 7.5% · 30yr · 1.5% tax · 5.0% vac · 8.0% maint · 8.0% mgmt
Financing live
Cash to close
- Down payment
- $37,500
- Closing costs
- $4,500
- Reserves months
- —
- Total cash needed
- —
Loan-product check · same deal, 3 products live
Conventional
25% down · 7.5% · 30yr
- Down + closing
- —
- Monthly P&I
- —
- Monthly cashflow
- —
- DSCR
- —
- Eligible?
- —
Personal DTI + credit; lowest rate.
DSCR
20% down · 8.5% · 30yr
- Down + closing
- —
- Monthly P&I
- —
- Monthly cashflow
- —
- DSCR
- —
- Eligible?
- —
No personal income docs; deal must DSCR.
Hard money
10% down · 12.0% · 12mo
- Down + closing
- —
- Monthly P&I
- —
- Monthly cashflow
- —
- DSCR
- —
- Eligible?
- —
Short-term bridge; refi at stabilization.
Rent comps 16 comps
| Address | Beds | Baths | Sqft | Rent | $/sqft | DOM | Units | Dist |
|---|---|---|---|---|---|---|---|---|
| 5009 Mint Dr Columbus, GA | 4.0 | 2.0 | 1502 | $1,750 | $1.17 | 21d | 1 | 0.37mi |
| 3420 Flintlock Dr Columbus, GA | 4.0 | 2.0 | 1538 | $1,750 | $1.14 | 21d | 1 | 0.38mi |
| 2011 Arrow Point Ln Columbus, GA | 4.0 | 2.0 | 1756 | $1,750 | $1.00 | 43d | 1 | 0.41mi |
| 3347 Flintlock Dr Columbus, GA | 3.0 | 2.0 | 1644 | $1,625 | $0.99 | 21d | 1 | 0.54mi |
| 6107 Crossbow Dr Columbus, GA | 4.0 | 2.0 | 1490 | $1,450 | $0.97 | 21d | 1 | 0.54mi |
| 6914 Aldora Dr Columbus, GA | 3.0 | 2.0 | 1345 | $1,545 | $1.15 | 43d | 1 | 0.60mi |
| 6025 Harvest Dr Columbus, GA | 3.0 | 2.0 | 1301 | $1,500 | $1.15 | 43d | 1 | 0.66mi |
| 3034 Lansing Ave Columbus, GA | 3.0 | 2.0 | 1447 | $1,500 | $1.04 | 43d | 1 | 0.78mi |
| 2939 Urban Ave Columbus, GA | 3.0 | 1.0 | 1145 | $1,050 | $0.92 | 21d | 1 | 0.92mi |
| 7005 Hunter Hill Ct Columbus, GA | 4.0 | 2.0 | 1636 | $1,800 | $1.10 | 13d | 1 | 0.96mi |
| 3227 Urban Ave Columbus, GA | 3.0 | 1.0 | 1332 | $975 | $0.73 | 21d | 1 | 0.99mi |
| 6044 Cordova Rd Columbus, GA | 4.0 | 2.0 | 1381 | $1,700 | $1.23 | 43d | 1 | 1.13mi |
| 1417 Celeste Dr Columbus, GA | 4.0 | 2.0 | 1443 | $1,500 | $1.04 | 43d | 1 | 1.19mi |
| 5530 Hunter Rd Columbus, GA | 3.0 | 2.0 | 1092 | $1,300 | $1.19 | 43d | 1 | 1.34mi |
| 5850 Blueridge Dr Columbus, GA | 3.0 | 1.5 | 1120 | $1,200 | $1.07 | 43d | 1 | 1.36mi |
| 5421 Susan Ln Columbus, GA | 3.0 | 1.0 | 1368 | $1,100 | $0.80 | 21d | 1 | 1.37mi |
Listing history 4 events
-
2026-06-14statusdays on market $150,000 Under Contract 4 DOM
-
2026-06-13days on market $150,000 New 3 DOM
-
2026-06-10remarks 699-char remark
-
2026-06-10$150,000 New 1 DOM
ⓘ Source: listings_history table (triggers on properties + properties_extension) + one-shot
backfill from property_details.listing_events for pre-trigger history.
Tax reassessment forecast GA · Resets to sale price
- Current annual tax
- $580 · $48/mo
- Projected year-2 tax
- $1,380 · $115/mo
- Expected delta
- +$800/yr (+$67/mo · 137.9%)
ⓘ Screening estimate from a state-policy table — verify with the county assessor before closing.
Climate risk First Street
- Flood 1/10 Low FEMA zone X (unshaded) · 0% chance over 30 yrs
- Wildfire 4/10 Moderate
- Heat 7/10 Severe 7 d/yr ≥107°F today · 19 d/yr by 30 yrs out
- Wind 6/10 Major 68% chance of damaging wind over 30 yrs
- Air quality 4/10 Moderate 5 unhealthy d/yr today · 6 by 30 yrs out
Nearby sold comps map
Loading sold comps map…
Walkable amenities ~0.75 mi
Loading nearby amenities…
Taxation est. · year 1
- Rental income
- $18,373
- − Mortgage interest
- −$8,402
- − Property taxes
- −$580
- − Insurance
- −$750
- − Repairs & maintenance
- −$1,470
- − Management
- −$1,470
- − Depreciation
- −$4,364
- Taxable income
- $1,337
- Est. tax owed @ 24.0%
- −$321
- After-tax cash flow
- $3,424/yr
For passive investors: Depreciation is non-cash, so a rental often shows a tax loss while cash-flowing — sheltering income. Rental losses are passive: they offset passive income freely, and up to $25,000/yr can offset ordinary (W-2) income if you actively participate and your MAGI is under $100k (phasing out to $0 by $150k); unused losses carry forward. On sale, claimed depreciation is recaptured at up to 25%, and gains may owe capital-gains tax (a 1031 exchange can defer both). Figures are a year-1 estimate at your 24.0% rate — not tax advice; consult a CPA.
Schools (NCES district)
- District
- Muscogee County
- NCES district ID
- 1303870
- Math proficiency
- 21% ▼ -11.00%
- Reading proficiency
- 30% ▼ -7.00%
- Median HH income
- $41,176
- Composite
- 21.6/100
- National rank
- #8297
- State rank
- #120 of 174 in GA
Livability — Columbus
- Score
- 64/100
- State rank
- #254
- US rank
- #14102
Category grades
Schools grade is shown separately in the Schools card above.
Census & demographics
- Census place
- Columbus, GA
- County
- Muscogee County · 180,764 people
- City population
- 180,764
- Metro
- Columbus, GA-AL
- Population (ZIP)
- 59,110
- Household income
- $54,453
- Rent vs Own
- Severe rent burden
- 2138.0
Population outlook (Muscogee County) Hauer SSP2
- Today (2025)
- 216,729 people
- By 2030
- 224,504 · +3.6%
- By 2040
- 238,318 · +10.0%
- By 2050
- 249,027 · +14.9%
- By 2075
- 264,862 · +22.2%
- By 2100
- 254,786 · +17.6%
Race, ethnicity, and origin ACS 2023
- Neighborhood character
- Majority Black (64%)
- Race & ethnicity
- Black 64% White 22% Two or more races 8% Hispanic / Latino 6% Asian 1%
- Hispanic origin (detail)
- Mexican 2% Puerto Rican 2%
- Common ancestry
- Italian 1% Slovak 1%
- Foreign-born
- 4% · Canada, South Korea
- Languages at home
- 95% English-only · Spanish 3%
Political lean MEDSL · Muscogee
- 2024 margin
- Strong D (+23.4) · D 61.4% · R 38.0%
- 2008→2024 swing
- +3.7pp toward D · 2008: 19.7pp · 2024: 23.4pp
- All cycles
- 2024: D+23.4 2020: D+24.0 2016: D+18.6 2012: D+21.3 2008: D+19.7
Not yet ingested
- Civics
- —
Market trends
- HPI YoY
- ▼ -125.88%
- Current HPI
- 151.74
- Rent YoY
- ▲ 4.82%
- Metro
- Columbus, GA-AL
- State GDP YoY
- ▲ 2.66%
- F500 in state
- 28
Industry mix (Fortune 500 HQ in GA)
| Industry | F500 HQs | Revenue |
|---|---|---|
| Paper / Packaging | 2 | $29B |
|
||
| Retail | 1 | $160B |
|
||
| Transportation / Logistics | 1 | $91B |
|
||
| Airlines | 1 | $62B |
|
||
| Consumer Goods | 1 | $47B |
|
||
| Utilities | 1 | $25B |
|
||
Price history
1 event — show timeline
- 2026-06-09 Listed $150,000 GAMLS
Property tax history
-0.5%/yrLatest (2025): $580 · -0.7% YoY. Source: county tax records.
Cash-flow waterfall
monthlySold comps — $/sqft
last 12 mo · ≤1 miLoading sold comps…