10523 Berry Branch Ln · Bryan, TX
Flood risk No data
- FEMA flood zone
- —
- Chance of flooding over 30 yrs
- —
- Est. flood insurance / yr
- —
Fire risk No data
- Est. fire insurance / yr
- —
Heat risk No data
- Hot days now (above threshold)
- —
- Hot days in 30 yrs
- —
Wind risk No data
- Chance of severe wind over 30 yrs
- —
Air-quality risk No data
- Unhealthy air days now
- —
- Unhealthy air days in 30 yrs
- —
Risk factors via First Street. Map © Google.
Why this score? — see what drove the C+ grade
The composite is a weighted blend of 9 inputs, each scored 0–100. Each bar is that input's sub-score; the figure is the points it added to the 100-point composite (weight × sub-score).
- Cash flow +24.8/30.0
- ARV discount +11.9/15.0
- DSCR +8.0/10.0
- 1% rule +6.4/10.0
- Condition / age +4.0/5.0
- Livability +3.8/5.0
- Rent growth +3.3/5.0
- Schools +2.6/10.0
- Appreciation +0.0/10.0
$237,900
🖨 Deal sheet 📄 Offer letter ✓ Due diligence
Listing remarks
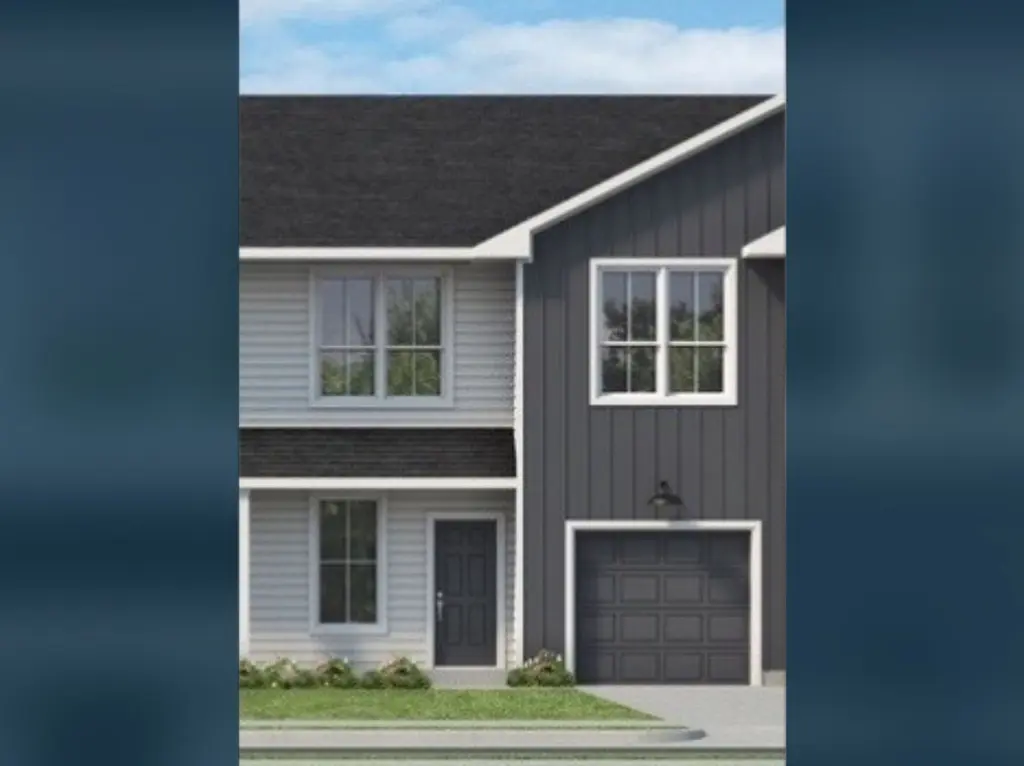
Some images shown may be from a previously built Stylecraft home of similar design. Actual options, colors, and selections may vary. Contact us for details! This two-story townhome offers a smart, efficient layout beginning with an open living room that welcomes you upon entry. To the left, a one-car garage connects to a small hallway that includes a convenient powder room. Beyond the living space is a galley-style kitchen featuring a walk-in pantry, with the staircase to the second floor located nearby. A back door sits just off the kitchen for easy outdoor access. Upstairs, you'll find three bedrooms, two full bathrooms, and a utility closet, all designed for everyday convenience. Each be
Key facts
- Open living room
- Utility closet
- Walk in closet
Tags
Property features AI
Finance
- Financial info: List price $235,900
Exterior
- Parking: 1-car garage; 1 total parking space
- Home design: Single-family property; Active listing
- Exterior features: Living area approximately 1,346
Interior
- Bedrooms: 3 bedrooms
- Bathrooms: 2 full bathrooms and 1 half bathroom
- Interior features: Spec-built home (The 1340 plan)
Neighborhood map
What this means for you Summary
Snapshot
- This is a 3-bed/2.5-bath single-family listed at $238k. Condition is rated good.
Deal economics
- At list price, monthly cash flow is $502 ($6k/yr) — positive.
- The deal already cash-flows at list — no discount required.
- Meets the 1% rule at list price ($3k rent vs $238k).
- Recommended offer: $234k (1.5% below list) — sets the bar for market timing.
- Cap rate 8.8% vs local median 4.0% in Bryan — top-decile yield for the area; either an underpriced asset or a hidden risk that comps aren't pricing in. Stress-test before assuming the spread holds.
Location & tenants
- Location reads 76/100 on livability (#99 in TX, #3,341 nationally) — a middle-class / working-renter tenant base. Strengths: cost of living A+, housing A+, health & safety A+; Watch: schools C-, crime C-, amenities C-.
- Bryan ISD (urban): math 30% / reading 32% proficiency, ranked #608 of 826 in TX (top 74%) — families likely to look elsewhere, expect single-tenant / working-renter base with shorter leases; 68% free/reduced lunch — lower-income household profile, screen leases tightly.
- Market conditions: Rents rising (+3.1%/yr); 1168 active listings in the ZIP; 4 comparable units currently listed for rent nearby; rentals at typical pace (median 21d on market — plan ~3-4 weeks tenant-placement turnaround); solid renter incomes; 2,211 units permitted in Brazos County in 2024 (768 in 5+ unit buildings).
- This rent runs 37% of the median local income ($89k/yr) — at the standard rent-burdened threshold; future hikes will face affordability resistance.
Forward outlook
- Local home prices are declining (-3.0%/yr); year-one equity from $2k of loan paydown is wiped out by about $7k of value loss. Plan a longer hold.
- Brazos County population projected at +55% by 2050 — long-run rental-demand tailwind backs the buy-and-hold thesis.
Negotiation context
- It's been on market 27 days — a 2% lower offer ($234k) is reasonable based on typical stale-listing flexibility.
Questions for the listing agent
- Is there a deadline driving the sale (1031 exchange, divorce, estate, relocation)? That informs how much negotiation room exists.
- What's the average days-on-market for RENTAL listings here right now (not sales)? A rising rental-DOM trend means longer vacancies and softer asking-rent achievability than the comps imply.
- What's the recent tenant-quality profile in this submarket — average credit score on applications, eviction rate, late-payment / NSF rate, and stable-employment percentage? A property-management company in the area should have these aggregated.
- How much new for-sale + rental construction is in the pipeline within 1–3 miles? Heavy new supply typically softens prices + rents 12–24 months out; constrained supply supports both.
Investment metrics
- 1% rule
- 1.14% ✓
- Cap rate
- 8.82%
- Cash-on-cash
- 9.04%
- DSCR
- 1.40
- GRM
- 7.3
CMA / ARV
- ARV (on-the-fly)
- $263,816
- Comps found
- 12
Show comp detail 12 sales within ~0.75 mi
| Address | Dist | Beds/Ba | Sqft | Sold | Price | $/sf | Match |
|---|---|---|---|---|---|---|---|
| 10650 Knox Landing Dr | 0.44mi | 3/2.0 | 1,415 (+5%) | 1mo | $268,895 | $190 | 68 |
| 10700 Blocker Ct | 0.30mi | 3/2.0 | 1,446 (+7%) | 10mo | $279,900 | $194 | 64 |
| 10709 Blocker Ct | 0.35mi | 3/2.0 | 1,446 (+7%) | 9mo | $302,900 | $209 | 62 |
| 4533 Wisenbaker Way | 0.52mi | 3/2.0 | 1,446 (+7%) | 2mo | $289,900 | $200 | 60 |
| 4499 Wisenbaker Way | 0.45mi | 3/2.0 | 1,446 (+7%) | 8mo | $274,900 | $190 | 58 |
| 4525 Wisenbaker Way | 0.52mi | 3/2.0 | 1,446 (+7%) | 5mo | $274,900 | $190 | 58 |
| 10717 Blocker Ct | 0.38mi | 3/2.0 | 1,508 (+12%) | 7mo | $298,900 | $198 | 54 |
| 4521 Wisenbaker Way | 0.52mi | 3/2.0 | 1,508 (+12%) | 3mo | $289,900 | $192 | 52 |
| 4513 Wisenbaker Way | 0.51mi | 3/2.0 | 1,446 (+7%) | 13mo | $290,900 | $201 | 51 |
| 4527 Wisenbaker Way | 0.52mi | 3/2.0 | 1,508 (+12%) | 3mo | $289,900 | $192 | 51 |
| 4509 Wisenbaker Way | 0.49mi | 3/2.0 | 1,508 (+12%) | 13mo | $299,900 | $199 | 44 |
| 4517 Wisenbaker Way | 0.52mi | 3/2.0 | 1,508 (+12%) | 13mo | $294,900 | $196 | 43 |
Match score weights: distance 35% · size 25% · config 20% · recency 20%. Top-matched comps best support the ARV.
Projected returns pro-forma
-3.0% appreciation · 3.13% rent growth · sell at horizon
- IRR
- -2.5%
- Equity multiple
- 0.91×
- Total profit
- $-6,209
- Equity at exit
- $35,472
- IRR
- 7.4%
- Equity multiple
- 1.56×
- Total profit
- $37,357
- Equity at exit
- $20,569
Cash invested: $66,612 (down + closing). Projections, not guarantees.
Landlord ↔ Tenant lean methodology
- Overall (STATE)
- 87 Strongly Landlord-Friendly
- State Texas
- 87 Strongly Landlord-Friendly · R+5
- County
- — inherits STATE
- City
- — inherits STATE
ZIP-level market 77845
- Rents YoY
- 3.1%
- Active inventory
- 1168
- Price-to-rent
- 7.3×
Monthly cashflow live
- Estimated rent
- $2,716 medium interval (Pro) →
- Mortgage (P&I)
- −$1,248
- Tax est. 1.5%
- −$297 /mo · $3,568/yr
- Insurance
- −$99
- HOA
- −$0
- Vacancy / Maint / Mgmt
- −$570
- Net cashflow
- $502
Break-even live
UW: 25.0% down · 7.5% · 30yr · 1.5% tax · 5.0% vac · 8.0% maint · 8.0% mgmt
Financing live
Cash to close
- Down payment
- $59,475
- Closing costs
- $7,137
- Reserves months
- —
- Total cash needed
- —
Loan-product check · same deal, 3 products live
Conventional
25% down · 7.5% · 30yr
- Down + closing
- —
- Monthly P&I
- —
- Monthly cashflow
- —
- DSCR
- —
- Eligible?
- —
Personal DTI + credit; lowest rate.
DSCR
20% down · 8.5% · 30yr
- Down + closing
- —
- Monthly P&I
- —
- Monthly cashflow
- —
- DSCR
- —
- Eligible?
- —
No personal income docs; deal must DSCR.
Hard money
10% down · 12.0% · 12mo
- Down + closing
- —
- Monthly P&I
- —
- Monthly cashflow
- —
- DSCR
- —
- Eligible?
- —
Short-term bridge; refi at stabilization.
Rent comps 4 comps
| Address | Beds | Baths | Sqft | Rent | $/sqft | DOM | Units | Dist |
|---|---|---|---|---|---|---|---|---|
| 1720 Summit Crossing Ln College Station, TX | 1.0–3.0 | 1.0–2.0 | 983 | $2,205 | $2.24 | 13d | 46 | 1.15mi |
| 1762 Dakota Ln Unit 1328094P College Station, TX | 3.0 | 3.0 | 1506 | $2,852 | $1.89 | 21d | 1 | 1.39mi |
| 1761 Dakota Ln College Station, TX | 3.0 | 2.5 | 1598 | $2,250 | $1.41 | 21d | 1 | 1.41mi |
| 3819 Black Hawk Ln Unit 1328095P College Station, TX | 2.0 | 2.0 | 1162 | $4,264 | $3.67 | 13d | 1 | 1.46mi |
Listing history 15 events
-
2026-06-18days on market $237,900 Active 27 DOM
-
2026-06-17days on market $237,900 Active 26 DOM
-
2026-06-16days on market $237,900 Active 25 DOM
-
2026-06-15days on market $237,900 Active 24 DOM
-
2026-06-14days on market $237,900 Active 22 DOM
-
2026-06-13days on market $237,900 Active 21 DOM
-
2026-06-10days on market $237,900 Active 19 DOM
-
2026-06-09days on market $237,900 Active 18 DOM
-
2026-06-08days on market $237,900 Active 17 DOM
-
2026-06-07days on market $237,900 Active 16 DOM
-
2026-06-03days on market $237,900 Active 12 DOM
-
2026-06-02days on market $237,900 Active 11 DOM
-
2026-06-01days on market $237,900 Active 10 DOM
-
2026-05-31days on market $237,900 Active 9 DOM
-
2026-05-30pricedays on market $237,900 Active 8 DOM
ⓘ Source: listings_history table (triggers on properties + properties_extension) + one-shot
backfill from property_details.listing_events for pre-trigger history.
Nearby sold comps map
Loading sold comps map…
Walkable amenities ~0.75 mi
Loading nearby amenities…
Taxation est. · year 1
- Rental income
- $32,592
- − Mortgage interest
- −$13,326
- − Property taxes
- −$3,568
- − Insurance
- −$1,190
- − Repairs & maintenance
- −$2,607
- − Management
- −$2,607
- − Depreciation
- −$6,921
- Taxable income
- $2,372
- Est. tax owed @ 24.0%
- −$569
- After-tax cash flow
- $5,449/yr
For passive investors: Depreciation is non-cash, so a rental often shows a tax loss while cash-flowing — sheltering income. Rental losses are passive: they offset passive income freely, and up to $25,000/yr can offset ordinary (W-2) income if you actively participate and your MAGI is under $100k (phasing out to $0 by $150k); unused losses carry forward. On sale, claimed depreciation is recaptured at up to 25%, and gains may owe capital-gains tax (a 1031 exchange can defer both). Figures are a year-1 estimate at your 24.0% rate — not tax advice; consult a CPA.
Condition & rehab AI · 2 photos
This two-story townhome is in good condition with a good exterior and interior. A fresh coat of paint and a new light fixture would significantly enhance its curb appeal and rental value.
Value-add opportunities
- Both Paint exterior — Enhances curb appeal and value
- Rental Replace light fixture — Improves aesthetics and functionality
Renovation cost estimate screening
Value-add ROI direction
- Both Paint exterior — Enhances curb appeal and value ↑
- Rental Replace light fixture — Improves aesthetics and functionality ↑
ⓘ Cost ranges are severity-bucket heuristics (US national rule-of-thumb). Get contractor quotes + a written scope before underwriting a rehab budget.
Schools (NCES district)
- District
- Bryan ISD
- NCES district ID
- 4811790
- Math proficiency
- 30% ▼ -8.00%
- Reading proficiency
- 32% ▼ -3.00%
- Median HH income
- $41,895
- Composite
- 26.26/100
- National rank
- #7253
- State rank
- #608 of 826 in TX
Livability — Bryan
- Score
- 76/100
- State rank
- #99
- US rank
- #3341
Category grades
Schools grade is shown separately in the Schools card above.
Census & demographics
- Census place
- Bryan, TX
- County
- Brazos County · 233,400 people
- City population
- 101,772
- Metro
- College Station-Bryan, TX
- Population (ZIP)
- 76,764
- Household income
- $88,851
- Rent vs Own
- Severe rent burden
- 3329.0
Population outlook (Brazos County) Hauer SSP2
- Today (2025)
- 267,942 people
- By 2030
- 296,630 · +10.7%
- By 2040
- 354,560 · +32.3%
- By 2050
- 414,616 · +54.7%
- By 2075
- 562,158 · +109.8%
- By 2100
- 678,828 · +153.3%
Race, ethnicity, and origin ACS 2023
- Neighborhood character
- Predominantly White (69%)
- Race & ethnicity
- White 69% Hispanic / Latino 16% Two or more races 9% Asian 8% Black 5%
- Hispanic origin (detail)
- Mexican 12%
- Common ancestry
- Lithuanian 2% Romanian 2% Italian 2%
- Foreign-born
- 11% · Canada, China, South Korea
- Languages at home
- 83% English-only · Spanish 8% Other Indo-European 3% Chinese 2%
Political lean MEDSL · Brazos
- 2024 margin
- Strong R (+24.9) · D 36.9% · R 61.7% · Other 1.4%
- 2008→2024 swing
- +4.1pp toward D · 2008: -28.9pp · 2024: -24.9pp
- All cycles
- 2024: R+24.9 2020: R+14.3 2016: R+23.7 2012: R+35.3 2008: R+28.9
Not yet ingested
- Civics
- —
Market trends
- HPI YoY
- ▼ -133.31%
- Current HPI
- 175.9669
- Rent YoY
- ▲ 3.13%
- Metro
- College Station-Bryan, TX
- State GDP YoY
- ▲ 3.95%
- F500 in state
- 110
Industry mix (Fortune 500 HQ in TX)
| Industry | F500 HQs | Revenue |
|---|---|---|
| Energy | 16 | $1,198B |
|
||
| Technology | 5 | $198B |
|
||
| Engineering / Construction | 4 | $72B |
|
||
| Energy Services | 3 | $60B |
|
||
| Utilities | 3 | $41B |
|
||
| Healthcare | 2 | $330B |
|
||
Cash-flow waterfall
monthlySold comps — $/sqft
last 12 mo · ≤1 miLoading sold comps…