80422 Baseline · Twentynine Palms, CA
Flood risk 1/10 · Minimal
- FEMA flood zone
- D
- Chance of flooding over 30 yrs
- 0.0%
- Est. flood insurance / yr
- $544 – $1,084
Fire risk 1/10 · Minimal
- Est. fire insurance / yr
- $659 – $1,223
Heat risk 8/10 · Major
- Hot days now (above 109°F)
- 6 days/yr
- Hot days in 30 yrs
- 17 days/yr
Wind risk 1/10 · Minimal
- Chance of severe wind over 30 yrs
- —
Air-quality risk 4/10 · Minor
- Unhealthy air days now
- 4 days/yr
- Unhealthy air days in 30 yrs
- 6 days/yr
Risk factors via First Street. Map © Google.
Why this score? — see what drove the C- grade
The composite is a weighted blend of 9 inputs, each scored 0–100. Each bar is that input's sub-score; the figure is the points it added to the 100-point composite (weight × sub-score).
- Cash flow +16.2/30.0
- ARV discount +15.0/15.0
- DSCR +5.0/10.0
- Rent growth +3.6/5.0
- 1% rule +3.3/10.0
- Livability +3.0/5.0
- Condition / age +2.5/5.0
- Schools +2.2/10.0
- Appreciation +0.0/10.0
$175,000
🖨 Deal sheet 📄 Offer letter ✓ Due diligence
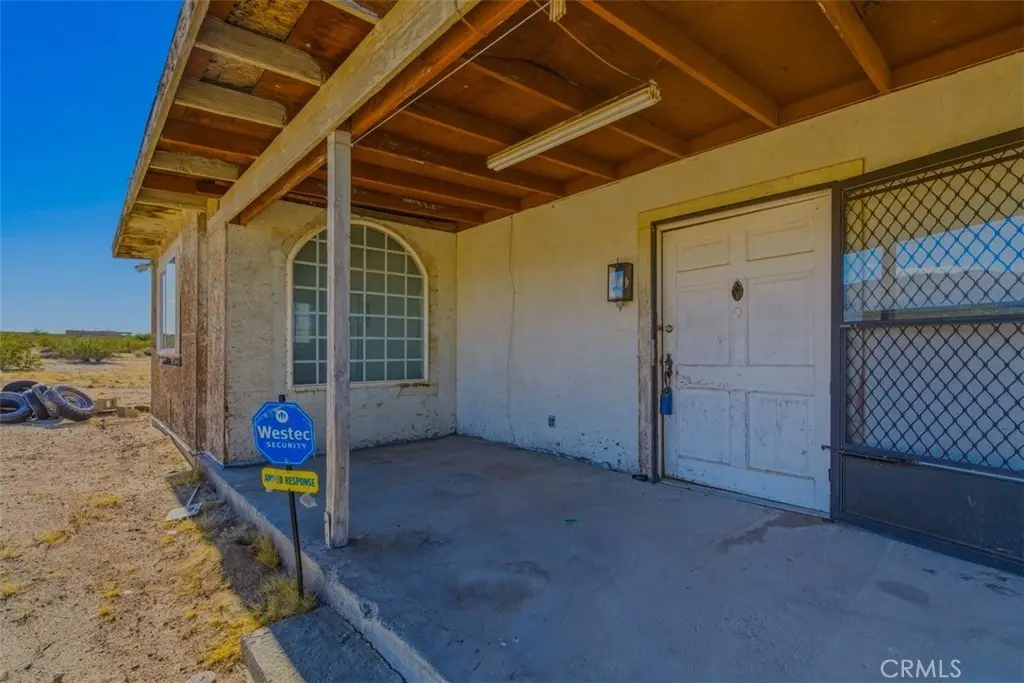
Listing remarks
Endless potential awaits with this unique two parcel property offering space, privacy and incredible desert charm. The first parcel features a home with a spacious, well designed floor plan ready for a full renovation. Also included is a small building that appears to be a old "rec cabin. " The second parcel includes an additional structure in need of complete rehabilitation, presenting even more opportunity for expansion, income potential or creative use. All 3 of the buildings are currently uninhabitable. Both parcels are equipped with power, making the redevelopment process that much more accessible. Enjoy unmatched peace and quiet with government land bordering the South side
Key facts
- Two parcel property
- Additional structure
- 5 acre lot
Tags
Property features AI
Finance
- Other: Directions: East on Hwy 62, right on Fi Lox See, follow the road to the right, make first left and go up to house.
- HOA & community: Rural community with horse trails and biking
Exterior
- Parking: Attached garage (1 car); Driveway (unpaved), 1 parking space
- Utilities: Electricity available; Agricultural well for water; No sewer/septic
- Home design: Single-story house; No accessory dwelling unit
- Construction: Property listed as fixer condition; Year built source: other; No common walls
- Exterior features: Covered front porch and patio; Patio; No fencing; Has view; 2–5 units per acre zoning/lot characteristic; Additional parcel on file
Interior
- Bedrooms: One bedroom (main level; all bedrooms up)
- Bathrooms: One full bathroom
- Heating & cooling: Has fireplace (in family room and bath)
- Interior features: Unfurnished; Front door entry; One level
- Laundry & utility: Washer hookup; Has laundry
Neighborhood map
What this means for you Summary
Snapshot
- This is a 2-bed/1.0-bath single-family listed at $175k.
Deal economics
- At list price, monthly cash flow is $92 ($1k/yr) — positive.
- The deal already cash-flows at list — no discount required.
- To meet the 1% rule (rent ≥ 1% of price), the offer needs to be $144k (17.5% below list).
- Recommended offer: $144k (17.5% below list) — sets the bar for 1% rule.
- Cap rate 6.9% vs local median 4.3% in Twentynine Palms — top-decile yield for the area; either an underpriced asset or a hidden risk that comps aren't pricing in. Stress-test before assuming the spread holds.
Location & tenants
- Location reads 59/100 on livability (#622 in CA) — a working-class tenant base; expect higher turnover. Strengths: commute A+, housing A+; Watch: schools D, amenities F, employment D-.
- Morongo Unified (town): math 15% / reading 38% proficiency, ranked #395 of 517 in CA (top 76%) — low school quality limits family demand, transient renter base, plan for 1-2y turnover.
- Market conditions: Rents rising fast (+4.5%/yr); 734 active listings in the ZIP; 1 comparable units currently listed for rent nearby; 5,458 units permitted in San Bernardino County in 2024 (1,500 in 5+ unit buildings).
Forward outlook
- Local home prices are declining (-3.0%/yr); year-one equity from $1k of loan paydown is wiped out by about $5k of value loss. Plan a longer hold.
- San Bernardino County population projected at +15% by 2050 — modest demand growth; plan on rents tracking national, not racing it.
Negotiation context
- It's been on market 41 days — a 3% lower offer ($170k) is reasonable based on typical stale-listing flexibility.
- 2 sale attempts with the ask held roughly flat each time — persistent listings suggest the price (not the market) is what's stuck; bring a comps-based counter.
Risks & watch-outs
- Climate carrying-cost: extreme-heat days projected 6→17/yr by 2055 (HVAC capex compounding) — expect insurance premiums to compound above CPI over the hold.
Questions for the listing agent
- It's been on market 41 days. Have you received any prior offers? Is the seller open to a 17% concession, seller financing, or rate buy-down credit?
- Built in 1971 — when were the roof, HVAC, electrical panel, plumbing, and water heater last replaced?
- Is there a deadline driving the sale (1031 exchange, divorce, estate, relocation)? That informs how much negotiation room exists.
- Schools are D-rated, which usually means shorter tenancies and higher turnover. Who's the typical renter profile here, and what's been the actual vacancy rate?
- What's the average days-on-market for RENTAL listings here right now (not sales)? A rising rental-DOM trend means longer vacancies and softer asking-rent achievability than the comps imply.
- What's the recent tenant-quality profile in this submarket — average credit score on applications, eviction rate, late-payment / NSF rate, and stable-employment percentage? A property-management company in the area should have these aggregated.
- How much new for-sale + rental construction is in the pipeline within 1–3 miles? Heavy new supply typically softens prices + rents 12–24 months out; constrained supply supports both.
Investment metrics
- 1% rule
- 0.83% ✗
- Cap rate
- 6.92%
- Cash-on-cash
- 2.25%
- DSCR
- 1.10
- GRM
- 10.1
CMA / ARV
- ARV (median comp)
- $232,606
- List price
- $175,000
- Delta
- -24.77%
- Verdict
- UNDERPRICED
- Comps
- 3 within 2.0 mi
Projected returns pro-forma
-3.0% appreciation · 4.45% rent growth · sell at horizon
- IRR
- -11.4%
- Equity multiple
- 0.58×
- Total profit
- $-20,435
- Equity at exit
- $26,093
- IRR
- -0.4%
- Equity multiple
- 0.97×
- Total profit
- $-1,524
- Equity at exit
- $15,131
Cash invested: $49,000 (down + closing). Projections, not guarantees.
Landlord ↔ Tenant lean methodology
- Overall (STATE)
- 18 Strongly Tenant-Friendly
- State California
- 18 Strongly Tenant-Friendly · D+13
- County
- — inherits STATE
- City
- — inherits STATE
ZIP-level market 92277
- Home prices YoY
- -3.1%
- Rents YoY
- 4.5%
- Active inventory
- 734
- Price-to-rent
- 10.1×
Monthly cashflow live
- Estimated rent
- $1,444 medium interval (Pro) →
- Mortgage (P&I)
- −$918
- Tax from tax record
- −$58 /mo · $699/yr
- Insurance
- −$73
- HOA
- −$0
- Vacancy / Maint / Mgmt
- −$303
- Net cashflow
- $92
Break-even live
UW: 25.0% down · 7.5% · 30yr · 1.5% tax · 5.0% vac · 8.0% maint · 8.0% mgmt
Financing live
Cash to close
- Down payment
- $43,750
- Closing costs
- $5,250
- Reserves months
- —
- Total cash needed
- —
Loan-product check · same deal, 3 products live
Conventional
25% down · 7.5% · 30yr
- Down + closing
- —
- Monthly P&I
- —
- Monthly cashflow
- —
- DSCR
- —
- Eligible?
- —
Personal DTI + credit; lowest rate.
DSCR
20% down · 8.5% · 30yr
- Down + closing
- —
- Monthly P&I
- —
- Monthly cashflow
- —
- DSCR
- —
- Eligible?
- —
No personal income docs; deal must DSCR.
Hard money
10% down · 12.0% · 12mo
- Down + closing
- —
- Monthly P&I
- —
- Monthly cashflow
- —
- DSCR
- —
- Eligible?
- —
Short-term bridge; refi at stabilization.
Rent comps 1 comps
| Address | Beds | Baths | Sqft | Rent | $/sqft | DOM | Units | Dist |
|---|---|---|---|---|---|---|---|---|
| 80260 Sandale Rd Twentynine Palms, CA | 1.0 | 1.0 | 744 | $1,700 | $2.28 | 1d | 1 | 1.04mi |
Listing history 17 events
-
2026-06-18days on market $175,000 Active 41 DOM
-
2026-06-17days on market $175,000 Active 40 DOM
-
2026-06-16days on market $175,000 Active 39 DOM
-
2026-06-15days on market $175,000 Active 38 DOM
-
2026-06-13days on market $175,000 Active 36 DOM
-
2026-06-13days on market $175,000 Active 35 DOM
-
2026-06-09days on market $175,000 Active 32 DOM
-
2026-06-08days on market $175,000 Active 31 DOM
-
2026-06-07days on market $175,000 Active 30 DOM
-
2026-06-04days on market $175,000 Active 27 DOM
-
2026-06-03days on market $175,000 Active 26 DOM
-
2026-06-02days on market $175,000 Active 25 DOM
-
2026-06-01days on market $175,000 Active 24 DOM
-
2026-05-31days on market $175,000 Active 23 DOM
-
2026-05-08$175,000 Active 1615-char remark
-
2026-03-13historical
-
2025-09-11$225,000 Active
ⓘ Source: listings_history table (triggers on properties + properties_extension) + one-shot
backfill from property_details.listing_events for pre-trigger history.
Tax reassessment forecast CA · Resets to sale price
- Current annual tax
- $699 · $58/mo
- Projected year-2 tax
- $1,330 · $111/mo
- Expected delta
- +$631/yr (+$53/mo · 90.4%)
ⓘ Screening estimate from a state-policy table — verify with the county assessor before closing.
Climate risk First Street
- Flood 1/10 Low FEMA zone D · 0% chance over 30 yrs
- Wildfire 1/10 Low
- Heat 8/10 Severe 6 d/yr ≥109°F today · 17 d/yr by 30 yrs out
- Wind 1/10 Low
- Air quality 4/10 Moderate 4 unhealthy d/yr today · 6 by 30 yrs out
Nearby sold comps map
Loading sold comps map…
Walkable amenities ~0.75 mi
Loading nearby amenities…
Taxation est. · year 1
- Rental income
- $17,330
- − Mortgage interest
- −$9,803
- − Property taxes
- −$699
- − Insurance
- −$875
- − Repairs & maintenance
- −$1,386
- − Management
- −$1,386
- − Depreciation
- −$5,091
- Taxable loss
- −$1,910
- Est. tax savings @ 24.0%
- +$458
- After-tax cash flow
- $1,563/yr
For passive investors: Depreciation is non-cash, so a rental often shows a tax loss while cash-flowing — sheltering income. Rental losses are passive: they offset passive income freely, and up to $25,000/yr can offset ordinary (W-2) income if you actively participate and your MAGI is under $100k (phasing out to $0 by $150k); unused losses carry forward. On sale, claimed depreciation is recaptured at up to 25%, and gains may owe capital-gains tax (a 1031 exchange can defer both). Figures are a year-1 estimate at your 24.0% rate — not tax advice; consult a CPA.
Schools (NCES district)
- District
- Morongo Unified
- NCES district ID
- 0625860
- Math proficiency
- 15% ▼ -12.00%
- Reading proficiency
- 38% ▼ -3.00%
- Median HH income
- $39,399
- Composite
- 22.19/100
- National rank
- #8156
- State rank
- #395 of 517 in CA
Livability — Twentynine Palms
- Score
- 59/100
- State rank
- #622
- US rank
- #19731
Category grades
Schools grade is shown separately in the Schools card above.
Census & demographics
- County
- San Bernardino County · 2,030,291 people
- City population
- 26,277
- Metro
- Riverside-San Bernardino-Ontario, CA
- Population (ZIP)
- 26,277
- Household income
- $60,901
- Rent vs Own
- Severe rent burden
- 1057.0
Population outlook (San Bernardino County) Hauer SSP2
- Today (2025)
- 2,300,329 people
- By 2030
- 2,378,907 · +3.4%
- By 2040
- 2,523,137 · +9.7%
- By 2050
- 2,642,388 · +14.9%
- By 2075
- 2,880,769 · +25.2%
- By 2100
- 2,909,436 · +26.5%
Race, ethnicity, and origin ACS 2023
- Neighborhood character
- Diverse neighborhood (Simpson 0.70)
- Race & ethnicity
- White 49% Two or more races 24% Hispanic / Latino 24% Black 9% Asian 4% Pacific Islander 1% Native American 1%
- Hispanic origin (detail)
- Mexican 20%
- Common ancestry
- Italian 5% Lithuanian 3% Slovak 3%
- Foreign-born
- 9% · Canada, China, South Korea
- Languages at home
- 81% English-only · Spanish 12% Other Asian/Pacific 2% Tagalog/Filipino 1%
Political lean MEDSL · San Bernardino
- 2024 margin
- Toss-up / Even · D 47.5% · R 49.7% · Other 2.8%
- 2008→2024 swing
- -8.5pp toward R · 2008: 6.3pp · 2024: -2.1pp
- All cycles
- 2024: R+2.1 2020: D+10.7 2016: D+9.8 2012: D+5.4 2008: D+6.3
Not yet ingested
- Civics
- —
Market trends
- HPI YoY
- ▼ -12.15%
- Current HPI
- 380.5083
- Rent YoY
- ▲ 4.45%
- Metro
- Riverside-San Bernardino-Ontario, CA
- State GDP YoY
- ▲ 3.21%
- F500 in state
- 116
Industry mix (Fortune 500 HQ in CA)
| Industry | F500 HQs | Revenue |
|---|---|---|
| Technology | 27 | $1,492B |
|
||
| Financial Services | 3 | $174B |
|
||
| Retail | 3 | $44B |
|
||
| Insurance | 3 | $26B |
|
||
| Media / Entertainment | 2 | $115B |
|
||
| Pharmaceuticals / Biotech | 2 | $62B |
|
||
Price history
-22.2% since first listed3 events — show timeline
- 2026-05-08 Listed $175,000 CRMLS
- 2026-03-13 Listing Removed — CRMLS
- 2025-09-11 Listed $225,000 CRMLS
Property tax history
+0.1%/yrLatest (2025): $699 · +3.3% YoY. Source: county tax records.
Cash-flow waterfall
monthlySold comps — $/sqft
last 12 mo · ≤1 miLoading sold comps…