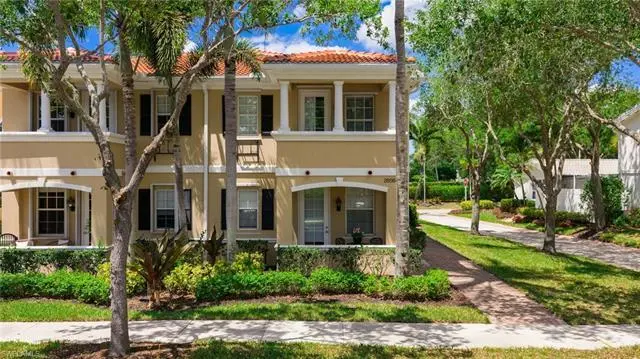
28564 Alessandria Cir · Bonita Springs, FL
Flood risk 1/10 · Minimal
- FEMA flood zone
- X (unshaded)
- Chance of flooding over 30 yrs
- 0.0%
- Est. flood insurance / yr
- $507 – $1,088
Fire risk 5/10 · Moderate
- Est. fire insurance / yr
- $947 – $1,759
Heat risk 10/10 · Severe
- Hot days now (above 108°F)
- 7 days/yr
- Hot days in 30 yrs
- 30 days/yr
Wind risk 10/10 · Severe
- Chance of severe wind over 30 yrs
- 99.0%
Air-quality risk 2/10 · Minimal
- Unhealthy air days now
- 2 days/yr
- Unhealthy air days in 30 yrs
- 2 days/yr
Risk factors via First Street. Map © Google.
Why this score? — see what drove the B- grade
The composite is a weighted blend of 9 inputs, each scored 0–100. Each bar is that input's sub-score; the figure is the points it added to the 100-point composite (weight × sub-score).
- Cash flow +25.6/30.0
- ARV discount +12.2/15.0
- DSCR +8.5/10.0
- 1% rule +6.9/10.0
- Schools +4.1/10.0
- Livability +3.5/5.0
- Condition / age +2.5/5.0
- Rent growth +2.3/5.0
- Appreciation +0.0/10.0
$415,000
🖨 Deal sheet 📄 Offer letter ✓ Due diligence
Listing remarks
Experience total peace of mind in this 4 bedroom, 3 full bathroom Cayman model, featuring a brand-new 2025 roof with a fully transferable manufacturer warranty. This residence is one of the sturdiest homes on the market, built with DiVosta’s legendary poured concrete construction and situated on a rare, oversized corner lot that offers a "single-family" living experience. Unlike standard units, this home boasts a private side yard and a personal sidewalk leading to one of the entrances, providing a level of seclusion and natural light that is truly unique to San Remo. New roof installed September 2025 along with new lanai screens. New kitchen and laundry appliances were inst
Key facts
- Oversized corner lot
- New lanai screens
- Private side yard
Tags
Property features AI
Finance
- Other: Property is part of a planned unit development (PUD); Restrictions include architectural controls, deeded restrictions, no commercial use, and no RVs
- HOA & community: Mandatory HOA (professional management); Quarterly HOA fee; HOA covers cable, insurance, internet/WiFi, irrigation water, lawn/land maintenance, street lights, street maintenance, and trash removal; Community amenities include clubhouse, community pool, community room, exercise room, library, pickleball, play area, sidewalks, streetlights, tennis court; Total annual recurring HOA fees listed as $4,328; One-time fees listed
Exterior
- Parking: Detached 2-car garage
- Security: Gated community
- Utilities: Central water; Central sewer; Cable available; Electric service for heat and cooling
- Home design: Residential townhouse; 2-story end unit; Rear exposure faces west; Built in 2004; Poured concrete construction; Located in the SAN REMO development
- Construction: Poured concrete construction; Stucco finish; Tile roof; Built in 2004; Foundation: poured concrete
- Exterior features: Patio; Privacy wall; Automatic sprinkler system; Shutters (manual); Single-hung windows; Stucco exterior; Tile roof
Interior
- Kitchen: Electric cooktop; Range; Microwave; Dishwasher; Disposal; Refrigerator/freezer; Refrigerator with icemaker
- Bedrooms: 4 bedrooms; First floor bedroom; Master bedroom on ground level; Master bedroom upstairs; Split bedroom floor plan
- Flooring: Carpet; Laminate; Tile
- Bathrooms: 3 full bathrooms; Master bath with dual sinks and separate tub and shower
- Heating & cooling: Central electric heat; Central electric air conditioning; Ceiling fans
- Interior features: Built-in cabinets; Cable prewire; High-speed internet available; Smoke detectors; Dining/family area; Balcony; Screened lanai/porch; Laundry in residence; Central vacuum; Auto garage door
- Laundry & utility: Washer; Dryer; Laundry located inside residence
Neighborhood map
What this means for you Summary
Snapshot
- This is a 3-bed/3.0-bath townhouse listed at $415k.
Deal economics
- At list price, monthly cash flow is $986 ($12k/yr) — positive.
- The deal already cash-flows at list — no discount required.
- Meets the 1% rule at list price ($5k rent vs $415k).
- Recommended offer: $409k (1.5% below list) — sets the bar for market timing.
- Cap rate 9.1% vs local median 1.7% in Bonita Springs — top-decile yield for the area; either an underpriced asset or a hidden risk that comps aren't pricing in. Stress-test before assuming the spread holds.
Location & tenants
- Location reads 70/100 on livability (#428 in FL) — a middle-class / working-renter tenant base. Strengths: crime A+, housing A+, employment A; Watch: schools C-, cost of living C-, health & safety D.
- Lee (suburban): math 47% / reading 50% proficiency, ranked #42 of 73 in FL (top 58%) — families likely to look elsewhere, expect single-tenant / working-renter base with shorter leases.
- Market conditions: Rents soft (-0.6%/yr); 835 active listings in the ZIP; 30 comparable units currently listed for rent nearby; rentals at typical pace (median 24d on market — plan ~3-4 weeks tenant-placement turnaround); solid renter incomes; 15,411 units permitted in Lee County in 2024 (4,686 in 5+ unit buildings).
- At $4,957/mo this rent would consume 65% of the median local household income ($91k/yr) (locally 976% of renters already pay >50% of income on rent) — very limited rent-growth headroom before tenants either downsize or default.
Forward outlook
- Local home prices are declining (-3.0%/yr); year-one equity from $3k of loan paydown is wiped out by about $12k of value loss. Plan a longer hold.
- Lee County population projected at +44% by 2050 — long-run rental-demand tailwind backs the buy-and-hold thesis.
Negotiation context
- It's been on market 27 days — a 2% lower offer ($409k) is reasonable based on typical stale-listing flexibility.
- 4 sale attempts since 11y ago with the ask held roughly flat each time — persistent listings suggest the price (not the market) is what's stuck; bring a comps-based counter.
- Current owner paid $232k; list at $415k implies a 78% gain — meaningful room to come down on a strong offer.
Risks & watch-outs
- Climate carrying-cost: severe wind risk, 99% chance of damaging wind over 30y; moderate wildfire risk; extreme-heat days projected 7→30/yr by 2055 (HVAC capex compounding) — expect insurance premiums to compound above CPI over the hold.
Questions for the listing agent
- What does the HOA fee cover, when was the last increase, and are there any pending special assessments or reserve-fund shortfalls?
- Is there a deadline driving the sale (1031 exchange, divorce, estate, relocation)? That informs how much negotiation room exists.
- What's the average days-on-market for RENTAL listings here right now (not sales)? A rising rental-DOM trend means longer vacancies and softer asking-rent achievability than the comps imply.
- What's the recent tenant-quality profile in this submarket — average credit score on applications, eviction rate, late-payment / NSF rate, and stable-employment percentage? A property-management company in the area should have these aggregated.
- How much new for-sale + rental construction is in the pipeline within 1–3 miles? Heavy new supply typically softens prices + rents 12–24 months out; constrained supply supports both.
Investment metrics
- 1% rule
- 1.19% ✓
- Cap rate
- 9.14%
- Cash-on-cash
- 10.18%
- DSCR
- 1.45
- GRM
- 7.0
CMA / ARV
- ARV (on-the-fly)
- $463,264
- Comps found
- 4
Show comp detail 4 sales within ~0.75 mi
| Address | Dist | Beds/Ba | Sqft | Sold | Price | $/sf | Match |
|---|---|---|---|---|---|---|---|
| 29072 Alessandria Cir Unit . | 0.22mi | 3/3.0 | 1,868 (0%) | 4mo | $400,000 | $214 | 87 |
| 15009 Auk Way | 0.57mi | 3/3.0 | 1,868 (0%) | 2mo | $407,500 | $218 | 72 |
| 14582 Bellino Ter #102 | 0.10mi | 2/2.0 (-1) | 1,654 (-12%) | 2mo | $411,000 | $248 | 66 |
| 15103 Auk Way | 0.68mi | 3/3.0 | 1,868 (0%) | 18mo | $502,400 | $269 | 53 |
Match score weights: distance 35% · size 25% · config 20% · recency 20%. Top-matched comps best support the ARV.
Projected returns pro-forma
-3.0% appreciation · 0.0% rent growth · sell at horizon
- IRR
- -4.5%
- Equity multiple
- 0.84×
- Total profit
- $-18,865
- Equity at exit
- $61,878
- IRR
- 1.2%
- Equity multiple
- 1.08×
- Total profit
- $8,749
- Equity at exit
- $35,882
Cash invested: $116,200 (down + closing). Projections, not guarantees.
Landlord ↔ Tenant lean methodology
- Overall (STATE)
- 87 Strongly Landlord-Friendly
- State Florida
- 87 Strongly Landlord-Friendly · R+3
- County
- — inherits STATE
- City
- — inherits STATE
ZIP-level market 34135
- Rents YoY
- -0.6%
- Active inventory
- 835
- Price-to-rent
- 7.0×
Monthly cashflow live
- Estimated rent
- $4,957 high interval (Pro) →
- Mortgage (P&I)
- −$2,176
- Tax from tax record
- −$221 /mo · $2,653/yr
- Insurance
- −$173
- HOA
- −$360
- Vacancy / Maint / Mgmt
- −$1,041
- Net cashflow
- $986
Break-even live
UW: 25.0% down · 7.5% · 30yr · 1.5% tax · 5.0% vac · 8.0% maint · 8.0% mgmt
Financing live
Cash to close
- Down payment
- $103,750
- Closing costs
- $12,450
- Reserves months
- —
- Total cash needed
- —
Loan-product check · same deal, 3 products live
Conventional
25% down · 7.5% · 30yr
- Down + closing
- —
- Monthly P&I
- —
- Monthly cashflow
- —
- DSCR
- —
- Eligible?
- —
Personal DTI + credit; lowest rate.
DSCR
20% down · 8.5% · 30yr
- Down + closing
- —
- Monthly P&I
- —
- Monthly cashflow
- —
- DSCR
- —
- Eligible?
- —
No personal income docs; deal must DSCR.
Hard money
10% down · 12.0% · 12mo
- Down + closing
- —
- Monthly P&I
- —
- Monthly cashflow
- —
- DSCR
- —
- Eligible?
- —
Short-term bridge; refi at stabilization.
Rent comps 30 comps
| Address | Beds | Baths | Sqft | Rent | $/sqft | DOM | Units | Dist |
|---|---|---|---|---|---|---|---|---|
| 28576 Alessandria Cir Bonita Springs, FL | 3.0 | 3.0 | 1868 | $2,595 | $1.39 | 19d | 1 | 0.03mi |
| 14706 Escalante Way Bonita Springs, FL | 3.0 | 3.0 | 1868 | $2,600 | $1.39 | 24d | 1 | 0.17mi |
| 28719 Alessandria Cir Bonita Springs, FL | 3.0 | 3.0 | 1868 | $2,400 | $1.28 | 24d | 1 | 0.17mi |
| 14552 Bellino Ter #201 Bonita Springs, FL | 3.0 | 2.5 | 2297 | $7,500 | $3.27 | 24d | 1 | 0.19mi |
| 28050 Boccaccio Way Bonita Springs, FL | 2.0 | 2.0 | 1534 | $2,600 | $1.69 | 24d | 1 | 0.33mi |
| 28086 Sosta Ln #1 Bonita Springs, FL | 2.0 | 2.0 | 1402 | $2,300 | $1.64 | 3d | 1 | 0.35mi |
| 28008 Sosta Ln #4 Bonita Springs, FL | 3.0 | 2.0 | 1541 | $6,000 | $3.89 | 24d | 1 | 0.38mi |
| 14099 Tivoli Ter Bonita Springs, FL | 3.0 | 2.0 | 2205 | $3,500 | $1.59 | 13d | 1 | 0.57mi |
| 15107 Auk Way Bonita Springs, FL | 3.0 | 3.0 | 1868 | $6,200 | $3.32 | 21d | 1 | 0.66mi |
| 28000 Quiet Water Way Bonita Springs, FL | 3.0 | 2.0 | 2174 | $6,250 | $2.87 | 24d | 1 | 0.71mi |
| 28751 Xenon Way Bonita Springs, FL | 3.0 | 2.0 | 1661 | $2,650 | $1.60 | 3d | 1 | 0.78mi |
| 28495 Villagewalk Blvd Bonita Springs, FL | 3.0 | 3.0 | 1868 | $3,500 | $1.87 | 16d | 1 | 0.79mi |
| 28068 Cavendish Ct #2310 Bonita Springs, FL | 2.0 | 2.0 | 1339 | $5,500 | $4.11 | 24d | 1 | 0.81mi |
| 28648 San Lucas Ln #102 Bonita Springs, FL | 2.0 | 2.0 | 1940 | $8,000 | $4.12 | 24d | 1 | 0.81mi |
| 15317 Laughing Gull Ln Bonita Springs, FL | 3.0 | 3.0 | 1800 | $6,700 | $3.72 | 24d | 1 | 0.84mi |
| 28869 Vermillion Ln Bonita Springs, FL | 2.0 | 2.0 | 1534 | $4,000 | $2.61 | 16d | 1 | 0.88mi |
| 28048 Cavendish Ct #5904 Bonita Springs, FL | 2.0 | 2.0 | 1446 | $6,500 | $4.50 | 21d | 1 | 0.90mi |
| 15369 Laughing Gull Ln Bonita Springs, FL | 3.0 | 3.0 | 1868 | $4,999 | $2.68 | 24d | 1 | 0.91mi |
| 28329 Moray Dr Bonita Springs, FL | 4.0 | 3.0 | 2518 | $3,400 | $1.35 | 24d | 1 | 0.98mi |
| 13520 Southampton Dr Bonita Springs, FL | 3.0 | 2.0 | 1642 | $8,000 | $4.87 | 24d | 1 | 1.03mi |
| 28207 Islet Trl Bonita Springs, FL | 2.0 | 2.0 | 1534 | $3,300 | $2.15 | 24d | 1 | 1.06mi |
| 13962 Southampton Dr #4404 Bonita Springs, FL | 2.0 | 2.0 | 1446 | $6,500 | $4.50 | 24d | 1 | 1.08mi |
| 15561 Latitude Dr Bonita Springs, FL | 3.0 | 3.0 | 1868 | $5,600 | $3.00 | 24d | 1 | 1.17mi |
| 15382 Queen Angel Way Bonita Springs, FL | 2.0 | 2.0 | 1534 | $1,500 | $0.98 | 3d | 1 | 1.24mi |
| 13611 Worthington Way #1312 Bonita Springs, FL | 3.0 | 2.0 | 1312 | $5,500 | $4.19 | 24d | 1 | 1.31mi |
| 13360 Bridgeford Ave Bonita Springs, FL | 4.0 | 3.0 | 2609 | $12,000 | $4.60 | 3d | 1 | 1.36mi |
| 13270 Sherburne Cir #2903 Bonita Springs, FL | 2.0 | 2.0 | 1487 | $6,000 | $4.03 | 24d | 1 | 1.44mi |
| 13260 Sherburne Cir #2704 Bonita Springs, FL | 2.0 | 2.0 | 1446 | $6,500 | $4.50 | 21d | 1 | 1.45mi |
| 28496 Burano Dr Bonita Springs, FL | 2.0 | 2.0 | 1837 | $3,245 | $1.77 | 3d | 1 | 1.45mi |
| 13256 Sherburne Cir #2603 Bonita Springs, FL | 3.0 | 2.0 | 1576 | $6,500 | $4.12 | 24d | 1 | 1.46mi |
HOA detail
- Monthly dues
- $360 · $4,320/yr
Listing history 18 events
-
2026-06-07statusdays on market $415,000 Pending 27 DOM
-
2026-06-03days on market $415,000 Active 26 DOM
-
2026-06-02days on market $415,000 Active 25 DOM
-
2026-06-01days on market $415,000 Active 24 DOM
-
2026-05-31days on market $415,000 Active 23 DOM
-
2026-05-08$415,000 Active
-
2024-06-20$450,000 Active
-
2023-09-26price $464,900
-
2023-09-15$475,000 Active
-
2015-06-12soldstatus $232,500
-
2015-06-03price $232,500
-
2015-06-03soldstatus $232,500 Sold
-
2015-06-02price $239,000
-
2015-05-22status Pending
-
2015-04-16status Pending With Contingencies
-
2015-03-27price $239,000
-
2015-03-19$246,900 Active
-
2002-10-04soldstatus $14,176,400
ⓘ Source: listings_history table (triggers on properties + properties_extension) + one-shot
backfill from property_details.listing_events for pre-trigger history.
Tax reassessment forecast FL · Resets to sale price
- Current annual tax
- $2,653 · $221/mo
- Projected year-2 tax
- $3,444 · $287/mo
- Expected delta
- +$791/yr (+$66/mo · 29.8%)
ⓘ Screening estimate from a state-policy table — verify with the county assessor before closing.
Climate risk First Street
- Flood 1/10 Low FEMA zone X (unshaded) · 0% chance over 30 yrs
- Wildfire 5/10 Major
- Heat 10/10 Extreme 7 d/yr ≥108°F today · 30 d/yr by 30 yrs out
- Wind 10/10 Extreme 99% chance of damaging wind over 30 yrs
- Air quality 2/10 Low 2 unhealthy d/yr today · 2 by 30 yrs out
Nearby sold comps map
Loading sold comps map…
Walkable amenities ~0.75 mi
Loading nearby amenities…
Taxation est. · year 1
- Rental income
- $59,488
- − Mortgage interest
- −$23,246
- − Property taxes
- −$2,653
- − Insurance
- −$2,075
- − Repairs & maintenance
- −$4,759
- − Management
- −$4,759
- − HOA
- −$4,320
- − Depreciation
- −$12,073
- Taxable income
- $5,603
- Est. tax owed @ 24.0%
- −$1,345
- After-tax cash flow
- $10,487/yr
For passive investors: Depreciation is non-cash, so a rental often shows a tax loss while cash-flowing — sheltering income. Rental losses are passive: they offset passive income freely, and up to $25,000/yr can offset ordinary (W-2) income if you actively participate and your MAGI is under $100k (phasing out to $0 by $150k); unused losses carry forward. On sale, claimed depreciation is recaptured at up to 25%, and gains may owe capital-gains tax (a 1031 exchange can defer both). Figures are a year-1 estimate at your 24.0% rate — not tax advice; consult a CPA.
Schools (NCES district)
- District
- Lee
- NCES district ID
- 1201080
- Math proficiency
- 47% ▼ -11.00%
- Reading proficiency
- 50% ▼ -4.00%
- Median HH income
- $49,518
- Composite
- 41.49/100
- National rank
- #3458
- State rank
- #42 of 73 in FL
Livability — Bonita Springs
- Score
- 70/100
- State rank
- #428
- US rank
- #7576
Category grades
Schools grade is shown separately in the Schools card above.
Census & demographics
- Census place
- Bonita Springs, FL
- County
- Lee County · 788,662 people
- City population
- 64,727
- Metro
- Cape Coral-Fort Myers, FL
- Population (ZIP)
- 48,252
- Household income
- $91,380
- Rent vs Own
- Severe rent burden
- 976.0
Population outlook (Lee County) Hauer SSP2
- Today (2025)
- 871,946 people
- By 2030
- 955,468 · +9.6%
- By 2040
- 1,113,587 · +27.7%
- By 2050
- 1,256,891 · +44.1%
- By 2075
- 1,560,270 · +78.9%
- By 2100
- 1,726,848 · +98.0%
Race, ethnicity, and origin ACS 2023
- Neighborhood character
- Predominantly White (69%)
- Race & ethnicity
- White 69% Hispanic / Latino 26% Two or more races 13% Native American 3% Black 2%
- Hispanic origin (detail)
- Mexican 8% Puerto Rican 4% Cuban 3%
- Common ancestry
- Romanian 5% Lithuanian 2% Slovak 2%
- Foreign-born
- 22% · Canada, Jamaica
- Languages at home
- 74% English-only · Spanish 21% French/Haitian/Cajun 1% Russian/Polish/Slavic 1%
Political lean MEDSL · Lee
- 2024 margin
- Strong R (+28.4) · D 35.5% · R 63.9%
- 2008→2024 swing
- -18.0pp toward R · 2008: -10.4pp · 2024: -28.4pp
- All cycles
- 2024: R+28.4 2020: R+19.2 2016: R+20.4 2012: R+16.6 2008: R+10.4
Not yet ingested
- Civics
- —
Market trends
- HPI YoY
- ▼ -188.86%
- Current HPI
- 243.4153
- Rent YoY
- ▼ -0.61%
- Metro
- Cape Coral-Fort Myers, FL
- State GDP YoY
- ▲ 3.28%
- F500 in state
- 36
Industry mix (Fortune 500 HQ in FL)
| Industry | F500 HQs | Revenue |
|---|---|---|
| Industrial Technology | 2 | $29B |
|
||
| Insurance | 2 | $17B |
|
||
| Retail | 1 | $60B |
|
||
| Technology Distribution | 1 | $58B |
|
||
| Homebuilding | 1 | $35B |
|
||
| Technology Manufacturing | 1 | $35B |
|
||
Price history
-97.1% since first listed13 events — show timeline
- 2026-05-08 Listed $415,000 BEARMLS
- 2024-06-20 Listed $450,000 BEARMLS
- 2023-09-26 Price Changed $464,900 BEARMLS
- 2023-09-15 Listed $475,000 BEARMLS
- 2015-06-12 Sold (Public Records) $232,500 Public Records
- 2015-06-03 Price Changed $232,500 FORTMLS
- 2015-06-03 Sold (MLS) $232,500 FORTMLS
- 2015-06-02 Price Changed $239,000 FORTMLS
- 2015-05-22 Pending — FORTMLS
- 2015-04-16 Pending — FORTMLS
- 2015-03-27 Price Changed $239,000 FORTMLS
- 2015-03-19 Listed $246,900 FORTMLS
- 2002-10-04 Sold (Public Records) $14,176,400 Public Records
Property tax history
+3.8%/yrLatest (2025): $2,653 · +4.4% YoY. Source: county tax records.
Cash-flow waterfall
monthlySold comps — $/sqft
last 12 mo · ≤1 miLoading sold comps…