 🏗️ New Construction
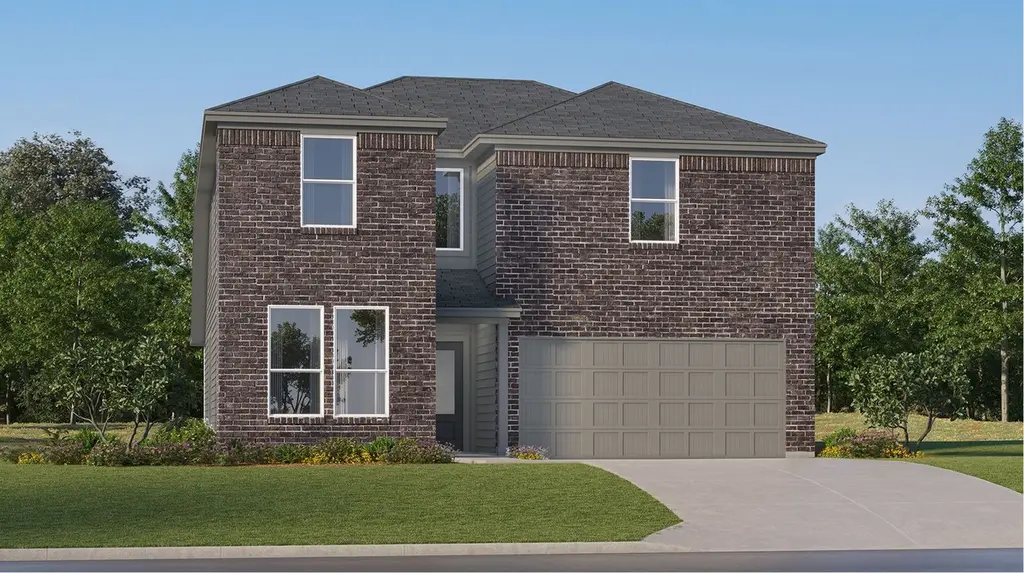
Napali Plan · San Antonio, TX
Flood risk No data
- FEMA flood zone
- —
- Chance of flooding over 30 yrs
- —
- Est. flood insurance / yr
- —
Fire risk No data
- Est. fire insurance / yr
- —
Heat risk No data
- Hot days now (above threshold)
- —
- Hot days in 30 yrs
- —
Wind risk No data
- Chance of severe wind over 30 yrs
- —
Air-quality risk No data
- Unhealthy air days now
- —
- Unhealthy air days in 30 yrs
- —
Risk factors via First Street. Map © Google.
Why this score? — see what drove the F grade
The composite is a weighted blend of 9 inputs, each scored 0–100. Each bar is that input's sub-score; the figure is the points it added to the 100-point composite (weight × sub-score).
- ARV discount +7.5/15.0
- Livability +4.0/5.0
- Condition / age +4.0/5.0
- Cash flow +3.8/30.0
- Schools +3.8/10.0
- Rent growth +1.7/5.0
- 1% rule +0.1/10.0
- DSCR +0.0/10.0
- Appreciation +0.0/10.0
$300,499
🖨 Deal sheet 📄 Offer letter ✓ Due diligence
Listing remarks MLS
This new two-story home features a single-level owner's suite, offering a serene retreat with a full bathroom and walk-in closet. A secondary bedroom is located near the front of the home, while an open-concept floorplan encourages seamless indoor-outdoor living with access to an inviting covered porch. On the second level, a bonus room provides a versatile shared living area easily accessible from three additional secondary bedrooms.
Key facts
- Covered porch
- Full bathroom
- Walk-in closet
Tags
Neighborhood map
What this means for you Summary
Snapshot
- This is a 5-bed/3.0-bath single-family listed at $300k. Condition is rated good.
Deal economics
- At list price, monthly cash flow is $-2k ($-19k/yr) — negative.
- The deal already cash-flows at list — no discount required.
- To meet the 1% rule (rent ≥ 1% of price), the offer needs to be $278k (7.5% below list).
- Recommended offer: $273k (9.0% below list) — sets the bar for market timing.
- Cap rate 2.8% vs local median 3.8% in San Antonio — below-typical yield; the buyer is paying a premium for something (appreciation thesis, condition, location) that the cap rate doesn't capture.
Location & tenants
- Location reads 80/100 on livability (#31 in TX, #1,616 nationally) — a professional / high-income tenant draw. Strengths: amenities A+, commute A+, cost of living A+; Watch: schools C-, crime F.
- North East ISD (urban): math 38% / reading 49% proficiency, ranked #276 of 826 in TX (top 33%) — families likely to look elsewhere, expect single-tenant / working-renter base with shorter leases.
- Market conditions: Rents falling (-3.4%/yr); 325 active listings in the ZIP; 6 comparable units currently listed for rent nearby; rentals leasing fast (median 8d on market — plan ~1-2 weeks tenant-placement turnaround); 8,308 units permitted in Bexar County in 2024 (2,506 in 5+ unit buildings).
- At $2,780/mo this rent would consume 64% of the median local household income ($52k/yr) (locally 2809% of renters already pay >50% of income on rent) — very limited rent-growth headroom before tenants either downsize or default.
Forward outlook
- Local home prices are declining (-3.0%/yr); year-one equity from $4k of loan paydown is wiped out by about $16k of value loss. Plan a longer hold.
- Bexar County population projected at +50% by 2050 — long-run rental-demand tailwind backs the buy-and-hold thesis.
Negotiation context
- It's been on market 118 days — a 9% lower offer ($273k) is reasonable based on typical stale-listing flexibility.
Risks & watch-outs
- Watch-outs: property tax is 2.7% of price.
Questions for the listing agent
- What do current leases actually rent for vs. the listed asking? Can we see a recent rent roll and the last 12 months of T-12 income?
- It's been on market 118 days. Have you received any prior offers? Is the seller open to a 9% concession, seller financing, or rate buy-down credit?
- Property tax is high relative to price — has the assessment been appealed recently, and will the sale trigger a re-assessment?
- Why hasn't it sold? Are there any deal-killer items the seller is aware of (foundation, flood, title, zoning, code violations)?
- Is there a deadline driving the sale (1031 exchange, divorce, estate, relocation)? That informs how much negotiation room exists.
- Crime grade is F in this area — have there been break-ins, vandalism, or insurance claims at this property in the last 3 years? What carrier currently insures it and at what premium?
- The area grade is low — what's the realistic commute time and amenity access for the typical tenant pool here? Any planned neighborhood developments (good or bad) we should know about?
- What's the average days-on-market for RENTAL listings here right now (not sales)? A rising rental-DOM trend means longer vacancies and softer asking-rent achievability than the comps imply.
- What's the recent tenant-quality profile in this submarket — average credit score on applications, eviction rate, late-payment / NSF rate, and stable-employment percentage? A property-management company in the area should have these aggregated.
- How much new for-sale + rental construction is in the pipeline within 1–3 miles? Heavy new supply typically softens prices + rents 12–24 months out; constrained supply supports both.
Investment metrics
- 1% rule
- 0.51% ✗
- Cap rate
- 2.83%
- Cash-on-cash
- -12.36%
- DSCR
- 0.45
- GRM
- 16.3
CMA / ARV
- ARV (median comp)
- $545,464
- List price
- $300,499
- Delta
- -44.91%
- Verdict
- UNDERPRICED
- Comps
- 20 within 1.0 mi
Show comp detail 8 sales within ~0.75 mi
| Address | Dist | Beds/Ba | Sqft | Sold | Price | $/sf | Match |
|---|---|---|---|---|---|---|---|
| 315 Royal Oaks | 0.37mi | 4/2.5 (-1) | 2,412 (-6%) | 3mo | $579,999 | $240 | 64 |
| 647 Cave Ln | 0.55mi | 4/3.0 (-1) | 2,412 (-6%) | 1mo | $550,000 | $228 | 59 |
| 8731 Oak Ledge | 0.55mi | 4/3.0 (-1) | 2,618 (+3%) | 10mo | $450,000 | $172 | 57 |
| 1511 Haskin Dr | 0.66mi | 4/3.0 (-1) | 2,772 (+9%) | 2mo | $775,000 | $280 | 48 |
| 443 Laramie | 0.49mi | 4/3.0 (-1) | 2,873 (+13%) | 6mo | $750,000 | $261 | 47 |
| 634 Wyndale St | 0.39mi | 4/2.0 (-1) | 2,301 (-10%) | 21mo | $639,000 | $278 | 39 |
| 218 Laramie Dr | 0.64mi | 4/3.5 (-1) | 2,843 (+11%) | 23mo | $789,000 | $278 | 25 |
| 8731 Sagebrush | 0.64mi | 4/2.0 (-1) | 2,179 (-15%) | 22mo | $495,000 | $227 | 19 |
Match score weights: distance 35% · size 25% · config 20% · recency 20%. Top-matched comps best support the ARV.
Projected returns pro-forma
-3.0% appreciation · 0.0% rent growth · sell at horizon
- IRR
- -42.4%
- Equity multiple
- -0.29×
- Total profit
- $-196,690
- Equity at exit
- $81,330
- IRR
- -93.7%
- Equity multiple
- -1.17×
- Total profit
- $-331,609
- Equity at exit
- $47,162
Cash invested: $152,730 (down + closing). Projections, not guarantees.
Landlord ↔ Tenant lean methodology
- Overall (STATE)
- 87 Strongly Landlord-Friendly
- State Texas
- 87 Strongly Landlord-Friendly · R+5
- County
- — inherits STATE
- City
- — inherits STATE
ZIP-level market 78223
- Home prices YoY
- -16.4%
- Rents YoY
- -3.4%
- Active inventory
- 325
- Price-to-rent
- 9.0×
Monthly cashflow live
- Estimated rent
- $2,780 high interval (Pro) →
- Mortgage (P&I)
- −$2,860
- Tax est. 1.5%
- −$682 /mo · $8,182/yr
- Insurance
- −$227
- HOA
- −$0
- Vacancy / Maint / Mgmt
- −$584
- Net cashflow
- $-1,573
Break-even live
UW: 25.0% down · 7.5% · 30yr · 1.5% tax · 5.0% vac · 8.0% maint · 8.0% mgmt
Financing live
Cash to close
- Down payment
- $136,366
- Closing costs
- $16,364
- Reserves months
- —
- Total cash needed
- —
Loan-product check · same deal, 3 products live
Conventional
25% down · 7.5% · 30yr
- Down + closing
- —
- Monthly P&I
- —
- Monthly cashflow
- —
- DSCR
- —
- Eligible?
- —
Personal DTI + credit; lowest rate.
DSCR
20% down · 8.5% · 30yr
- Down + closing
- —
- Monthly P&I
- —
- Monthly cashflow
- —
- DSCR
- —
- Eligible?
- —
No personal income docs; deal must DSCR.
Hard money
10% down · 12.0% · 12mo
- Down + closing
- —
- Monthly P&I
- —
- Monthly cashflow
- —
- DSCR
- —
- Eligible?
- —
Short-term bridge; refi at stabilization.
Rent comps 6 comps
| Address | Beds | Baths | Sqft | Rent | $/sqft | DOM | Units | Dist |
|---|---|---|---|---|---|---|---|---|
| 427 Laramie Dr San Antonio, TX | 4.0 | 3.0 | 1916 | $3,500 | $1.83 | 18d | 1 | 0.49mi |
| 427 Laramie Dr San Antonio, TX | 4.0 | 3.0 | 1916 | $3,500 | $1.83 | 16d | 1 | 0.49mi |
| 3206 Albin Dr San Antonio, TX | 4.0 | 2.5 | 2445 | $3,500 | $1.43 | 2d | 1 | 1.23mi |
| 8227 Campobello Dr San Antonio, TX | 5.0 | 2.0 | 2180 | $2,100 | $0.96 | 3d | 1 | 1.27mi |
| 4035 Barrington St San Antonio, TX | 4.0 | 4.5 | 2078 | $2,000 | $0.96 | 4d | 1 | 1.36mi |
| 2904 Knight Robin Dr San Antonio, TX | 5.0 | 3.5 | 2780 | $2,250 | $0.81 | 8d | 1 | 1.46mi |
Listing history 19 events
-
2026-06-18price $300,499 Active 118 DOM
-
2026-06-18days on market $299,999 Active 118 DOM
-
2026-06-17days on market $299,999 Active 117 DOM
-
2026-06-16days on market $299,999 Active 116 DOM
-
2026-06-13pricedays on market $299,999 Active 113 DOM
-
2026-06-13pricedays on market $299,499 Active 112 DOM
-
2026-06-10price $298,499 Active 109 DOM
-
2026-06-09days on market $297,999 Active 109 DOM
-
2026-06-08days on market $297,999 Active 108 DOM
-
2026-06-08price $297,999 Active 107 DOM
-
2026-06-07days on market $297,499 Active 107 DOM
-
2026-06-04days on market $297,499 Active 104 DOM
-
2026-06-03days on market $297,499 Active 103 DOM
-
2026-06-02pricedays on market $297,499 Active 102 DOM
-
2026-06-01days on market $296,999 Active 101 DOM
-
2026-05-31days on market $296,999 Active 100 DOM
-
2026-05-12price $296,999 438-char remark
Show marketing remark (438 chars)
This new two-story home features a single-level owner's suite, offering a serene retreat with a full bathroom and walk-in closet. A secondary bedroom is located near the front of the home, while an open-concept floorplan encourages seamless indoor-outdoor living with access to an inviting covered porch. On the second level, a bonus room provides a versatile shared living area easily accessible from three additional secondary bedrooms.
-
2026-05-05price $299,999 438-char remark
Show marketing remark (438 chars)
This new two-story home features a single-level owner's suite, offering a serene retreat with a full bathroom and walk-in closet. A secondary bedroom is located near the front of the home, while an open-concept floorplan encourages seamless indoor-outdoor living with access to an inviting covered porch. On the second level, a bonus room provides a versatile shared living area easily accessible from three additional secondary bedrooms.
-
2026-02-20$303,999 Active 438-char remark
Show marketing remark (438 chars)
This new two-story home features a single-level owner's suite, offering a serene retreat with a full bathroom and walk-in closet. A secondary bedroom is located near the front of the home, while an open-concept floorplan encourages seamless indoor-outdoor living with access to an inviting covered porch. On the second level, a bonus room provides a versatile shared living area easily accessible from three additional secondary bedrooms.
ⓘ Source: listings_history table (triggers on properties + properties_extension) + one-shot
backfill from property_details.listing_events for pre-trigger history.
Nearby sold comps map
Loading sold comps map…
Walkable amenities ~0.75 mi
Loading nearby amenities…
Taxation est. · year 1
- Rental income
- $33,363
- − Mortgage interest
- −$30,554
- − Property taxes
- −$8,182
- − Insurance
- −$2,727
- − Repairs & maintenance
- −$2,669
- − Management
- −$2,669
- − Depreciation
- −$15,868
- Taxable loss
- −$29,307
- Est. tax savings @ 24.0%
- +$7,034
- After-tax cash flow
- $-11,844/yr
For passive investors: Depreciation is non-cash, so a rental often shows a tax loss while cash-flowing — sheltering income. Rental losses are passive: they offset passive income freely, and up to $25,000/yr can offset ordinary (W-2) income if you actively participate and your MAGI is under $100k (phasing out to $0 by $150k); unused losses carry forward. On sale, claimed depreciation is recaptured at up to 25%, and gains may owe capital-gains tax (a 1031 exchange can defer both). Figures are a year-1 estimate at your 24.0% rate — not tax advice; consult a CPA.
Condition & rehab AI · 12 photos
This new two-story home is in excellent condition with a modern design and well-maintained features. It is move-in ready and has the potential for further value increases through minor exterior and landscaping improvements.
Value-add opportunities
- Both Painting the exterior brick — Enhances curb appeal and can increase both resale and rental value
- Both Landscaping improvements — Enhances curb appeal and can increase both resale and rental value
Renovation cost estimate screening
Value-add ROI direction
- Both Painting the exterior brick — Enhances curb appeal and can increase both resale and rental value ↑
- Both Landscaping improvements — Enhances curb appeal and can increase both resale and rental value ↑
ⓘ Cost ranges are severity-bucket heuristics (US national rule-of-thumb). Get contractor quotes + a written scope before underwriting a rehab budget.
Schools (NCES district)
- District
- North East ISD
- NCES district ID
- 4832940
- Math proficiency
- 38% ▼ -14.00%
- Reading proficiency
- 49% ▼ -4.00%
- Median HH income
- $57,715
- Composite
- 38.1/100
- National rank
- #4276
- State rank
- #276 of 826 in TX
Livability — San Antonio
- Score
- 80/100
- State rank
- #31
- US rank
- #1616
Category grades
Schools grade is shown separately in the Schools card above.
Census & demographics
- Census place
- San Antonio, TX
- County
- Bexar County · 1,990,555 people
- City population
- 1,806,925
- Metro
- San Antonio-New Braunfels, TX
- Population (ZIP)
- 58,983
- Household income
- $52,088
- Rent vs Own
- Severe rent burden
- 2809.0
Population outlook (Bexar County) Hauer SSP2
- Today (2025)
- 2,336,851 people
- By 2030
- 2,560,728 · +9.6%
- By 2040
- 3,020,569 · +29.3%
- By 2050
- 3,493,522 · +49.5%
- By 2075
- 4,668,459 · +99.8%
- By 2100
- 5,533,242 · +136.8%
Race, ethnicity, and origin ACS 2023
- Neighborhood character
- Predominantly Hispanic (76%)
- Race & ethnicity
- Hispanic / Latino 76% Two or more races 28% White 16% Black 5% Asian 2% Native American 1%
- Hispanic origin (detail)
- Mexican 67%
- Common ancestry
- Lithuanian 2% Romanian 1% Slovak 1%
- Foreign-born
- 10% · Canada, Vietnam
- Languages at home
- 63% English-only · Spanish 36%
Political lean MEDSL · Bexar
- 2024 margin
- Lean D (+9.8) · D 54.3% · R 44.6% · Other 1.1%
- 2008→2024 swing
- +4.2pp toward D · 2008: 5.6pp · 2024: 9.8pp
- All cycles
- 2024: D+9.8 2020: D+18.2 2016: D+13.5 2012: D+4.6 2008: D+5.6
Not yet ingested
- Civics
- —
Market trends
- HPI YoY
- ▼ -52.06%
- Current HPI
- 265.2235
- Rent YoY
- ▼ -3.36%
- Metro
- San Antonio-New Braunfels, TX
- State GDP YoY
- ▲ 3.95%
- F500 in state
- 110
Industry mix (Fortune 500 HQ in TX)
| Industry | F500 HQs | Revenue |
|---|---|---|
| Energy | 16 | $1,198B |
|
||
| Technology | 5 | $198B |
|
||
| Engineering / Construction | 4 | $72B |
|
||
| Energy Services | 3 | $60B |
|
||
| Utilities | 3 | $41B |
|
||
| Healthcare | 2 | $330B |
|
||
Price history
-2.3% since first listed3 events — show timeline
- 2026-05-12 Price Changed $296,999 Zillow
- 2026-05-05 Price Changed $299,999 Zillow
- 2026-02-20 Listed $303,999 Zillow
Cash-flow waterfall
monthlySold comps — $/sqft
last 12 mo · ≤1 miLoading sold comps…