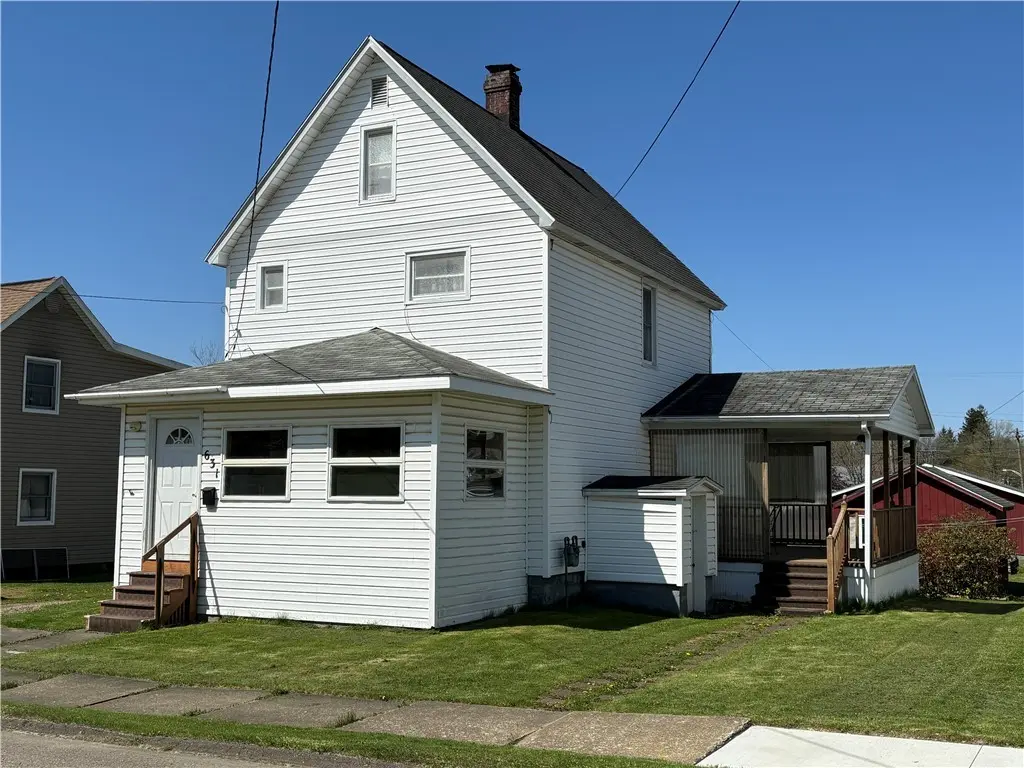
631 N Tionesta Ave · Kane, PA
Flood risk 1/10 · Minimal
- FEMA flood zone
- X (unshaded)
- Chance of flooding over 30 yrs
- 0.0%
- Est. flood insurance / yr
- $473 – $860
Fire risk 1/10 · Minimal
- Est. fire insurance / yr
- $511 – $949
Heat risk 2/10 · Minimal
- Hot days now (above 88°F)
- 7 days/yr
- Hot days in 30 yrs
- 18 days/yr
Wind risk 1/10 · Minimal
- Chance of severe wind over 30 yrs
- —
Air-quality risk 1/10 · Minimal
- Unhealthy air days now
- 0 days/yr
- Unhealthy air days in 30 yrs
- 0 days/yr
Risk factors via First Street. Map © Google.
Why this score? — see what drove the D grade
The composite is a weighted blend of 9 inputs, each scored 0–100. Each bar is that input's sub-score; the figure is the points it added to the 100-point composite (weight × sub-score).
- Cash flow +12.7/30.0
- ARV discount +7.5/15.0
- DSCR +3.8/10.0
- Schools +3.7/10.0
- 1% rule +3.6/10.0
- Appreciation +3.6/10.0
- Livability +3.4/5.0
- Rent growth +2.5/5.0
- Condition / age +2.5/5.0
$110,000
🖨 Deal sheet (PDF) 📄 Offer letter ✓ Due diligence
Listing remarks
"HOME SWEET HOME" - Welcoming two-story home on a spacious lot includes a detached, oversized 2-car garage perfect for a workshop, storage, or hobby space. An attached carport adds even more covered parking convenience or outside covered space to suit your needs. Inside, the first floor has an enclosed porch, kitchen, dining room, living room, and mudroom with 3-bedrooms and 2 baths on the second floor. This home features several inviting areas for enjoying the fresh air and outdoor living. Start your day on the enclosed front porch, or relax on the side covered porch, both perfect for soaking up the warm weather days. A versatile shed doubles as a covered patio with one side that
Key facts
- Attached carport
- Versatile shed
- Full basement
Tags
Property features AI
Exterior
- Parking: Detached garage with electricity; 2 garage spaces
- Utilities: Electricity connected; Public water connected; Sewer connected; High-speed internet available; Cable available
- Home design: 2-story house; Existing structure; Stone foundation; Shingle roof; Vinyl siding; City street frontage; Rectangular residential lot (approx. 0.27 acre, dimensions 60 x 195)
- Construction: Vinyl siding construction; Stone foundation; Shingle roof; Built (existing)
- Exterior features: Covered porch; Gravel driveway; Shed(s) / storage
Interior
- Kitchen: Gas oven; Gas range; Microwave; Refrigerator; Eat-in kitchen layout
- Bedrooms: Three bedrooms (all on the second level)
- Flooring: Carpet; Vinyl; Various flooring
- Bathrooms: One full bathroom; One half bathroom; One main-level bathroom
- Heating & cooling: Gas forced-air heating
- Interior features: Stair lift; Pull-down attic stairs; Eat-in kitchen; Furnished; Sunroom / Florida room
- Laundry & utility: Gas water heater
Neighborhood map
What this means for you Summary
Snapshot
- This is a 3-bed/1.5-bath other listed at $110k.
Deal economics
- At list price, monthly cash flow is $-12 ($-144/yr) — negative.
- To cash-flow at today's rent, offer at most $108k (1.9% below list).
- To meet the 1% rule (rent ≥ 1% of price), the offer needs to be $95k (14.0% below list).
- Recommended offer: $95k (14.0% below list) — sets the bar for 1% rule.
Location & tenants
- Location reads 68/100 on livability (#901 in PA) — a middle-class / working-renter tenant base. Strengths: crime A+, cost of living A+, housing A+; Watch: health & safety D, amenities F, commute F.
- Kane Area SD (rural): math 35% / reading 54% proficiency, ranked #291 of 539 in PA (top 54%) — families likely to look elsewhere, expect single-tenant / working-renter base with shorter leases.
- Zoned schools: Kane Area El Sch (math 37% / reading 51%, grade F, #858 of 1,518 statewide, top 57%, 433 students, 100% FRL); Kane Area Ms (math 22% / reading 57%, grade F, #268 of 512 statewide, top 53%, 222 students, 100% FRL); Kane Area Hs (math 67%, 329 students, 49% FRL) — zoned schools average 83% FRL vs 40% district-wide (42 pts higher); higher-poverty schools than district average — tighter screening recommended.
- Market conditions: 44 active listings in the ZIP; 29 units permitted in McKean County in 2024 (0 in 5+ unit buildings).
Forward outlook
- Local home prices are declining (-2.7%/yr); year-one equity from $761 of loan paydown is wiped out by about $3k of value loss. Plan a longer hold.
- McKean County population projected at -17% by 2050 — secular population decline; favor cash flow + early exit over multi-decade hold.
Negotiation context
- It's been on market 29 days — a 2% lower offer ($108k) is reasonable based on typical stale-listing flexibility.
Risks & watch-outs
- Watch-outs: built in 1910 — expect roof / HVAC / electrical / plumbing capex.
Questions for the listing agent
- What do current leases actually rent for vs. the listed asking? Can we see a recent rent roll and the last 12 months of T-12 income?
- Built in 1910 — when were the roof, HVAC, electrical panel, plumbing, and water heater last replaced?
- Is there a deadline driving the sale (1031 exchange, divorce, estate, relocation)? That informs how much negotiation room exists.
- The area grade is low — what's the realistic commute time and amenity access for the typical tenant pool here? Any planned neighborhood developments (good or bad) we should know about?
- What's the average days-on-market for RENTAL listings here right now (not sales)? A rising rental-DOM trend means longer vacancies and softer asking-rent achievability than the comps imply.
- What's the recent tenant-quality profile in this submarket — average credit score on applications, eviction rate, late-payment / NSF rate, and stable-employment percentage? A property-management company in the area should have these aggregated.
- How much new for-sale + rental construction is in the pipeline within 1–3 miles? Heavy new supply typically softens prices + rents 12–24 months out; constrained supply supports both.
Investment metrics
- 1% rule
- 0.86% ✗
- Cap rate
- 6.16%
- Cash-on-cash
- -0.47%
- DSCR
- 0.98
- GRM
- 9.7
CMA / ARV
No comps found within radius.
Projected returns pro-forma
-2.74% appreciation · 3.0% rent growth · sell at horizon
- IRR
- -15.4%
- Equity multiple
- 0.44×
- Total profit
- $-17,366
- Equity at exit
- $17,687
- IRR
- -7.3%
- Equity multiple
- 0.51×
- Total profit
- $-15,011
- Equity at exit
- $11,734
Cash invested: $30,800 (down + closing). Projections, not guarantees.
Landlord ↔ Tenant lean methodology
- Overall (STATE)
- 62 Landlord-Friendly
- State Pennsylvania
- 62 Landlord-Friendly · EVEN
- County
- — inherits STATE
- City
- — inherits STATE
ZIP-level market 16735
- Home prices YoY
- -1.8%
- Active inventory
- 44
- Price-to-rent
- 9.7×
Monthly cashflow live
- Estimated rent
- $946 medium interval (Pro) →
- Mortgage (P&I)
- −$577
- Tax from tax record
- −$137 /mo · $1,644/yr
- Insurance
- −$46
- HOA
- −$0
- Vacancy / Maint / Mgmt
- −$199
- Net cashflow
- $-12
Break-even live
Sensitivity live
| Price | -10% $50 | -5% $19 | +0% $-12 | +5% $-43 | +10% $-74 |
|---|---|---|---|---|---|
| Rent | -10% $-87 | -5% $-49 | +0% $-12 | +5% $25 | +10% $63 |
| Rate | -1.0pp $43 | -0.5pp $16 | base $-12 | +0.5pp $-40 | +1.0pp $-69 |
UW: 25.0% down · 7.5% · 30yr · 1.5% tax · 5.0% vac · 8.0% maint · 8.0% mgmt
Financing live
Cash to close
- Down payment
- $27,500
- Closing costs
- $3,300
- Reserves months
- —
- Total cash needed
- —
Loan-product check · same deal, 3 products live
Conventional
25% down · 7.5% · 30yr
- Down + closing
- —
- Monthly P&I
- —
- Monthly cashflow
- —
- DSCR
- —
- Eligible?
- —
Personal DTI + credit; lowest rate.
DSCR
20% down · 8.5% · 30yr
- Down + closing
- —
- Monthly P&I
- —
- Monthly cashflow
- —
- DSCR
- —
- Eligible?
- —
No personal income docs; deal must DSCR.
Hard money
10% down · 12.0% · 12mo
- Down + closing
- —
- Monthly P&I
- —
- Monthly cashflow
- —
- DSCR
- —
- Eligible?
- —
Short-term bridge; refi at stabilization.
Listing history 16 events
-
2026-06-19days on market $110,000 Active 29 DOM
-
2026-06-18days on market $110,000 Active 28 DOM
-
2026-06-17days on market $110,000 Active 27 DOM
-
2026-06-16days on market $110,000 Active 26 DOM
-
2026-06-15days on market $110,000 Active 25 DOM
-
2026-06-14days on market $110,000 Active 23 DOM
-
2026-06-12days on market $110,000 Active 22 DOM
-
2026-06-09days on market $110,000 Active 19 DOM
-
2026-06-08days on market $110,000 Active 18 DOM
-
2026-06-07days on market $110,000 Active 17 DOM
-
2026-06-04days on market $110,000 Active 13 DOM
-
2026-06-02days on market $110,000 Active 12 DOM
-
2026-06-01days on market $110,000 Active 11 DOM
-
2026-05-31days on market $110,000 Active 10 DOM
-
2026-05-31days on market $110,000 Active 9 DOM
-
2026-05-21$110,000 Active
ⓘ Source: listings_history table (triggers on properties + properties_extension) + one-shot
backfill from property_details.listing_events for pre-trigger history.
Tax reassessment forecast PA · Partial reset (capped growth)
- Current annual tax
- $1,644 · $137/mo
- Projected year-2 tax
- $1,691 · $141/mo
- Expected delta
- +$47/yr (+$4/mo · 2.9%)
ⓘ Screening estimate from a state-policy table — verify with the county assessor before closing.
Climate risk First Street
- Flood 1/10 Low FEMA zone X (unshaded) · 0% chance over 30 yrs
- Wildfire 1/10 Low
- Heat 2/10 Low 7 d/yr ≥88°F today · 18 d/yr by 30 yrs out
- Wind 1/10 Low
- Air quality 1/10 Low 0 unhealthy d/yr today · 0 by 30 yrs out
Nearby sold comps map
Loading sold comps map…
Walkable amenities ~0.75 mi
Loading nearby amenities…
Taxation est. · year 1
- Rental income
- $11,357
- − Mortgage interest
- −$6,162
- − Property taxes
- −$1,644
- − Insurance
- −$550
- − Repairs & maintenance
- −$909
- − Management
- −$909
- − Depreciation
- −$3,200
- Taxable loss
- −$2,016
- Est. tax savings @ 24.0%
- +$484
- After-tax cash flow
- $340/yr
For passive investors: Depreciation is non-cash, so a rental often shows a tax loss while cash-flowing — sheltering income. Rental losses are passive: they offset passive income freely, and up to $25,000/yr can offset ordinary (W-2) income if you actively participate and your MAGI is under $100k (phasing out to $0 by $150k); unused losses carry forward. On sale, claimed depreciation is recaptured at up to 25%, and gains may owe capital-gains tax (a 1031 exchange can defer both). Figures are a year-1 estimate at your 24.0% rate — not tax advice; consult a CPA.
Schools (NCES district)
- District
- Kane Area SD
- NCES district ID
- 4212660
- Math proficiency
- 35% ▼ -9.00%
- Reading proficiency
- 54% ▼ -11.00%
- Median HH income
- $41,784
- Composite
- 37.36/100
- National rank
- #4434
- State rank
- #291 of 539 in PA
Livability — Kane
- Score
- 68/100
- State rank
- #901
- US rank
- #9593
Category grades
Schools grade is shown separately in the Schools card above.
Census & demographics
- Census place
- Kane, PA
- Population (ZIP)
- 6,465
Population outlook (McKean County) Hauer SSP2
- Today (2025)
- 40,518 people
- By 2030
- 39,290 · -3.0%
- By 2040
- 36,438 · -10.1%
- By 2050
- 33,556 · -17.2%
- By 2075
- 27,682 · -31.7%
- By 2100
- 21,726 · -46.4%
Race, ethnicity, and origin ACS 2023
- Neighborhood character
- Predominantly White (94%)
- Race & ethnicity
- White 94% Two or more races 4% Hispanic / Latino 1%
- Common ancestry
- Romanian 5% Lithuanian 3% Polish 2%
- Foreign-born
- 1%
- Languages at home
- 99% English-only · Other Indo-European 1%
Political lean MEDSL · McKean
- 2024 margin
- Solid R (+47.2) · D 26.0% · R 73.2%
- 2008→2024 swing
- -29.9pp toward R · 2008: -17.3pp · 2024: -47.2pp
- All cycles
- 2024: R+47.2 2020: R+46.2 2016: R+47.2 2012: R+28.2 2008: R+17.3
Not yet ingested
- Civics
- —
Market trends
- HPI YoY
- ▼ -2.74%
- Current HPI
- 152.8176
- Rent YoY
- —
- Metro
- —
- State GDP YoY
- ▲ 1.68%
- F500 in state
- 34
Industry mix (Fortune 500 HQ in PA)
| Industry | F500 HQs | Revenue |
|---|---|---|
| Healthcare | 2 | $309B |
|
||
| Insurance | 2 | $27B |
|
||
| Telecommunications / Media | 1 | $124B |
|
||
| Industrial Distribution | 1 | $22B |
|
||
| Financial Services | 1 | $20B |
|
||
| Chemicals / Materials | 1 | $18B |
|
||
Price history
1 event — show timeline
- 2026-05-21 Listed $110,000 UNYREIS
Property tax history
+1.9%/yrLatest (2025): $1,644 · +4.3% YoY. Source: county tax records.
Cash-flow waterfall
monthlySold comps — $/sqft
last 12 mo · ≤1 miLoading sold comps…