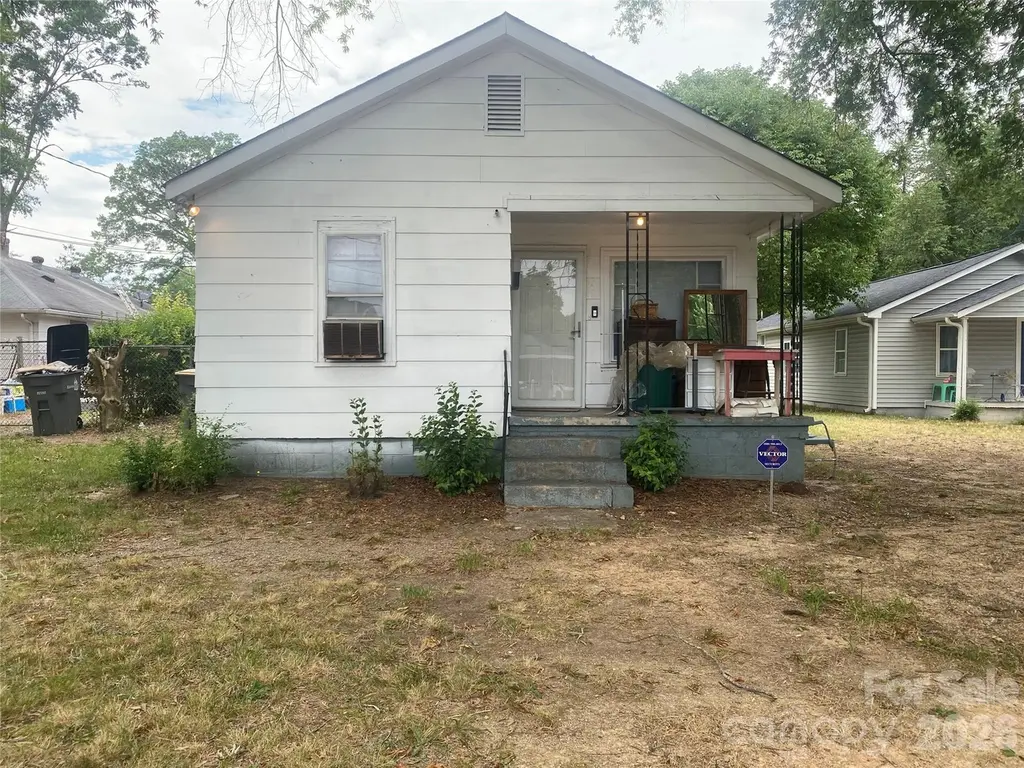
901 Indiana St · Kannapolis, NC
Flood risk 1/10 · Minimal
- FEMA flood zone
- X (unshaded)
- Chance of flooding over 30 yrs
- 0.0%
- Est. flood insurance / yr
- $507 – $1,088
Fire risk 1/10 · Minimal
- Est. fire insurance / yr
- $906 – $1,684
Heat risk 6/10 · Moderate
- Hot days now (above 105°F)
- 7 days/yr
- Hot days in 30 yrs
- 17 days/yr
Wind risk 5/10 · Moderate
- Chance of severe wind over 30 yrs
- 22.0%
Air-quality risk 2/10 · Minimal
- Unhealthy air days now
- 1 days/yr
- Unhealthy air days in 30 yrs
- 3 days/yr
Risk factors via First Street. Map © Google.
Why this score? — see what drove the B- grade
The composite is a weighted blend of 9 inputs, each scored 0–100. Each bar is that input's sub-score; the figure is the points it added to the 100-point composite (weight × sub-score).
- Cash flow +26.3/30.0
- ARV discount +15.0/15.0
- DSCR +8.9/10.0
- 1% rule +7.2/10.0
- Livability +3.2/5.0
- Rent growth +3.0/5.0
- Schools +2.6/10.0
- Condition / age +2.5/5.0
- Appreciation +0.0/10.0
$115,000
🖨 Deal sheet 📄 Offer letter ✓ Due diligence
Listing remarks
An investors dream! 2 bedroom home located on a spacious lot with fenced backyard. Located just 5 minutes away from downtown Kannapolis. Home is in need of significant repairs. Sold in its as-is condition and priced accordingly. Due to condition of the home, this is a cash or construction perm purchase only.
Key facts
- Spacious lot
- Fenced backyard
- 0.25 acre lot
Tags
Property features AI
Finance
- Other: Property contains approximately 0.25 acres
- HOA & community: No HOA
Exterior
- Parking: Driveway
- Utilities: Water: Other (see remarks); Sewer: Other (see remarks)
- Home design: Single-family residence; Residential property; One story (entry/main level); Zoned RV
- Construction: Site-built construction; Crawl space foundation
- Exterior features: Fenced yard; Publicly maintained road access; Road surfaces include gravel, paved, and other
Interior
- Kitchen: No appliances included
- Bedrooms: Two bedrooms on the main level
- Bathrooms: One full bathroom on the main level
- Heating & cooling: Central heating; Central air
- Interior features: Five total rooms; Central heating; Central air conditioning
- Laundry & utility: Main-level utility/laundry room
Neighborhood map
What this means for you Summary
Snapshot
- This is a 2-bed/1.0-bath single-family listed at $115k.
Deal economics
- At list price, monthly cash flow is $295 ($4k/yr) — positive.
- The deal already cash-flows at list — no discount required.
- Meets the 1% rule at list price ($1k rent vs $115k).
- Recommended offer: $108k (6.0% below list) — sets the bar for market timing.
- Cap rate 9.4% vs local median 3.5% in Kannapolis — top-decile yield for the area; either an underpriced asset or a hidden risk that comps aren't pricing in. Stress-test before assuming the spread holds.
Location & tenants
- Location reads 64/100 on livability (#354 in NC) — a middle-class / working-renter tenant base. Strengths: cost of living A+, housing A+, crime B; Watch: employment D+, schools F, amenities F.
- Kannapolis City Schools (suburban): math 30% / reading 33% proficiency, ranked #141 of 178 in NC (top 79%) — families likely to look elsewhere, expect single-tenant / working-renter base with shorter leases; 63% free/reduced lunch — lower-income household profile, screen leases tightly.
- Market conditions: Rents rising (+2.1%/yr); 140 active listings in the ZIP; 25 comparable units currently listed for rent nearby; rentals at typical pace (median 18d on market — plan ~3-4 weeks tenant-placement turnaround); 2,485 units permitted in Cabarrus County in 2024 (677 in 5+ unit buildings).
Forward outlook
- Local home prices are declining (-3.0%/yr); year-one equity from $795 of loan paydown is wiped out by about $3k of value loss. Plan a longer hold.
- Cabarrus County population projected at +44% by 2050 — long-run rental-demand tailwind backs the buy-and-hold thesis.
Negotiation context
- It's been on market 61 days — a 6% lower offer ($108k) is reasonable based on typical stale-listing flexibility.
- 2 sale attempts since 2y ago; this cycle's ask has dropped $25k (18%) from the opening price — seller is motivated, your offer sets the floor, not the list.
Risks & watch-outs
- Watch-outs: built in 1920 — expect roof / HVAC / electrical / plumbing capex.
- Climate carrying-cost: moderate wind risk, 22% chance of damaging wind over 30y; extreme-heat days projected 7→17/yr by 2055 (HVAC capex compounding) — expect insurance premiums to compound above CPI over the hold.
Questions for the listing agent
- It's been on market 61 days. Have you received any prior offers? Is the seller open to a 6% concession, seller financing, or rate buy-down credit?
- Built in 1920 — when were the roof, HVAC, electrical panel, plumbing, and water heater last replaced?
- Why hasn't it sold? Are there any deal-killer items the seller is aware of (foundation, flood, title, zoning, code violations)?
- Is there a deadline driving the sale (1031 exchange, divorce, estate, relocation)? That informs how much negotiation room exists.
- Schools are F-rated, which usually means shorter tenancies and higher turnover. Who's the typical renter profile here, and what's been the actual vacancy rate?
- What's the average days-on-market for RENTAL listings here right now (not sales)? A rising rental-DOM trend means longer vacancies and softer asking-rent achievability than the comps imply.
- What's the recent tenant-quality profile in this submarket — average credit score on applications, eviction rate, late-payment / NSF rate, and stable-employment percentage? A property-management company in the area should have these aggregated.
- How much new for-sale + rental construction is in the pipeline within 1–3 miles? Heavy new supply typically softens prices + rents 12–24 months out; constrained supply supports both.
Investment metrics
- 1% rule
- 1.22% ✓
- Cap rate
- 9.37%
- Cash-on-cash
- 11.00%
- DSCR
- 1.49
- GRM
- 6.8
CMA / ARV
- ARV (on-the-fly)
- $224,664
- Comps found
- 6
Show comp detail 6 sales within ~0.75 mi
| Address | Dist | Beds/Ba | Sqft | Sold | Price | $/sf | Match |
|---|---|---|---|---|---|---|---|
| 904 Indiana St | 0.03mi | 2/2.0 | 881 (-1%) | 14mo | $220,000 | $250 | 82 |
| 2105 Florida Ave | 0.48mi | 2/1.0 | 925 (+4%) | 11mo | $205,000 | $222 | 61 |
| 610 Eddleman Rd | 0.23mi | 3/2.0 (+1) | 1,008 (+14%) | 2mo | $255,000 | $253 | 57 |
| 313 Villa St | 0.74mi | 3/2.0 (+1) | 888 (0%) | 13mo | $238,000 | $268 | 46 |
| 705 Michigan St | 0.70mi | 2/1.0 | 805 (-9%) | 16mo | $225,000 | $280 | 38 |
| 523 Eastway Ave | 0.55mi | 3/1.5 (+1) | 1,007 (+13%) | 15mo | $240,000 | $238 | 32 |
Match score weights: distance 35% · size 25% · config 20% · recency 20%. Top-matched comps best support the ARV.
Projected returns pro-forma
-3.0% appreciation · 2.15% rent growth · sell at horizon
- IRR
- -0.8%
- Equity multiple
- 0.97×
- Total profit
- $-989
- Equity at exit
- $17,147
- IRR
- 7.9%
- Equity multiple
- 1.58×
- Total profit
- $18,679
- Equity at exit
- $9,943
Cash invested: $32,200 (down + closing). Projections, not guarantees.
Landlord ↔ Tenant lean methodology
- Overall (STATE)
- 85 Strongly Landlord-Friendly
- State North Carolina
- 85 Strongly Landlord-Friendly · R+3
- County
- — inherits STATE
- City
- — inherits STATE
ZIP-level market 28083
- Rents YoY
- 2.1%
- Active inventory
- 140
- Price-to-rent
- 6.8×
Monthly cashflow live
- Estimated rent
- $1,407 high interval (Pro) →
- Mortgage (P&I)
- −$603
- Tax from tax record
- −$165 /mo · $1,985/yr
- Insurance
- −$48
- HOA
- −$0
- Vacancy / Maint / Mgmt
- −$295
- Net cashflow
- $295
Break-even live
UW: 25.0% down · 7.5% · 30yr · 1.5% tax · 5.0% vac · 8.0% maint · 8.0% mgmt
Financing live
Cash to close
- Down payment
- $28,750
- Closing costs
- $3,450
- Reserves months
- —
- Total cash needed
- —
Loan-product check · same deal, 3 products live
Conventional
25% down · 7.5% · 30yr
- Down + closing
- —
- Monthly P&I
- —
- Monthly cashflow
- —
- DSCR
- —
- Eligible?
- —
Personal DTI + credit; lowest rate.
DSCR
20% down · 8.5% · 30yr
- Down + closing
- —
- Monthly P&I
- —
- Monthly cashflow
- —
- DSCR
- —
- Eligible?
- —
No personal income docs; deal must DSCR.
Hard money
10% down · 12.0% · 12mo
- Down + closing
- —
- Monthly P&I
- —
- Monthly cashflow
- —
- DSCR
- —
- Eligible?
- —
Short-term bridge; refi at stabilization.
Rent comps 25 comps
| Address | Beds | Baths | Sqft | Rent | $/sqft | DOM | Units | Dist |
|---|---|---|---|---|---|---|---|---|
| 1700 Inspired Way Kannapolis, NC | 2.0 | 1.5 | 1105 | $1,342 | $1.21 | 22d | 2 | 0.16mi |
| 1701 Oakcrest Dr Kannapolis, NC | 2.0–3.0 | 2.0 | 1104 | $1,206 | $1.09 | 3d | 12 | 0.68mi |
| 1065 Ridgeway Dr Kannapolis, NC | 1.0–3.0 | 1.0–2.0 | 1003 | $1,190 | $1.19 | 24d | 1 | 0.75mi |
| 1017 McLain Rd Kannapolis, NC | 3.0 | 2.0 | 1046 | $1,600 | $1.53 | 2d | 1 | 0.77mi |
| 1100 Coopers Ridge Dr Kannapolis, NC | 3.0 | 1.0–2.0 | 765 | $1,292 | $1.69 | 2d | 25 | 0.79mi |
| 300 Sandy Ct Kannapolis, NC | 1.0–2.0 | 1.0 | 854 | $1,254 | $1.47 | 24d | 1 | 0.81mi |
| 710 Irene Ave Unit A Kannapolis, NC | 3.0 | 2.0 | 1064 | $1,700 | $1.60 | 24d | 1 | 0.83mi |
| 2676 White Oak Ln Kannapolis, NC | 2.0 | 1.5 | 925 | $1,245 | $1.35 | 24d | 1 | 0.90mi |
| 2672 White Oak Ln Kannapolis, NC | 2.0 | 1.5 | 925 | $1,245 | $1.35 | 18d | 1 | 0.91mi |
| 2704 White Oak Ln Kannapolis, NC | 2.0 | 1.5 | 925 | $1,245 | $1.35 | 18d | 1 | 0.91mi |
| 2202 S Main St Kannapolis, NC | 2.0 | 1.0 | 800 | $1,000 | $1.25 | 24d | 1 | 0.95mi |
| 2744 White Oak Ln Kannapolis, NC | 2.0 | 1.0 | 896 | $1,245 | $1.39 | 20d | 1 | 0.96mi |
| 2740 White Oak Ln Kannapolis, NC | 2.0 | 1.0 | 896 | $1,245 | $1.39 | 2d | 1 | 0.96mi |
| 2740 White Oak Ln Kannapolis, NC | 2.0 | 1.0 | 896 | $1,245 | $1.39 | 5d | 1 | 0.96mi |
| 121 Briarcliff Dr Kannapolis, NC | 2.0 | 1.0 | 800 | $950 | $1.19 | 24d | 1 | 0.99mi |
| 1904 Duke Adam St Kannapolis, NC | 3.0 | 2.0 | 1032 | $1,670 | $1.62 | 12d | 1 | 1.01mi |
| 1903 Duke Adam St Kannapolis, NC | 3.0 | 2.0 | 1125 | $1,799 | $1.60 | 3d | 1 | 1.04mi |
| 760 Hillside St Kannapolis, NC | 2.0 | 2.5 | 1008 | $1,495 | $1.48 | 12d | 1 | 1.08mi |
| 1425 Mount Olivet Rd Kannapolis, NC | 1.0–3.0 | 1.0–2.0 | 1083 | $1,291 | $1.19 | 24d | 1 | 1.20mi |
| 648 Wilson St Kannapolis, NC | 1.0 | 1.0 | 650 | $800 | $1.23 | 12d | 1 | 1.23mi |
| 310 Pineview St Unit NA Kannapolis, NC | 2.0 | 1.0 | 813 | $1,650 | $2.03 | 18d | 1 | 1.25mi |
| 310 Pineview St Kannapolis, NC | 2.0 | 1.0 | 813 | $1,599 | $1.97 | 11d | 1 | 1.25mi |
| 531 Park St Kannapolis, NC | 2.0 | 1.5 | 1050 | $1,235 | $1.18 | 24d | 1 | 1.27mi |
| 530 Walter St Kannapolis, NC | 2.0 | 1.5 | 1050 | $1,350 | $1.29 | 24d | 1 | 1.29mi |
| 528 Walter St Kannapolis, NC | 2.0 | 1.5 | 1050 | $1,350 | $1.29 | 24d | 1 | 1.30mi |
Listing history 17 events
-
2026-06-18days on market $115,000 Active 61 DOM
-
2026-06-17pricedays on market $115,000 Active 60 DOM
-
2026-06-16days on market $133,000 Active 59 DOM
-
2026-06-15days on market $133,000 Active 58 DOM
-
2026-06-13days on market $133,000 Active 56 DOM
-
2026-06-09days on market $133,000 Active 52 DOM
-
2026-06-08days on market $133,000 Active 51 DOM
-
2026-06-07statusdays on market $133,000 Active 50 DOM
-
2026-06-04days on market $133,000 Active Under Contract 47 DOM
-
2026-06-03days on market $133,000 Active Under Contract 46 DOM
-
2026-06-02days on market $133,000 Active Under Contract 45 DOM
-
2026-06-01days on market $133,000 Active Under Contract 44 DOM
-
2026-05-31days on market $133,000 Active Under Contract 43 DOM
-
2026-05-15historical Active Under Contract
-
2026-05-05price $133,000
-
2026-04-18$140,000 Active
-
2024-07-10$130,000 Active
ⓘ Source: listings_history table (triggers on properties + properties_extension) + one-shot
backfill from property_details.listing_events for pre-trigger history.
Tax reassessment forecast NC · Resets to sale price
- Current annual tax
- $1,985 · $165/mo
- Projected year-2 tax
- $1,985 · $165/mo
- Expected delta
- $0/yr ($0/mo · -0.0%)
ⓘ Screening estimate from a state-policy table — verify with the county assessor before closing.
Climate risk First Street
- Flood 1/10 Low FEMA zone X (unshaded) · 0% chance over 30 yrs
- Wildfire 1/10 Low
- Heat 6/10 Major 7 d/yr ≥105°F today · 17 d/yr by 30 yrs out
- Wind 5/10 Major 22% chance of damaging wind over 30 yrs
- Air quality 2/10 Low 1 unhealthy d/yr today · 3 by 30 yrs out
Nearby sold comps map
Loading sold comps map…
Walkable amenities ~0.75 mi
Loading nearby amenities…
Taxation est. · year 1
- Rental income
- $16,886
- − Mortgage interest
- −$6,442
- − Property taxes
- −$1,985
- − Insurance
- −$575
- − Repairs & maintenance
- −$1,351
- − Management
- −$1,351
- − Depreciation
- −$3,345
- Taxable income
- $1,837
- Est. tax owed @ 24.0%
- −$441
- After-tax cash flow
- $3,102/yr
For passive investors: Depreciation is non-cash, so a rental often shows a tax loss while cash-flowing — sheltering income. Rental losses are passive: they offset passive income freely, and up to $25,000/yr can offset ordinary (W-2) income if you actively participate and your MAGI is under $100k (phasing out to $0 by $150k); unused losses carry forward. On sale, claimed depreciation is recaptured at up to 25%, and gains may owe capital-gains tax (a 1031 exchange can defer both). Figures are a year-1 estimate at your 24.0% rate — not tax advice; consult a CPA.
Schools (NCES district)
- District
- Kannapolis City Schools
- NCES district ID
- 3702430
- Math proficiency
- 30% ▲ 7.00%
- Reading proficiency
- 33% ▼ -2.00%
- Median HH income
- $38,534
- Composite
- 26.34/100
- National rank
- #7237
- State rank
- #141 of 178 in NC
Livability — Kannapolis
- Score
- 64/100
- State rank
- #354
- US rank
- #14030
Category grades
Schools grade is shown separately in the Schools card above.
Census & demographics
- Census place
- Kannapolis, NC
- County
- Cabarrus County · 218,793 people
- City population
- 57,170
- Metro
- Charlotte-Concord-Gastonia, NC-SC
- Population (ZIP)
- 28,095
- Household income
- $66,257
- Rent vs Own
- Severe rent burden
- 633.0
Population outlook (Cabarrus County) Hauer SSP2
- Today (2025)
- 239,273 people
- By 2030
- 260,754 · +9.0%
- By 2040
- 303,953 · +27.0%
- By 2050
- 344,827 · +44.1%
- By 2075
- 435,623 · +82.1%
- By 2100
- 490,119 · +104.8%
Race, ethnicity, and origin ACS 2023
- Neighborhood character
- Diverse neighborhood (Simpson 0.61)
- Race & ethnicity
- White 55% Black 25% Hispanic / Latino 16% Two or more races 5% Asian 1%
- Hispanic origin (detail)
- Mexican 11% Puerto Rican 3%
- Common ancestry
- Slovak 2% Serbian 1% Lithuanian 1%
- Foreign-born
- 8% · Canada
- Languages at home
- 85% English-only · Spanish 13% Tagalog/Filipino 1% Other Indo-European 1%
Political lean MEDSL · Cabarrus
- 2024 margin
- Lean R (+7.7) · D 45.5% · R 53.2% · Other 1.3%
- 2008→2024 swing
- +10.7pp toward D · 2008: -18.4pp · 2024: -7.7pp
- All cycles
- 2024: R+7.7 2020: R+9.4 2016: R+20.0 2012: R+20.2 2008: R+18.4
Not yet ingested
- Civics
- —
Market trends
- HPI YoY
- ▼ -318.30%
- Current HPI
- 307.0675
- Rent YoY
- ▲ 2.15%
- Metro
- Charlotte-Concord-Gastonia, NC-SC
- State GDP YoY
- ▲ 3.28%
- F500 in state
- 26
Industry mix (Fortune 500 HQ in NC)
| Industry | F500 HQs | Revenue |
|---|---|---|
| Financial Services | 2 | $213B |
|
||
| Retail | 2 | $95B |
|
||
| Industrial Conglomerate | 1 | $38B |
|
||
| Metals / Steel | 1 | $35B |
|
||
| Utilities | 1 | $30B |
|
||
| Industrial Machinery | 1 | $19B |
|
||
Price history
+2.3% since first listed4 events — show timeline
- 2026-05-15 Contingent — CANOPYMLS as Distributed by MLS Grid
- 2026-05-05 Price Changed $133,000 CANOPYMLS as Distributed by MLS Grid
- 2026-04-18 Listed $140,000 CANOPYMLS as Distributed by MLS Grid
- 2024-07-10 Listed $130,000 CANOPYMLS as Distributed by MLS Grid
Property tax history
+3.8%/yrLatest (2025): $1,985 · +0.0% YoY. Source: county tax records.
Cash-flow waterfall
monthlySold comps — $/sqft
last 12 mo · ≤1 miLoading sold comps…