 Duplex
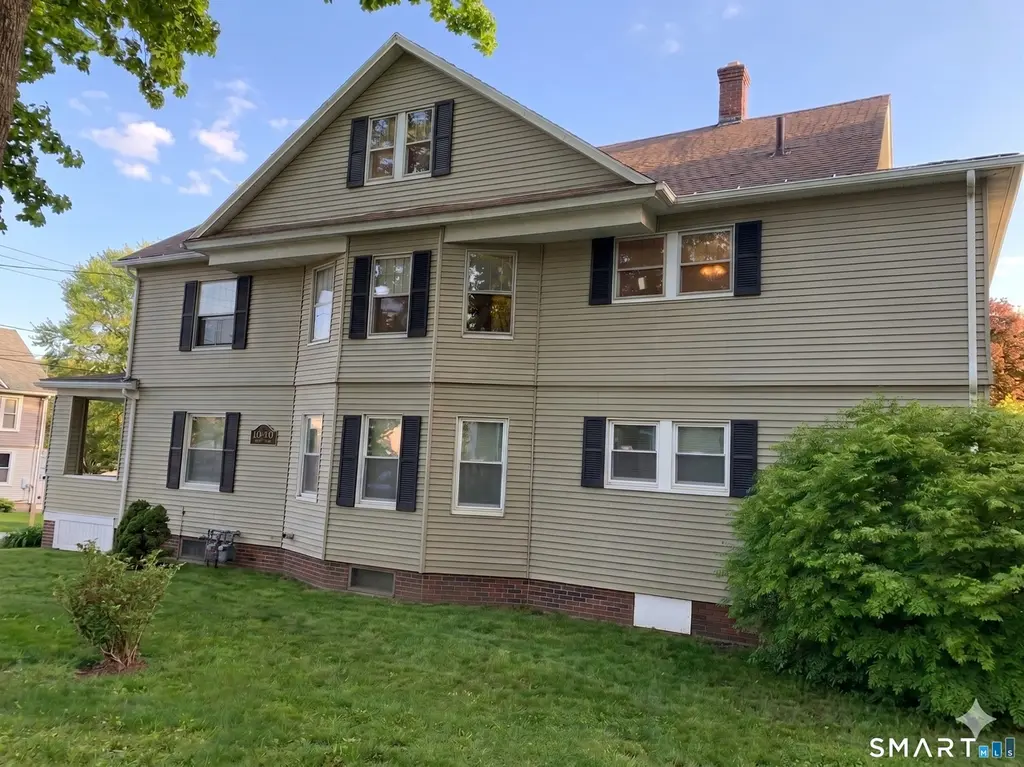
44 Bird St · Torrington, CT
Flood risk 8/10 · Major
- FEMA flood zone
- X
- Chance of flooding over 30 yrs
- 0.99%
- Est. flood insurance / yr
- $473 – $860
Fire risk 3/10 · Minor
- Est. fire insurance / yr
- $829 – $1,539
Heat risk 4/10 · Minor
- Hot days now (above 93°F)
- 7 days/yr
- Hot days in 30 yrs
- 17 days/yr
Wind risk 5/10 · Moderate
- Chance of severe wind over 30 yrs
- 26.0%
Air-quality risk 2/10 · Minimal
- Unhealthy air days now
- 1 days/yr
- Unhealthy air days in 30 yrs
- 1 days/yr
Risk factors via First Street. Map © Google.
Why this score? — see what drove the D+ grade
The composite is a weighted blend of 9 inputs, each scored 0–100. Each bar is that input's sub-score; the figure is the points it added to the 100-point composite (weight × sub-score).
- Cash flow +15.8/30.0
- ARV discount +7.2/15.0
- DSCR +4.9/10.0
- 1% rule +4.2/10.0
- Rent growth +4.0/5.0
- Livability +3.8/5.0
- Schools +2.7/10.0
- Condition / age +2.5/5.0
- Appreciation +0.0/10.0
$380,000
🖨 Deal sheet (PDF) 📄 Offer letter ✓ Due diligence
Multi-family units
County records classify this as Multi-Family (2-4 Unit). Listing-text estimate: 2 units. confirmed
Listing remarks MLS
Great opportunity to invest or live on one floor and rent out the other!!-Bright and spacious apartments with character--Plenty of storage space--Each unit has laundry hook-ups, hardwood floors--Great location!!-- Plenty of off street parking---Convenient location to shops and Rt 8.
Key facts
- Brand new roof
- Newly paved driveway
- Updated vinyl floor
Tags
Property features AI
Finance
- Financial info: Assessed value listed
Exterior
- Parking: Detached garage; Driveway parking; 6 total parking spaces; 2-car garage (detached)
- Utilities: Public water connected; Public sewer connected
- Home design: 2-family multi-family property
- Construction: Frame construction; Vinyl siding; Asphalt shingle roof; Concrete foundation
- Exterior features: Level lot; Paved driveway
Interior
- Bedrooms: 4 bedrooms (multi-family total)
- Bathrooms: 2 full bathrooms
- Heating & cooling: Hot water heating with radiators; Window air conditioning units; Gas available in street for heating; 30‑gallon hot water tank
- Interior features: 12 total rooms; Full basement; Walk-up attic
Neighborhood map
What this means for you Summary
Snapshot
- This is a 2 × 2-bed/1.0-bath units multifamily listed at $380k.
Deal economics
- At list price, monthly cash flow is $119 ($1k/yr) — positive. Per door: $59/mo.
- The deal already cash-flows at list — no discount required.
- To meet the 1% rule (rent ≥ 1% of price), the offer needs to be $350k (8.0% below list).
- Recommended offer: $350k (8.0% below list) — sets the bar for 1% rule.
- Cap rate 6.8% vs local median 4.0% in Torrington — top-decile yield for the area; either an underpriced asset or a hidden risk that comps aren't pricing in. Stress-test before assuming the spread holds.
Location & tenants
- Location reads 76/100 on livability (#53 in CT, #3,449 nationally) — a middle-class / working-renter tenant base. Strengths: crime A+, cost of living A+, housing A+; Watch: commute F.
- Torrington School District (town): math 22% / reading 39% proficiency, ranked #125 of 153 in CT (top 82%) — families likely to look elsewhere, expect single-tenant / working-renter base with shorter leases.
- Zoned schools: Torringford School (math 32% / reading 32%, grade F, #361 of 553 statewide, top 68%, 612 students, 62% FRL); Torrington Middle School (math 18% / reading 39%, grade F, #146 of 175 statewide, top 84%, 975 students, 61% FRL); Torrington High School (math 22% / reading 47%, grade F, #121 of 194 statewide, top 64%, 1,010 students, 57% FRL) — zoned schools average 60% FRL vs 40% district-wide (20 pts higher); higher-poverty schools than district average — tighter screening recommended.
- Market conditions: Rents rising fast (+5.9%/yr); 189 active listings in the ZIP; 6 comparable units currently listed for rent nearby; rentals lingering (median 46d on market — plan ~5-8 weeks vacancy on turnover, expect pricing pressure); 100% of comp listings sitting > 30 days — soft ceiling on asking rent; 154 units permitted in Northwest Hills Planning Region in 2024 (6 in 5+ unit buildings).
- At $3,496/mo this rent would consume 59% of the median local household income ($71k/yr) (locally 1401% of renters already pay >50% of income on rent) — very limited rent-growth headroom before tenants either downsize or default.
Forward outlook
- Local home prices are declining (-3.0%/yr); year-one equity from $3k of loan paydown is wiped out by about $11k of value loss. Plan a longer hold.
Negotiation context
- It's been on market 30 days — a 2% lower offer ($374k) is reasonable based on typical stale-listing flexibility.
- 2 sale attempts since 6y ago; this cycle's ask has dropped $29k (7%) from the opening price — seller is motivated, your offer sets the floor, not the list.
- Current owner paid $140k; list at $380k implies a 171% gain — meaningful room to come down on a strong offer.
Risks & watch-outs
- Watch-outs: flood insurance adds $56/mo; built in 1930 — expect roof / HVAC / electrical / plumbing capex.
- Climate carrying-cost: severe flood risk; moderate wind risk, 26% chance of damaging wind over 30y — expect insurance premiums to compound above CPI over the hold.
Questions for the listing agent
- Can we see the unit-by-unit rent roll, current vacancy, and any below-market leases? What's the average tenancy length?
- What capital expenditures (roof, boiler, parking lot, exteriors) have been made in the last 5 years, and what's planned in the next 2?
- Built in 1930 — when were the roof, HVAC, electrical panel, plumbing, and water heater last replaced?
- What's the actual annual flood-insurance premium (NFIP or private), and is the property in a SFHA with mandatory coverage?
- Is there a deadline driving the sale (1031 exchange, divorce, estate, relocation)? That informs how much negotiation room exists.
- Schools are D-rated, which usually means shorter tenancies and higher turnover. Who's the typical renter profile here, and what's been the actual vacancy rate?
- The area grade is low — what's the realistic commute time and amenity access for the typical tenant pool here? Any planned neighborhood developments (good or bad) we should know about?
- What's the average days-on-market for RENTAL listings here right now (not sales)? A rising rental-DOM trend means longer vacancies and softer asking-rent achievability than the comps imply.
- What's the recent tenant-quality profile in this submarket — average credit score on applications, eviction rate, late-payment / NSF rate, and stable-employment percentage? A property-management company in the area should have these aggregated.
- How much new apartment / multifamily construction is in the pipeline within 1–3 miles? Heavy new supply (>2% of stock underway) typically softens rents 12–24 months out; light construction supports rent growth.
Investment metrics
- 1% rule
- 0.92% ✗
- Cap rate
- 6.84%
- Cash-on-cash
- 1.97%
- DSCR
- 1.09
- GRM
- 9.1
CMA / ARV
- ARV (on-the-fly)
- $377,804
- Comps found
- 8
Show comp detail 8 sales within ~0.75 mi
| Address | Dist | Beds/Ba | Sqft | Sold | Price | $/sf | Match |
|---|---|---|---|---|---|---|---|
| 168 Brightwood Ave | 0.30mi | 4/2.0 | 2,912 (+1%) | 23mo | $306,000 | $105 | 65 |
| 409 Brightwood Ave | 0.53mi | 4/2.0 | 2,621 (-9%) | 2mo | $260,000 | $99 | 58 |
| 110 E Elm St | 0.47mi | 5/2.0 (+1) | 2,678 (-7%) | 9mo | $350,000 | $131 | 54 |
| 605 Prospect St | 0.64mi | 5/2.0 (+1) | 2,888 (+0%) | 20mo | $375,000 | $130 | 48 |
| 89 Hillside Ave | 0.24mi | 5/3.0 (+1) | 3,293 (+14%) | 14mo | $465,000 | $141 | 44 |
| 585 Prospect St | 0.63mi | 5/2.5 (+1) | 2,823 (-2%) | 19mo | $375,000 | $133 | 44 |
| 138 Harwinton Ave | 0.73mi | 4/2.0 | 2,549 (-12%) | 10mo | $350,000 | $137 | 38 |
| 25 Lorenzo St | 0.61mi | 5/2.0 (+1) | 2,496 (-14%) | 8mo | $255,000 | $102 | 38 |
Match score weights: distance 35% · size 25% · config 20% · recency 20%. Top-matched comps best support the ARV.
Projected returns pro-forma
-3.0% appreciation · 5.89% rent growth · sell at horizon
- IRR
- -10.9%
- Equity multiple
- 0.59×
- Total profit
- $-43,493
- Equity at exit
- $56,659
- IRR
- 2.1%
- Equity multiple
- 1.17×
- Total profit
- $17,663
- Equity at exit
- $32,855
Cash invested: $106,400 (down + closing). Projections, not guarantees.
Landlord ↔ Tenant lean methodology
- Overall (STATE)
- 27 Tenant-Leaning
- State Connecticut
- 27 Tenant-Leaning · D+7
- County
- — inherits STATE
- City
- — inherits STATE
ZIP-level market 06790
- Rents YoY
- 5.9%
- Active inventory
- 189
- Price-to-rent
- 18.1×
Monthly cashflow live
- Estimated rent
- $3,496 high interval (Pro) →
- Mortgage (P&I)
- −$1,993
- Tax from tax record
- −$436 /mo · $5,238/yr
- Insurance
- −$158
- Flood insurance flood zone
- −$56 /mo · $666/yr
- HOA
- −$0
- Vacancy / Maint / Mgmt
- −$734
- Net cashflow
- $119
Break-even live
Sensitivity live
| Price | -10% $334 | -5% $226 | +0% $119 | +5% $11 | +10% $-96 |
|---|---|---|---|---|---|
| Rent | -10% $-157 | -5% $-19 | +0% $119 | +5% $257 | +10% $395 |
| Rate | -1.0pp $310 | -0.5pp $215 | base $119 | +0.5pp $20 | +1.0pp $-80 |
2-unit breakdown (identical units grouped — click to expand)
| Units | Beds | Baths | Est. rent |
|---|---|---|---|
| 2× units | 2 | 1 | $3,496 |
| #1 | 2 | 1 | $1,748 |
| #2 | 2 | 1 | $1,748 |
| Total (2 units) | $3,496 | ||
UW: 25.0% down · 7.5% · 30yr · 1.5% tax · 5.0% vac · 8.0% maint · 8.0% mgmt
Financing live
Cash to close
- Down payment
- $95,000
- Closing costs
- $11,400
- Reserves months
- —
- Total cash needed
- —
Loan-product check · same deal, 3 products live
Conventional
25% down · 7.5% · 30yr
- Down + closing
- —
- Monthly P&I
- —
- Monthly cashflow
- —
- DSCR
- —
- Eligible?
- —
Personal DTI + credit; lowest rate.
DSCR
20% down · 8.5% · 30yr
- Down + closing
- —
- Monthly P&I
- —
- Monthly cashflow
- —
- DSCR
- —
- Eligible?
- —
No personal income docs; deal must DSCR.
Hard money
10% down · 12.0% · 12mo
- Down + closing
- —
- Monthly P&I
- —
- Monthly cashflow
- —
- DSCR
- —
- Eligible?
- —
Short-term bridge; refi at stabilization.
Rent comps 6 comps
| Address | Beds | Baths | Sqft | Rent | $/sqft | DOM | Units | Dist |
|---|---|---|---|---|---|---|---|---|
| 58 E Pearl St Torrington, CT | 4.0 | 2.0 | 2588 | $2,300 | $0.89 | 45d | 1 | 0.49mi |
| 66 Forest Ct Torrington, CT | 4.0 | 1.5 | 3328 | $2,500 | $0.75 | 45d | 1 | 0.87mi |
| 20 Taylor St Torrington, CT | 3.0 | 1.0 | 2614 | $1,700 | $0.65 | 45d | 1 | 1.01mi |
| 18 Taylor St Torrington, CT | 3.0 | 1.0 | 2614 | $1,700 | $0.65 | 45d | 1 | 1.01mi |
| 70 Woodbine St Unit 2 Torrington, CT | 3.0 | 1.0 | 3120 | $1,700 | $0.54 | 45d | 1 | 1.15mi |
| 70 Woodbine St Unit 1 Torrington, CT | 3.0 | 1.0 | 3120 | $1,800 | $0.58 | 45d | 1 | 1.15mi |
Listing history 22 events
-
2026-06-18status $380,000 Under Contract 30 DOM
-
2026-06-18days on market $380,000 Active 30 DOM
-
2026-06-17days on market $380,000 Active 29 DOM
-
2026-06-16days on market $380,000 Active 28 DOM
-
2026-06-15days on market $380,000 Active 27 DOM
-
2026-06-14days on market $380,000 Active 25 DOM
-
2026-06-13days on market $380,000 Active 24 DOM
-
2026-06-10days on market $380,000 Active 22 DOM
-
2026-06-09pricedays on market $380,000 Active 21 DOM
-
2026-06-08days on market $390,000 Active 20 DOM
-
2026-06-07days on market $390,000 Active 19 DOM
-
2026-06-05days on market $390,000 Active 16 DOM
-
2026-06-03days on market $390,000 Active 15 DOM
-
2026-06-02days on market $390,000 Active 14 DOM
-
2026-06-01pricedays on market $390,000 Active 13 DOM
-
2026-05-31days on market $399,000 Active 12 DOM
-
2026-05-30days on market $399,000 Active 11 DOM
-
2026-05-18$409,000 Active
-
2020-10-26soldstatus $140,000 Closed 283-char remark
Show marketing remark (283 chars)
Great opportunity to invest or live on one floor and rent out the other!!-Bright and spacious apartments with character--Plenty of storage space--Each unit has laundry hook-ups, hardwood floors--Great location!!-- Plenty of off street parking---Convenient location to shops and Rt 8.
-
2020-10-26soldstatus $140,000
Show marketing remark (283 chars)
Great opportunity to invest or live on one floor and rent out the other!!-Bright and spacious apartments with character--Plenty of storage space--Each unit has laundry hook-ups, hardwood floors--Great location!!-- Plenty of off street parking---Convenient location to shops and Rt 8.
-
2020-09-18historical Under Contract - Continue to Show 283-char remark
Show marketing remark (283 chars)
Great opportunity to invest or live on one floor and rent out the other!!-Bright and spacious apartments with character--Plenty of storage space--Each unit has laundry hook-ups, hardwood floors--Great location!!-- Plenty of off street parking---Convenient location to shops and Rt 8.
-
2020-09-16$139,900 Active 283-char remark
Show marketing remark (283 chars)
Great opportunity to invest or live on one floor and rent out the other!!-Bright and spacious apartments with character--Plenty of storage space--Each unit has laundry hook-ups, hardwood floors--Great location!!-- Plenty of off street parking---Convenient location to shops and Rt 8.
ⓘ Source: listings_history table (triggers on properties + properties_extension) + one-shot
backfill from property_details.listing_events for pre-trigger history.
Tax reassessment forecast CT · Partial reset (capped growth)
- Current annual tax
- $5,238 · $436/mo
- Projected year-2 tax
- $6,685 · $557/mo
- Expected delta
- +$1,447/yr (+$121/mo · 27.6%)
ⓘ Screening estimate from a state-policy table — verify with the county assessor before closing.
Climate risk First Street
- Flood 8/10 Severe FEMA zone X · 99% chance over 30 yrs
- Wildfire 3/10 Moderate
- Heat 4/10 Moderate 7 d/yr ≥93°F today · 17 d/yr by 30 yrs out
- Wind 5/10 Major 26% chance of damaging wind over 30 yrs
- Air quality 2/10 Low 1 unhealthy d/yr today · 1 by 30 yrs out
Nearby sold comps map
Loading sold comps map…
Walkable amenities ~0.75 mi
Loading nearby amenities…
Taxation est. · year 1
- Rental income
- $41,952
- − Mortgage interest
- −$21,286
- − Property taxes
- −$5,238
- − Insurance
- −$2,566
- − Repairs & maintenance
- −$3,356
- − Management
- −$3,356
- − Depreciation
- −$11,055
- Taxable loss
- −$4,905
- Est. tax savings @ 24.0%
- +$1,177
- After-tax cash flow
- $2,602/yr
For passive investors: Depreciation is non-cash, so a rental often shows a tax loss while cash-flowing — sheltering income. Rental losses are passive: they offset passive income freely, and up to $25,000/yr can offset ordinary (W-2) income if you actively participate and your MAGI is under $100k (phasing out to $0 by $150k); unused losses carry forward. On sale, claimed depreciation is recaptured at up to 25%, and gains may owe capital-gains tax (a 1031 exchange can defer both). Figures are a year-1 estimate at your 24.0% rate — not tax advice; consult a CPA.
Schools (NCES district)
- District
- Torrington School District
- NCES district ID
- 0904590
- Math proficiency
- 22% ▼ -8.00%
- Reading proficiency
- 39% ▼ -6.00%
- Median HH income
- $53,647
- Composite
- 26.9/100
- National rank
- #7087
- State rank
- #125 of 153 in CT
Livability — Torrington
- Score
- 76/100
- State rank
- #53
- US rank
- #3449
Category grades
Schools grade is shown separately in the Schools card above.
Census & demographics
- Census place
- Torrington, CT
- County
- Litchfield County · 81,203 people
- City population
- 35,566
- Metro
- Torrington, CT
- Population (ZIP)
- 35,566
- Household income
- $70,912
- Rent vs Own
- Severe rent burden
- 1401.0
Population outlook (Northwest Hills County) Hauer SSP2
- By 2040
- 118,998
Race, ethnicity, and origin ACS 2023
- Neighborhood character
- Predominantly White (73%)
- Race & ethnicity
- White 73% Hispanic / Latino 14% Two or more races 8% Black 6% Asian 3%
- Hispanic origin (detail)
- Puerto Rican 5% Dominican 2%
- Common ancestry
- Romanian 8% Lithuanian 5% Slovak 2%
- Foreign-born
- 12% · Canada, South Korea, Jamaica
- Languages at home
- 86% English-only · Spanish 8% Other Indo-European 2% Russian/Polish/Slavic 1%
Political lean MEDSL · Northwest Hills
- 2024 margin
- Toss-up / Even · D 48.6% · R 49.9% · Other 1.6%
- All cycles
- 2024: R+1.3
Not yet ingested
- Civics
- —
Market trends
- HPI YoY
- ▼ -122.78%
- Current HPI
- 208.4818
- Rent YoY
- ▲ 5.89%
- Metro
- Torrington, CT
- State GDP YoY
- ▲ 1.06%
- F500 in state
- 38
Industry mix (Fortune 500 HQ in CT)
| Industry | F500 HQs | Revenue |
|---|---|---|
| Industrial Machinery | 4 | $38B |
|
||
| Insurance | 3 | $71B |
|
||
| Financial Services | 2 | $25B |
|
||
| Transportation / Logistics | 2 | $18B |
|
||
| Healthcare | 1 | $247B |
|
||
| Telecommunications | 1 | $55B |
|
||
Price history
+171.6% since first listed9 events — show timeline
- 2026-06-18 Pending — Smart MLS
- 2026-06-09 Price Changed $380,000 Smart MLS
- 2026-06-01 Price Changed $390,000 Smart MLS
- 2026-05-27 Price Changed $399,000 Smart MLS
- 2026-05-18 Listed $409,000 Smart MLS
- 2020-10-26 Sold (Public Records) $140,000 Public Records
- 2020-10-26 Sold (MLS) $140,000 Smart MLS
- 2020-09-18 Contingent — Smart MLS
- 2020-09-16 Listed $139,900 Smart MLS
Property tax history
+0.3%/yrLatest (2023): $5,238 · +1.7% YoY. Source: county tax records.
Cash-flow waterfall
monthlySold comps — $/sqft
last 12 mo · ≤1 miLoading sold comps…