788 9th Ave Unit 4C · New York, NY
Flood risk 1/10 · Minimal
- FEMA flood zone
- X (unshaded)
- Chance of flooding over 30 yrs
- 0.0%
- Est. flood insurance / yr
- $507 – $1,088
Fire risk 1/10 · Minimal
- Est. fire insurance / yr
- $691 – $1,283
Heat risk 6/10 · Moderate
- Hot days now (above 99°F)
- 7 days/yr
- Hot days in 30 yrs
- 15 days/yr
Wind risk 6/10 · Moderate
- Chance of severe wind over 30 yrs
- 27.0%
Air-quality risk 4/10 · Minor
- Unhealthy air days now
- 5 days/yr
- Unhealthy air days in 30 yrs
- 6 days/yr
Risk factors via First Street. Map © Google.
Why this score? — see what drove the C grade
The composite is a weighted blend of 9 inputs, each scored 0–100. Each bar is that input's sub-score; the figure is the points it added to the 100-point composite (weight × sub-score).
- Cash flow +15.5/30.0
- 1% rule +7.9/10.0
- ARV discount +7.5/15.0
- Appreciation +6.8/10.0
- Schools +5.0/10.0
- DSCR +4.8/10.0
- Livability +3.8/5.0
- Rent growth +3.6/5.0
- Condition / age +2.5/5.0
$479,000
🖨 Deal sheet 📄 Offer letter ✓ Due diligence
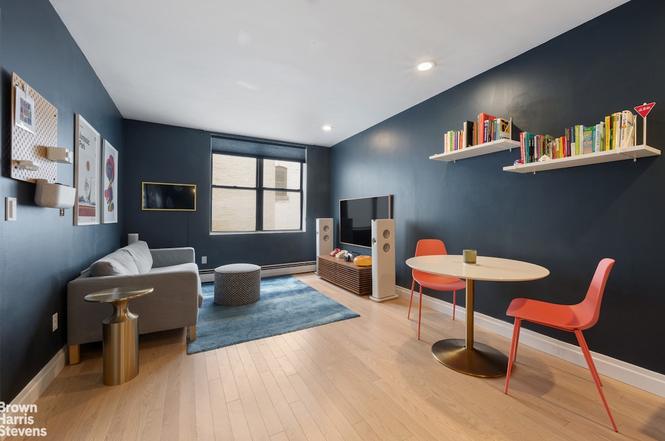
Listing remarks
This beautifully maintained turnkey home features a perfect layout with one generously sized bedroom. Right in the heart of Hell's Kitchen, this apartment is the perfect refuge in a vibrant and exciting neighborhood. Enjoy peaceful living in this exceptionally quiet home. Light colored updated wood flooring only adds to the appeal and openness of the living space. The renovated windowed kitchen has good storage with stainless steel appliances, along with the convenience of a dishwasher. The roomy bedroom has a large closet with overhead storage as well. The large bathroom has been renovated and is in excellent condition . This residence boasts through the wall A/C, with a laundry room in th
Key facts
- Laundry room
- Renovated kitchen
- Video intercom
Tags
Property features AI
Finance
- Other: Pets allowed in building
- HOA & community: Monthly association fee of $1,394
Exterior
- Home design: Entry on 4th level; Exposures to the East and South; Zoned R8
- Exterior features: No notable exterior features listed
Interior
- Bedrooms: Total rooms: 2
- Bathrooms: 1 full bathroom
- Interior features: Basement: Other
- Laundry & utility: No in-building laundry
Neighborhood map
What this means for you Summary
Snapshot
- This is a 1-bed/1.0-bath condo listed at $479k.
Deal economics
- At list price, monthly cash flow is $189 ($2k/yr) — positive.
- The deal already cash-flows at list — no discount required.
- Meets the 1% rule at list price ($6k rent vs $479k).
- Recommended offer: $436k (9.0% below list) — sets the bar for market timing.
- Cap rate 6.8% vs local median 2.6% in New York — top-decile yield for the area; either an underpriced asset or a hidden risk that comps aren't pricing in. Stress-test before assuming the spread holds.
Location & tenants
- Location reads 75/100 on livability (#268 in NY, #4,188 nationally) — a middle-class / working-renter tenant base. Strengths: amenities A+, commute A+, health & safety A; Watch: crime F, cost of living F.
- Market conditions: Rents rising fast (+4.2%/yr); 538 active listings in the ZIP; 40 comparable units currently listed for rent nearby; rentals leasing fast (median 8d on market — plan ~1-2 weeks tenant-placement turnaround); high-income renter base; 4,467 units permitted in New York County in 2024 (4,463 in 5+ unit buildings).
- At $6,194/mo this rent would consume 58% of the median local household income ($129k/yr) (locally 3795% of renters already pay >50% of income on rent) — very limited rent-growth headroom before tenants either downsize or default.
Forward outlook
- In year one you build about $21k of equity ($3k loan paydown + $17k appreciation (3.6% local appreciation)).
- New York County population projected at +21% by 2050 — long-run rental-demand tailwind backs the buy-and-hold thesis.
- At projected returns (3.6% appreciation + 4.2% rent growth), your $134k cash investment doubles in ~5 years — after that, you're playing with house money.
- By year 2, paydown + projected appreciation supports a ~$33k cash-out refi (75% LTV) — recoverable capital for the next deal without selling this one.
Negotiation context
- It's been on market 115 days — a 9% lower offer ($436k) is reasonable based on typical stale-listing flexibility.
- 5 sale attempts since 12y ago with the ask held roughly flat each time — persistent listings suggest the price (not the market) is what's stuck; bring a comps-based counter.
Risks & watch-outs
- Watch-outs: HOA is 23% of rent; built in 1920 — expect roof / HVAC / electrical / plumbing capex.
- Climate carrying-cost: major wind risk, 27% chance of damaging wind over 30y; extreme-heat days projected 7→15/yr by 2055 (HVAC capex compounding) — expect insurance premiums to compound above CPI over the hold.
Questions for the listing agent
- It's been on market 115 days. Have you received any prior offers? Is the seller open to a 9% concession, seller financing, or rate buy-down credit?
- Built in 1920 — when were the roof, HVAC, electrical panel, plumbing, and water heater last replaced?
- What does the HOA fee cover, when was the last increase, and are there any pending special assessments or reserve-fund shortfalls?
- Any open or pending special assessments — roof, HVAC, plumbing, elevator, façade? What's the per-unit balance and payoff schedule, and is the seller paying it off at close or rolling it to the buyer?
- Why hasn't it sold? Are there any deal-killer items the seller is aware of (foundation, flood, title, zoning, code violations)?
- Is there a deadline driving the sale (1031 exchange, divorce, estate, relocation)? That informs how much negotiation room exists.
- Schools are B-rated — typically a magnet for longer-tenancy family renters. What's the average tenant stay here, and is there a school-zone premium baked into asking?
- Crime grade is F in this area — have there been break-ins, vandalism, or insurance claims at this property in the last 3 years? What carrier currently insures it and at what premium?
- What's the average days-on-market for RENTAL listings here right now (not sales)? A rising rental-DOM trend means longer vacancies and softer asking-rent achievability than the comps imply.
- What's the recent tenant-quality profile in this submarket — average credit score on applications, eviction rate, late-payment / NSF rate, and stable-employment percentage? A property-management company in the area should have these aggregated.
- How much new apartment / multifamily construction is in the pipeline within 1–3 miles? Heavy new supply (>2% of stock underway) typically softens rents 12–24 months out; light construction supports rent growth.
Investment metrics
- 1% rule
- 1.29% ✓
- Cap rate
- 6.77%
- Cash-on-cash
- 1.69%
- DSCR
- 1.08
- GRM
- 6.4
CMA / ARV
No comps found within radius.
Projected returns pro-forma
3.61% appreciation · 4.25% rent growth · sell at horizon
- IRR
- 11.7%
- Equity multiple
- 1.70×
- Total profit
- $94,145
- Equity at exit
- $231,955
- IRR
- 14.4%
- Equity multiple
- 3.33×
- Total profit
- $312,861
- Equity at exit
- $370,930
Cash invested: $134,120 (down + closing). Projections, not guarantees.
Landlord ↔ Tenant lean methodology
- Overall (CITY)
- 0 Strongly Tenant-Friendly
- State New York
- 15 Strongly Tenant-Friendly · D+10
- County
- — inherits STATE
- City New York
- 0 Strongly Tenant-Friendly · D+34
ZIP-level market 10019
- Home prices YoY
- 1.5%
- Rents YoY
- 4.2%
- Active inventory
- 538
- Price-to-rent
- 6.4×
Monthly cashflow live
- Estimated rent
- $6,194 high interval (Pro) →
- Mortgage (P&I)
- −$2,512
- Tax est. 1.5%
- −$599 /mo · $7,185/yr
- Insurance
- −$200
- HOA
- −$1,394
- Vacancy / Maint / Mgmt
- −$1,301
- Net cashflow
- $189
Break-even live
UW: 25.0% down · 7.5% · 30yr · 1.5% tax · 5.0% vac · 8.0% maint · 8.0% mgmt
Financing live
Cash to close
- Down payment
- $119,750
- Closing costs
- $14,370
- Reserves months
- —
- Total cash needed
- —
Loan-product check · same deal, 3 products live
Conventional
25% down · 7.5% · 30yr
- Down + closing
- —
- Monthly P&I
- —
- Monthly cashflow
- —
- DSCR
- —
- Eligible?
- —
Personal DTI + credit; lowest rate.
DSCR
20% down · 8.5% · 30yr
- Down + closing
- —
- Monthly P&I
- —
- Monthly cashflow
- —
- DSCR
- —
- Eligible?
- —
No personal income docs; deal must DSCR.
Hard money
10% down · 12.0% · 12mo
- Down + closing
- —
- Monthly P&I
- —
- Monthly cashflow
- —
- DSCR
- —
- Eligible?
- —
Short-term bridge; refi at stabilization.
Rent comps 40 comps
| Address | Beds | Baths | Sqft | Rent | $/sqft | DOM | Units | Dist |
|---|---|---|---|---|---|---|---|---|
| 754 9th Ave Unit 1017471P New York, NY | 1.0 | 1.0 | 538 | $7,284 | $13.54 | 7d | 1 | 0.08mi |
| 311 W 50th St #228 New York, NY | 2.0 | 1.0–2.0 | 669 | $6,470 | $9.67 | 7d | 3 | 0.15mi |
| 254 W 54th St Unit 1026635P New York, NY | 1.0–2.0 | 1.0–2.0 | 860 | $8,040 | $9.34 | 7d | 2 | 0.23mi |
| 250 W 50th St New York, NY | 2.0 | 1.0–2.0 | 784 | $5,866 | $7.48 | 7d | 1 | 0.24mi |
| 500 W 56th St #116 New York, NY | 2.0 | 1.0–2.0 | 680 | $6,190 | $9.10 | 7d | 3 | 0.24mi |
| 550 W 54th St Unit 1243 New York, NY | 1.0–3.0 | 1.0–2.0 | 913 | $6,270 | $6.86 | 7d | 3 | 0.27mi |
| 235 W 48th St #1400 New York, NY | 2.0 | 1.0–2.0 | 687 | $6,270 | $9.12 | 7d | 3 | 0.31mi |
| 622 11th Ave Unit 1402 New York, NY | 2.0 | 1.0 | 715 | $7,600 | $10.63 | 7d | 1 | 0.46mi |
| 160 Central Park S New York, NY | 1.0–3.0 | 1.0–3.5 | 1550 | $9,250 | $5.97 | 7d | 9 | 0.51mi |
| 160 Central Park S New York, NY | 1.0–3.0 | 1.0–3.5 | 1550 | $7,500 | $4.84 | 7d | 10 | 0.51mi |
| 520 W 43rd St #742 New York, NY | 1.0–2.0 | 1.0–2.0 | 769 | $5,860 | $7.62 | 7d | 2 | 0.53mi |
| 450 W 42nd St #1693 New York, NY | 2.0 | 1.0–2.0 | 690 | $9,110 | $13.20 | 1d | 3 | 0.55mi |
| 77 W 55th St Unit 15H New York, NY | 1.0 | 1.0 | 750 | $4,900 | $6.53 | 22d | 1 | 0.55mi |
| 21 W End Ave New York, NY | 2.0–3.0 | 2.0 | 750 | $8,995 | $11.99 | 24d | 2 | 0.56mi |
| 560 W 43rd St New York, NY | 3.0 | 1.0–2.0 | 769 | $5,265 | $6.84 | 7d | 5 | 0.58mi |
| 561 10th Ave #2085 New York, NY | 2.0 | 1.0–2.0 | 795 | $6,345 | $7.98 | 7d | 2 | 0.58mi |
| 400 W 61st St New York, NY | 4.0 | 1.0–4.0 | 1567 | $15,016 | $9.58 | 1d | 48 | 0.61mi |
| 605 W 42nd St Unit 1016142P New York, NY | 2.0 | 1.0–2.0 | 720 | $14,542 | $20.18 | 10d | 2 | 0.61mi |
| 555 10th Ave Unit 1018807P New York, NY | 1.0 | 1.0 | 688 | $9,726 | $14.14 | 22d | 1 | 0.62mi |
| 635 W 42nd St #1990 New York, NY | 1.0–2.0 | 1.0–2.0 | 750 | $5,680 | $7.57 | 7d | 2 | 0.65mi |
| 400 W 63rd St New York, NY | 2.0 | 1.0–2.0 | 874 | $7,477 | $8.55 | 1d | 11 | 0.65mi |
| 70 W 45th St #1131 New York, NY | 1.0–2.0 | 1.0–2.0 | 902 | $5,990 | $6.64 | 7d | 2 | 0.67mi |
| 15 W 55th St #736 New York, NY | 2.0–3.0 | 1.0–2.0 | 1250 | $8,550 | $6.84 | 1d | 2 | 0.67mi |
| 18 W 48th St Unit 670 New York, NY | 1.0 | 1.0 | 631 | $7,730 | $12.25 | 7d | 1 | 0.68mi |
| 101 W End Ave #950 New York, NY | 1.0–2.0 | 1.0–2.0 | 814 | $6,770 | $8.32 | 1d | 2 | 0.69mi |
| 155 W 68th St Unit 18-10 New York, NY | — | 1.0 | 545 | $4,550 | $8.35 | 24d | 1 | 0.80mi |
| 160 Riverside Blvd #832 New York, NY | 1.0 | 1.0 | 634 | $4,990 | $7.87 | 20d | 1 | 0.87mi |
| 360 W 34th St New York, NY | 2.0 | 1.0–1.5 | 632 | $6,100 | $9.65 | 7d | 3 | 0.93mi |
| 180 Riverside Blvd #846 New York, NY | 1.0–2.0 | 1.0–2.0 | 827 | $4,230 | $5.11 | 24d | 2 | 0.93mi |
| 123 E 54th St #1251 New York, NY | 1.0–2.0 | 1.0 | 600 | $5,210 | $8.68 | 1d | 2 | 0.96mi |
| 112 W 72nd St Unit 3B New York, NY | 2.0 | 1.0 | 750 | $5,900 | $7.87 | 24d | 1 | 0.97mi |
| 117 E 57th St New York, NY | 1.0 | 1.0 | 732 | $5,975 | $8.16 | 5d | 2 | 0.98mi |
| 244 W 72nd St #2066 New York, NY | 1.0 | 1.0 | 500 | $5,440 | $10.88 | 24d | 2 | 1.00mi |
| 234 W 73rd St Unit 1031180P New York, NY | 1.0 | 1.0 | 441 | $4,950 | $11.22 | 7d | 1 | 1.05mi |
| 240 W 73rd St New York, NY | 2.0 | 1.0–2.0 | 660 | $6,430 | $9.73 | 24d | 4 | 1.05mi |
| 435 W 31st St New York, NY | 1.0 | 1.0 | 633 | $13,963 | $22.04 | 6d | 27 | 1.05mi |
| 135 E 47th St New York, NY | 1.0 | 1.0 | 572 | $6,600 | $11.53 | 6d | 1 | 1.06mi |
| 150 E 57th St New York, NY | 5.0 | 1.0–7.5 | 2750 | $10,504 | $3.82 | 1d | 5 | 1.06mi |
| 135 E 47th St Unit 22F New York, NY | 1.0 | 1.0 | 700 | $7,500 | $10.71 | 22d | 1 | 1.08mi |
| 160 E 48th St New York, NY | 3.0 | 1.0–2.0 | 878 | $6,993 | $7.96 | 3d | 9 | 1.10mi |
HOA detail condo
- Monthly dues
- $1,394 · $16,728/yr
- Assessments
- None detected in remarks — confirm with the listing agent.
Listing history 21 events
-
2026-06-18days on market $479,000 Active 115 DOM
-
2026-06-17days on market $479,000 Active 114 DOM
-
2026-06-15days on market $479,000 Active 112 DOM
-
2026-06-13days on market $479,000 Active 110 DOM
-
2026-06-10days on market $479,000 Active 106 DOM
-
2026-06-08days on market $479,000 Active 105 DOM
-
2026-06-08days on market $479,000 Active 104 DOM
-
2026-06-04days on market $479,000 Active 101 DOM
-
2026-06-03days on market $479,000 Active 100 DOM
-
2026-06-01days on market $479,000 Active 98 DOM
-
2026-05-31days on market $479,000 Active 97 DOM
-
2026-04-13price $479,000
-
2026-02-23$499,000 Active
-
2021-06-16price $477,500
-
2021-03-30price $495,000
-
2021-03-11status Active
-
2020-11-09price $495,000
-
2020-09-21$495,000
-
2020-09-21$525,000 Active
-
2014-12-09price $425,000
-
2014-10-22$415,000
ⓘ Source: listings_history table (triggers on properties + properties_extension) + one-shot
backfill from property_details.listing_events for pre-trigger history.
Climate risk First Street
- Flood 1/10 Low FEMA zone X (unshaded) · 0% chance over 30 yrs
- Wildfire 1/10 Low
- Heat 6/10 Major 7 d/yr ≥99°F today · 15 d/yr by 30 yrs out
- Wind 6/10 Major 27% chance of damaging wind over 30 yrs
- Air quality 4/10 Moderate 5 unhealthy d/yr today · 6 by 30 yrs out
Nearby sold comps map
Loading sold comps map…
Walkable amenities ~0.75 mi
Loading nearby amenities…
Taxation est. · year 1
- Rental income
- $74,325
- − Mortgage interest
- −$26,831
- − Property taxes
- −$7,185
- − Insurance
- −$2,395
- − Repairs & maintenance
- −$5,946
- − Management
- −$5,946
- − HOA
- −$16,728
- − Depreciation
- −$13,935
- Taxable loss
- −$4,641
- Est. tax savings @ 24.0%
- +$1,114
- After-tax cash flow
- $3,379/yr
For passive investors: Depreciation is non-cash, so a rental often shows a tax loss while cash-flowing — sheltering income. Rental losses are passive: they offset passive income freely, and up to $25,000/yr can offset ordinary (W-2) income if you actively participate and your MAGI is under $100k (phasing out to $0 by $150k); unused losses carry forward. On sale, claimed depreciation is recaptured at up to 25%, and gains may owe capital-gains tax (a 1031 exchange can defer both). Figures are a year-1 estimate at your 24.0% rate — not tax advice; consult a CPA.
Schools (NCES district)
No district data.
Livability — New York
- Score
- 75/100
- State rank
- #268
- US rank
- #4188
Category grades
Schools grade is shown separately in the Schools card above.
Census & demographics
- Census place
- New York, NY
- County
- New York County · 1,599,927 people
- City population
- 7,731,280
- Metro
- New York-Newark-Jersey City, NY-NJ-PA
- Population (ZIP)
- 44,942
- Household income
- $128,559
- Rent vs Own
- Severe rent burden
- 3795.0
Population outlook (New York County) Hauer SSP2
- Today (2025)
- 1,825,725 people
- By 2030
- 1,904,611 · +4.3%
- By 2040
- 2,052,719 · +12.4%
- By 2050
- 2,206,601 · +20.9%
- By 2075
- 2,509,427 · +37.4%
- By 2100
- 2,702,933 · +48.0%
Race, ethnicity, and origin ACS 2023
- Neighborhood character
- Diverse neighborhood (Simpson 0.63)
- Race & ethnicity
- White 55% Asian 18% Hispanic / Latino 17% Two or more races 10% Black 5%
- Hispanic origin (detail)
- Mexican 2% Puerto Rican 3% Dominican 4%
- Common ancestry
- Romanian 4% Lithuanian 4% Scotch-Irish 4%
- Foreign-born
- 34% · Canada, China, South Korea
- Languages at home
- 66% English-only · Spanish 12% Other Indo-European 6% Chinese 5%
Political lean MEDSL · New York
- 2024 margin
- Solid D (+64.8) · D 82.4% · R 17.6%
- 2008→2024 swing
- -7.4pp toward R · 2008: 72.2pp · 2024: 64.8pp
- All cycles
- 2024: D+64.8 2020: D+74.5 2016: D+77.2 2012: D+69.6 2008: D+72.2
Not yet ingested
- Civics
- —
Market trends
- HPI YoY
- ▲ 3.61%
- Current HPI
- 245.1226
- Rent YoY
- ▲ 4.25%
- Metro
- New York-Newark-Jersey City, NY-NJ-PA
- State GDP YoY
- ▲ 2.60%
- F500 in state
- 92
Industry mix (Fortune 500 HQ in NY)
| Industry | F500 HQs | Revenue |
|---|---|---|
| Financial Services | 10 | $950B |
|
||
| Consumer Goods | 9 | $162B |
|
||
| Insurance | 4 | $225B |
|
||
| Telecommunications | 2 | $144B |
|
||
| Pharmaceuticals | 2 | $112B |
|
||
| Media / Entertainment | 2 | $69B |
|
||
Price history
+15.4% since first listed10 events — show timeline
- 2026-04-13 Price Changed $479,000 RLS at REBNY
- 2026-02-23 Listed $499,000 RLS at REBNY
- 2021-06-16 Price Changed $477,500 RLS at REBNY
- 2021-03-30 Price Changed $495,000 RLS at REBNY
- 2021-03-11 Relisted — RLS at REBNY
- 2020-11-09 Price Changed $495,000 RLS at REBNY
- 2020-09-21 Listed $525,000 RLS at REBNY
- 2020-09-21 Listed $495,000 RLS at REBNY
- 2014-12-09 Price Changed $425,000 RLS at REBNY
- 2014-10-22 Listed $415,000 RLS at REBNY
Cash-flow waterfall
monthlySold comps — $/sqft
last 12 mo · ≤1 miLoading sold comps…