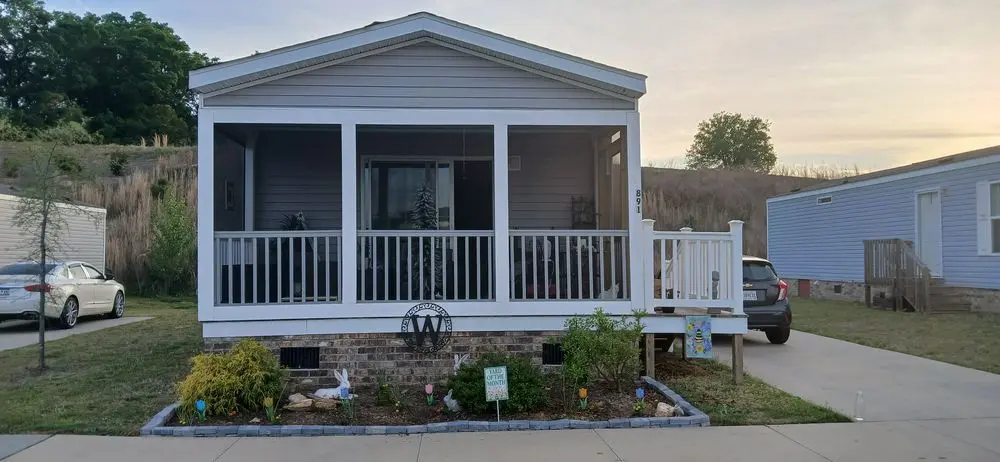
891 Lookout Dr · Arkwright, SC
Flood risk 1/10 · Minimal
- FEMA flood zone
- X (unshaded)
- Chance of flooding over 30 yrs
- 0.0%
- Est. flood insurance / yr
- $507 – $1,088
Fire risk 3/10 · Minor
- Est. fire insurance / yr
- $783 – $1,453
Heat risk 6/10 · Moderate
- Hot days now (above 105°F)
- 7 days/yr
- Hot days in 30 yrs
- 16 days/yr
Wind risk 2/10 · Minimal
- Chance of severe wind over 30 yrs
- 2.0%
Air-quality risk 4/10 · Minor
- Unhealthy air days now
- 4 days/yr
- Unhealthy air days in 30 yrs
- 4 days/yr
Risk factors via First Street. Map © Google.
Why this score? — see what drove the B grade
The composite is a weighted blend of 9 inputs, each scored 0–100. Each bar is that input's sub-score; the figure is the points it added to the 100-point composite (weight × sub-score).
- Cash flow +30.0/30.0
- 1% rule +10.0/10.0
- DSCR +10.0/10.0
- ARV discount +7.5/15.0
- Condition / age +4.0/5.0
- Rent growth +3.4/5.0
- Schools +3.1/10.0
- Livability +2.5/5.0
- Appreciation +0.0/10.0
$62,500
🖨 Deal sheet 📄 Offer letter ✓ Due diligence
Listing remarks
2022 Clayton Manufactured house. 1 bedroom and 1 bath. Vinyl flooring throughout. All appliances stay. Nice screened in front porch. Land lease is approximately $600 per month to include: water, sewage, trash, lawn maintenance. Must pass background check. Cash only unless you want to seek financing from a lender.
Key facts
- Vinyl flooring
- All appliances stay
- Built 2022
Tags
Neighborhood map
What this means for you Summary
Snapshot
- This is a 1-bed/1.0-bath manufactured listed at $62k. Condition is rated good.
Deal economics
- At list price, monthly cash flow is $363 ($4k/yr) — positive.
- The deal already cash-flows at list — no discount required.
- Meets the 1% rule at list price ($1k rent vs $62k).
Location & tenants
- Location reads: area grade B — affects rentability + tenant quality, not the cash-flow math above.
- Spartanburg 07 (urban): math 34% / reading 41% proficiency, ranked #39 of 80 in SC (top 49%) — families likely to look elsewhere, expect single-tenant / working-renter base with shorter leases; 62% free/reduced lunch — lower-income household profile, screen leases tightly.
- Market conditions: Rents rising (+3.5%/yr); 234 active listings in the ZIP; 1 comparable units currently listed for rent nearby; lower-income renter base — watch delinquency; 3,129 units permitted in Spartanburg County in 2024 (40 in 5+ unit buildings).
Forward outlook
- Local home prices are declining (-3.0%/yr); year-one equity from $432 of loan paydown is wiped out by about $2k of value loss. Plan a longer hold.
- Spartanburg County population projected at +18% by 2050 — long-run rental-demand tailwind backs the buy-and-hold thesis.
- At projected returns (-3.0% appreciation + 3.5% rent growth), your $18k cash investment doubles in ~5 years — after that, you're playing with house money.
Negotiation context
- Only 14 days on market — expect competitive offers; lowballing is unlikely to land.
Risks & watch-outs
- Climate carrying-cost: extreme-heat days projected 7→16/yr by 2055 (HVAC capex compounding) — expect insurance premiums to compound above CPI over the hold.
Questions for the listing agent
- Is there a deadline driving the sale (1031 exchange, divorce, estate, relocation)? That informs how much negotiation room exists.
- What's the average days-on-market for RENTAL listings here right now (not sales)? A rising rental-DOM trend means longer vacancies and softer asking-rent achievability than the comps imply.
- What's the recent tenant-quality profile in this submarket — average credit score on applications, eviction rate, late-payment / NSF rate, and stable-employment percentage? A property-management company in the area should have these aggregated.
- How much new for-sale + rental construction is in the pipeline within 1–3 miles? Heavy new supply typically softens prices + rents 12–24 months out; constrained supply supports both.
Investment metrics
- 1% rule
- 1.61% ✓
- Cap rate
- 13.27%
- Cash-on-cash
- 24.91%
- DSCR
- 2.11
- GRM
- 5.2
CMA / ARV
No comps found within radius.
Projected returns pro-forma
-3.0% appreciation · 3.46% rent growth · sell at horizon
- IRR
- 18.9%
- Equity multiple
- 1.77×
- Total profit
- $13,496
- Equity at exit
- $9,319
- IRR
- 27.6%
- Equity multiple
- 3.49×
- Total profit
- $43,550
- Equity at exit
- $5,404
Cash invested: $17,500 (down + closing). Projections, not guarantees.
Landlord ↔ Tenant lean methodology
- Overall (STATE)
- 90 Strongly Landlord-Friendly
- State South Carolina
- 90 Strongly Landlord-Friendly · R+6
- County
- — inherits STATE
- City
- — inherits STATE
ZIP-level market 29306
- Home prices YoY
- -29.9%
- Rents YoY
- 3.5%
- Active inventory
- 234
- Price-to-rent
- 5.2×
Monthly cashflow live
- Estimated rent
- $1,007 medium interval (Pro) →
- Mortgage (P&I)
- −$328
- Tax est. 1.5%
- −$78 /mo · $938/yr
- Insurance
- −$26
- HOA
- −$0
- Vacancy / Maint / Mgmt
- −$211
- Net cashflow
- $363
Break-even live
UW: 25.0% down · 7.5% · 30yr · 1.5% tax · 5.0% vac · 8.0% maint · 8.0% mgmt
Financing live
Cash to close
- Down payment
- $15,625
- Closing costs
- $1,875
- Reserves months
- —
- Total cash needed
- —
Loan-product check · same deal, 3 products live
Conventional
25% down · 7.5% · 30yr
- Down + closing
- —
- Monthly P&I
- —
- Monthly cashflow
- —
- DSCR
- —
- Eligible?
- —
Personal DTI + credit; lowest rate.
DSCR
20% down · 8.5% · 30yr
- Down + closing
- —
- Monthly P&I
- —
- Monthly cashflow
- —
- DSCR
- —
- Eligible?
- —
No personal income docs; deal must DSCR.
Hard money
10% down · 12.0% · 12mo
- Down + closing
- —
- Monthly P&I
- —
- Monthly cashflow
- —
- DSCR
- —
- Eligible?
- —
Short-term bridge; refi at stabilization.
Rent comps 1 comps
| Address | Beds | Baths | Sqft | Rent | $/sqft | DOM | Units | Dist |
|---|---|---|---|---|---|---|---|---|
| 180 S Pine Lake Dr Spartanburg, SC | 1.0–3.0 | 1.0 | 796 | $899 | $1.13 | 13d | 3 | 1.12mi |
Listing history 11 events
-
2026-06-18days on market $62,500 Active 14 DOM
-
2026-06-17days on market $62,500 Active 13 DOM
-
2026-06-16days on market $62,500 Active 12 DOM
-
2026-06-15days on market $62,500 Active 11 DOM
-
2026-06-14days on market $62,500 Active 9 DOM
-
2026-06-13days on market $62,500 Active 8 DOM
-
2026-06-10days on market $62,500 Active 6 DOM
-
2026-06-09days on market $62,500 Active 5 DOM
-
2026-06-08days on market $62,500 Active 4 DOM
-
2026-06-07remarks 314-char remark
-
2026-06-07$62,500 Active 3 DOM
ⓘ Source: listings_history table (triggers on properties + properties_extension) + one-shot
backfill from property_details.listing_events for pre-trigger history.
Climate risk First Street
- Flood 1/10 Low FEMA zone X (unshaded) · 0% chance over 30 yrs
- Wildfire 3/10 Moderate
- Heat 6/10 Major 7 d/yr ≥105°F today · 16 d/yr by 30 yrs out
- Wind 2/10 Low 2% chance of damaging wind over 30 yrs
- Air quality 4/10 Moderate 4 unhealthy d/yr today · 4 by 30 yrs out
Nearby sold comps map
Loading sold comps map…
Walkable amenities ~0.75 mi
Loading nearby amenities…
Taxation est. · year 1
- Rental income
- $12,080
- − Mortgage interest
- −$3,501
- − Property taxes
- −$938
- − Insurance
- −$312
- − Repairs & maintenance
- −$966
- − Management
- −$966
- − Depreciation
- −$1,818
- Taxable income
- $3,578
- Est. tax owed @ 24.0%
- −$859
- After-tax cash flow
- $3,501/yr
For passive investors: Depreciation is non-cash, so a rental often shows a tax loss while cash-flowing — sheltering income. Rental losses are passive: they offset passive income freely, and up to $25,000/yr can offset ordinary (W-2) income if you actively participate and your MAGI is under $100k (phasing out to $0 by $150k); unused losses carry forward. On sale, claimed depreciation is recaptured at up to 25%, and gains may owe capital-gains tax (a 1031 exchange can defer both). Figures are a year-1 estimate at your 24.0% rate — not tax advice; consult a CPA.
Condition & rehab AI · 10 photos
This Clayton manufactured home is in good condition with a good curb appeal. It has vinyl flooring throughout and is move-in ready. The home has a good resale and rental value with minor updates.
Value-add opportunities
- Both Paint exterior — Enhances curb appeal and value
- Both Replace flooring — Modernizes the home and improves resale value
- Both Replace appliances — Modernizes the home and improves resale value
Renovation cost estimate screening
Value-add ROI direction
- Both Paint exterior — Enhances curb appeal and value ↑
- Both Replace flooring — Modernizes the home and improves resale value ↑
- Both Replace appliances — Modernizes the home and improves resale value ↑
ⓘ Cost ranges are severity-bucket heuristics (US national rule-of-thumb). Get contractor quotes + a written scope before underwriting a rehab budget.
Schools (NCES district)
- District
- Spartanburg 07
- NCES district ID
- 4503660
- Math proficiency
- 34% ▼ -1.00%
- Reading proficiency
- 41% ▼ -1.00%
- Median HH income
- $35,825
- Composite
- 31.04/100
- National rank
- #6087
- State rank
- #39 of 80 in SC
Livability — Arkwright
No livability data for this city. (Only ~50 U.S. cities are tracked.)
Census & demographics
- Census place
- Arkwright, SC
- County
- Spartanburg County · 258,607 people
- Metro
- Spartanburg, SC
- Population (ZIP)
- 16,714
- Household income
- $41,356
- Rent vs Own
- Severe rent burden
- 1064.0
Population outlook (Spartanburg County) Hauer SSP2
- Today (2025)
- 325,495 people
- By 2030
- 338,800 · +4.1%
- By 2040
- 363,471 · +11.7%
- By 2050
- 384,156 · +18.0%
- By 2075
- 430,137 · +32.1%
- By 2100
- 442,733 · +36.0%
Race, ethnicity, and origin ACS 2023
- Neighborhood character
- Diverse neighborhood (Simpson 0.61)
- Race & ethnicity
- Black 50% White 36% Hispanic / Latino 10% Two or more races 9% Asian 1%
- Hispanic origin (detail)
- Mexican 7% Puerto Rican 2%
- Common ancestry
- Slovak 1% Serbian 1% Iranian 1%
- Foreign-born
- 7% · Canada
- Languages at home
- 90% English-only · Spanish 7% Other Indo-European 2%
Political lean MEDSL · Spartanburg
- 2024 margin
- Solid R (+33.6) · D 32.6% · R 66.2% · Other 1.2%
- 2008→2024 swing
- -12.0pp toward R · 2008: -21.6pp · 2024: -33.6pp
- All cycles
- 2024: R+33.6 2020: R+27.3 2016: R+30.0 2012: R+23.1 2008: R+21.6
Not yet ingested
- Civics
- —
Market trends
- HPI YoY
- ▼ -90.67%
- Current HPI
- 213.1266
- Rent YoY
- ▲ 3.46%
- Metro
- Spartanburg, SC
- State GDP YoY
- ▲ 4.51%
- F500 in state
- 2
Industry mix (Fortune 500 HQ in SC)
| Industry | F500 HQs | Revenue |
|---|---|---|
| Packaging | 1 | $7B |
|
||
Price history
1 event — show timeline
- 2026-06-04 Listed $62,500 ForSaleByOwner.com
Cash-flow waterfall
monthlySold comps — $/sqft
last 12 mo · ≤1 miLoading sold comps…