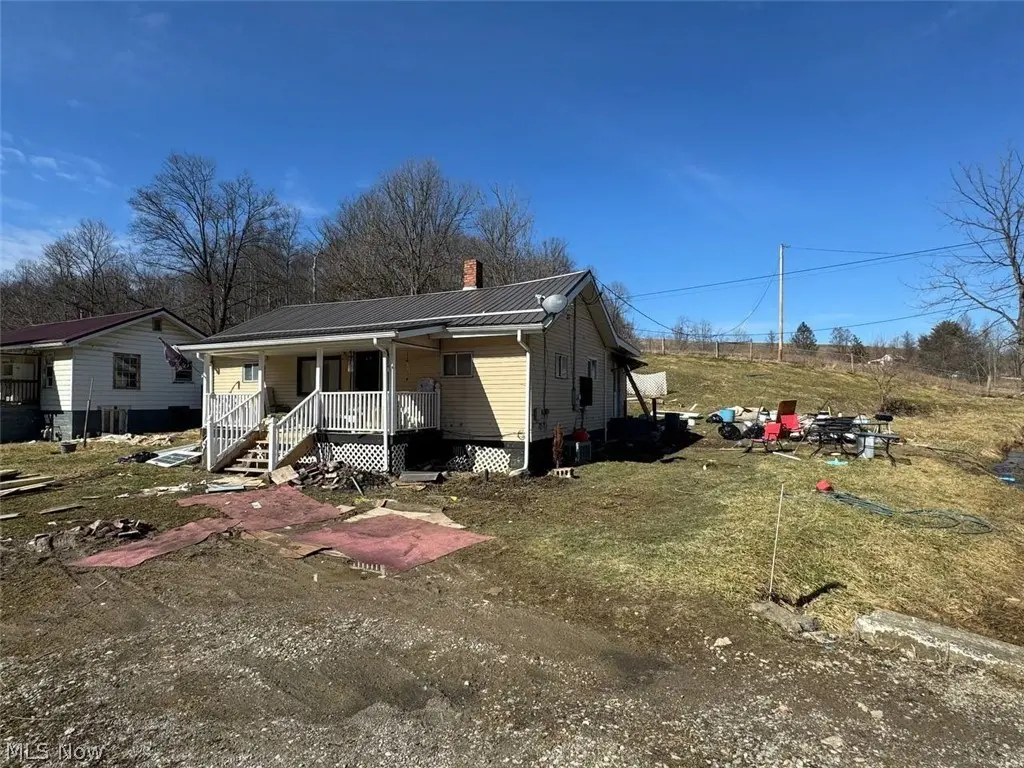
39775 Rosemary Camp Rd · Flushing, OH
Flood risk 10/10 · Severe
- FEMA flood zone
- X (unshaded)
- Chance of flooding over 30 yrs
- 0.99%
- Est. flood insurance / yr
- $507 – $1,088
Fire risk 3/10 · Minor
- Est. fire insurance / yr
- $713 – $1,323
Heat risk 3/10 · Minor
- Hot days now (above 97°F)
- 7 days/yr
- Hot days in 30 yrs
- 18 days/yr
Wind risk 1/10 · Minimal
- Chance of severe wind over 30 yrs
- 0.0%
Air-quality risk 1/10 · Minimal
- Unhealthy air days now
- 0 days/yr
- Unhealthy air days in 30 yrs
- 0 days/yr
Risk factors via First Street. Map © Google.
Why this score? — see what drove the B+ grade
The composite is a weighted blend of 9 inputs, each scored 0–100. Each bar is that input's sub-score; the figure is the points it added to the 100-point composite (weight × sub-score).
- Cash flow +30.0/30.0
- 1% rule +10.0/10.0
- DSCR +10.0/10.0
- Appreciation +10.0/10.0
- ARV discount +7.5/15.0
- Schools +4.2/10.0
- Livability +3.1/5.0
- Rent growth +2.5/5.0
- Condition / age +2.5/5.0
$59,900
🖨 Deal sheet 📄 Offer letter ✓ Due diligence
Listing remarks
Welcome to your private country retreat! Nestled on approximately 1.5 acres, this 3-bedroom, 1-bath home offers outdoor space and peaceful rural living. This home has a brand-new metal roof and a beautifully remodeled kitchen featuring slow-close cabinetry, marble-look countertops, and contemporary finishes. Luxury vinyl flooring flows throughout the kitchen and living room, creating a stylish and durable living space. A spacious addition has expanded the home to approximately 1,100 square feet and includes a large primary bedroom, walk-in closet, and dedicated laundry area, providing added comfort and functionality. Step outside and enjoy the level acreage, offering plenty of room for recr
Key facts
- Remodeled kitchen
- Slow-close cabinetry
- Brand-new metal roof
Tags
Neighborhood map
What this means for you Summary
Snapshot
- This is a 3-bed/1.0-bath single-family listed at $60k.
Deal economics
- At list price, monthly cash flow is $413 ($5k/yr) — positive.
- The deal already cash-flows at list — no discount required.
- Meets the 1% rule at list price ($1k rent vs $60k).
Location & tenants
- Location reads 62/100 on livability (#878 in OH) — a middle-class / working-renter tenant base. Strengths: cost of living A+, housing A+; Watch: crime D+, schools D, amenities F.
- Union Local (rural): math 39% / reading 60% proficiency, ranked #450 of 656 in OH (top 69%) — families likely to look elsewhere, expect single-tenant / working-renter base with shorter leases.
- Market conditions: 9 active listings in the ZIP; 4 units permitted in Belmont County in 2024 (0 in 5+ unit buildings).
Forward outlook
- In year one you build about $6k of equity ($414 loan paydown + $6k appreciation (10.0% local appreciation)).
- Belmont County population projected at -15% by 2050 — secular population decline; favor cash flow + early exit over multi-decade hold.
- At projected returns (10.0% appreciation + 3.0% rent growth), your $17k cash investment doubles in ~2 years — after that, you're playing with house money.
- By year 6, paydown + projected appreciation supports a ~$38k cash-out refi (75% LTV) — recoverable capital for the next deal without selling this one.
Negotiation context
- Only 1 days on market — expect competitive offers; lowballing is unlikely to land.
- Current owner paid $41k; 45% above their basis — modest negotiation headroom, anchor on the comps not their cost.
Risks & watch-outs
- Watch-outs: flood insurance adds $66/mo; built in 1920 — expect roof / HVAC / electrical / plumbing capex.
- Climate carrying-cost: severe flood risk — expect insurance premiums to compound above CPI over the hold.
Questions for the listing agent
- Built in 1920 — when were the roof, HVAC, electrical panel, plumbing, and water heater last replaced?
- What's the actual annual flood-insurance premium (NFIP or private), and is the property in a SFHA with mandatory coverage?
- Is there a deadline driving the sale (1031 exchange, divorce, estate, relocation)? That informs how much negotiation room exists.
- Schools are D-rated, which usually means shorter tenancies and higher turnover. Who's the typical renter profile here, and what's been the actual vacancy rate?
- Crime grade is D in this area — have there been break-ins, vandalism, or insurance claims at this property in the last 3 years? What carrier currently insures it and at what premium?
- What's the average days-on-market for RENTAL listings here right now (not sales)? A rising rental-DOM trend means longer vacancies and softer asking-rent achievability than the comps imply.
- What's the recent tenant-quality profile in this submarket — average credit score on applications, eviction rate, late-payment / NSF rate, and stable-employment percentage? A property-management company in the area should have these aggregated.
- How much new for-sale + rental construction is in the pipeline within 1–3 miles? Heavy new supply typically softens prices + rents 12–24 months out; constrained supply supports both.
Investment metrics
- 1% rule
- 1.79% ✓
- Cap rate
- 15.90%
- Cash-on-cash
- 34.31%
- DSCR
- 2.53
- GRM
- 4.7
CMA / ARV
No comps found within radius.
Projected returns pro-forma
10.0% appreciation · 3.0% rent growth · sell at horizon
- IRR
- 46.7%
- Equity multiple
- 4.52×
- Total profit
- $58,960
- Equity at exit
- $53,963
- IRR
- 40.6%
- Equity multiple
- 10.12×
- Total profit
- $152,993
- Equity at exit
- $116,373
Cash invested: $16,772 (down + closing). Projections, not guarantees.
Landlord ↔ Tenant lean methodology
- Overall (STATE)
- 73 Landlord-Friendly
- State Ohio
- 73 Landlord-Friendly · R+6
- County
- — inherits STATE
- City
- — inherits STATE
ZIP-level market 43977
- Active inventory
- 9
- Price-to-rent
- 4.7×
Monthly cashflow live
- Estimated rent
- $1,071 medium interval (Pro) →
- Mortgage (P&I)
- −$314
- Tax from tax record
- −$27 /mo · $326/yr
- Insurance
- −$25
- Flood insurance flood zone
- −$66 /mo · $798/yr
- HOA
- −$0
- Vacancy / Maint / Mgmt
- −$225
- Net cashflow
- $413
Break-even live
UW: 25.0% down · 7.5% · 30yr · 1.5% tax · 5.0% vac · 8.0% maint · 8.0% mgmt
Financing live
Cash to close
- Down payment
- $14,975
- Closing costs
- $1,797
- Reserves months
- —
- Total cash needed
- —
Loan-product check · same deal, 3 products live
Conventional
25% down · 7.5% · 30yr
- Down + closing
- —
- Monthly P&I
- —
- Monthly cashflow
- —
- DSCR
- —
- Eligible?
- —
Personal DTI + credit; lowest rate.
DSCR
20% down · 8.5% · 30yr
- Down + closing
- —
- Monthly P&I
- —
- Monthly cashflow
- —
- DSCR
- —
- Eligible?
- —
No personal income docs; deal must DSCR.
Hard money
10% down · 12.0% · 12mo
- Down + closing
- —
- Monthly P&I
- —
- Monthly cashflow
- —
- DSCR
- —
- Eligible?
- —
Short-term bridge; refi at stabilization.
Listing history 5 events
-
2026-06-17pricestatusdays on market $59,900 Active 1 DOM
-
2026-05-12historical
-
2026-04-28price $79,000
-
2026-03-09$99,000 Active
-
2023-07-05soldstatus $41,333
ⓘ Source: listings_history table (triggers on properties + properties_extension) + one-shot
backfill from property_details.listing_events for pre-trigger history.
Tax reassessment forecast OH · Partial reset (capped growth)
- Current annual tax
- $326 · $27/mo
- Projected year-2 tax
- $630 · $53/mo
- Expected delta
- +$304/yr (+$25/mo · 93.2%)
ⓘ Screening estimate from a state-policy table — verify with the county assessor before closing.
Climate risk First Street
- Flood 10/10 Extreme FEMA zone X (unshaded) · 99% chance over 30 yrs
- Wildfire 3/10 Moderate
- Heat 3/10 Moderate 7 d/yr ≥97°F today · 18 d/yr by 30 yrs out
- Wind 1/10 Low 0% chance of damaging wind over 30 yrs
- Air quality 1/10 Low 0 unhealthy d/yr today · 0 by 30 yrs out
Nearby sold comps map
Loading sold comps map…
Walkable amenities ~0.75 mi
Loading nearby amenities…
Taxation est. · year 1
- Rental income
- $12,848
- − Mortgage interest
- −$3,355
- − Property taxes
- −$326
- − Insurance
- −$1,097
- − Repairs & maintenance
- −$1,028
- − Management
- −$1,028
- − Depreciation
- −$1,743
- Taxable income
- $4,271
- Est. tax owed @ 24.0%
- −$1,025
- After-tax cash flow
- $3,932/yr
For passive investors: Depreciation is non-cash, so a rental often shows a tax loss while cash-flowing — sheltering income. Rental losses are passive: they offset passive income freely, and up to $25,000/yr can offset ordinary (W-2) income if you actively participate and your MAGI is under $100k (phasing out to $0 by $150k); unused losses carry forward. On sale, claimed depreciation is recaptured at up to 25%, and gains may owe capital-gains tax (a 1031 exchange can defer both). Figures are a year-1 estimate at your 24.0% rate — not tax advice; consult a CPA.
Schools (NCES district)
- District
- Union Local
- NCES district ID
- 3904601
- Math proficiency
- 39% ▼ -13.00%
- Reading proficiency
- 60% ▼ -5.00%
- Median HH income
- $44,288
- Composite
- 41.74/100
- National rank
- #3402
- State rank
- #450 of 656 in OH
Livability — Flushing
- Score
- 62/100
- State rank
- #878
- US rank
- #16613
Category grades
Schools grade is shown separately in the Schools card above.
Census & demographics
- County
- Belmont · 63,139 people
- Metro
- Wheeling, WV-OH
- Population (ZIP)
- 2,576
- Household income
- $59,483
- Rent vs Own
- Severe rent burden
- 2.6
Population outlook (Belmont County) Hauer SSP2
- Today (2025)
- 66,568 people
- By 2030
- 64,818 · -2.6%
- By 2040
- 60,702 · -8.8%
- By 2050
- 56,427 · -15.2%
- By 2075
- 46,222 · -30.6%
- By 2100
- 34,611 · -48.0%
Race, ethnicity, and origin ACS 2023
- Neighborhood character
- Predominantly White (94%)
- Race & ethnicity
- White 94% Two or more races 4% Hispanic / Latino 1%
- Common ancestry
- Iranian 5% Romanian 2% Lithuanian 2%
- Foreign-born
- 1% · Canada
- Languages at home
- 99% English-only · Spanish 1%
Political lean MEDSL · Belmont
- 2024 margin
- Solid R (+47.3) · D 26.0% · R 73.3%
- 2008→2024 swing
- -50.0pp toward R · 2008: 2.7pp · 2024: -47.3pp
- All cycles
- 2024: R+47.3 2020: R+43.6 2016: R+39.5 2012: R+8.4 2008: D+2.7
Not yet ingested
- Civics
- —
Market trends
- HPI YoY
- ▲ 76.92%
- Current HPI
- 244.89
- Rent YoY
- —
- Metro
- —
- State GDP YoY
- ▲ 1.98%
- F500 in state
- 48
Industry mix (Fortune 500 HQ in OH)
| Industry | F500 HQs | Revenue |
|---|---|---|
| Insurance | 3 | $145B |
|
||
| Industrial Machinery | 3 | $49B |
|
||
| Financial Services | 3 | $24B |
|
||
| Consumer Goods | 2 | $93B |
|
||
| Aerospace / Defense | 2 | $47B |
|
||
| Utilities | 2 | $33B |
|
||
Price history
+91.1% since first listed4 events — show timeline
- 2026-05-12 Listing Removed — MLSNOW
- 2026-04-28 Price Changed $79,000 MLSNOW
- 2026-03-09 Listed $99,000 MLSNOW
- 2023-07-05 Sold (Public Records) $41,333 Public Records
Property tax history
+1.6%/yrLatest (2025): $326 · +1.6% YoY. Source: county tax records.
Cash-flow waterfall
monthlySold comps — $/sqft
last 12 mo · ≤1 miLoading sold comps…