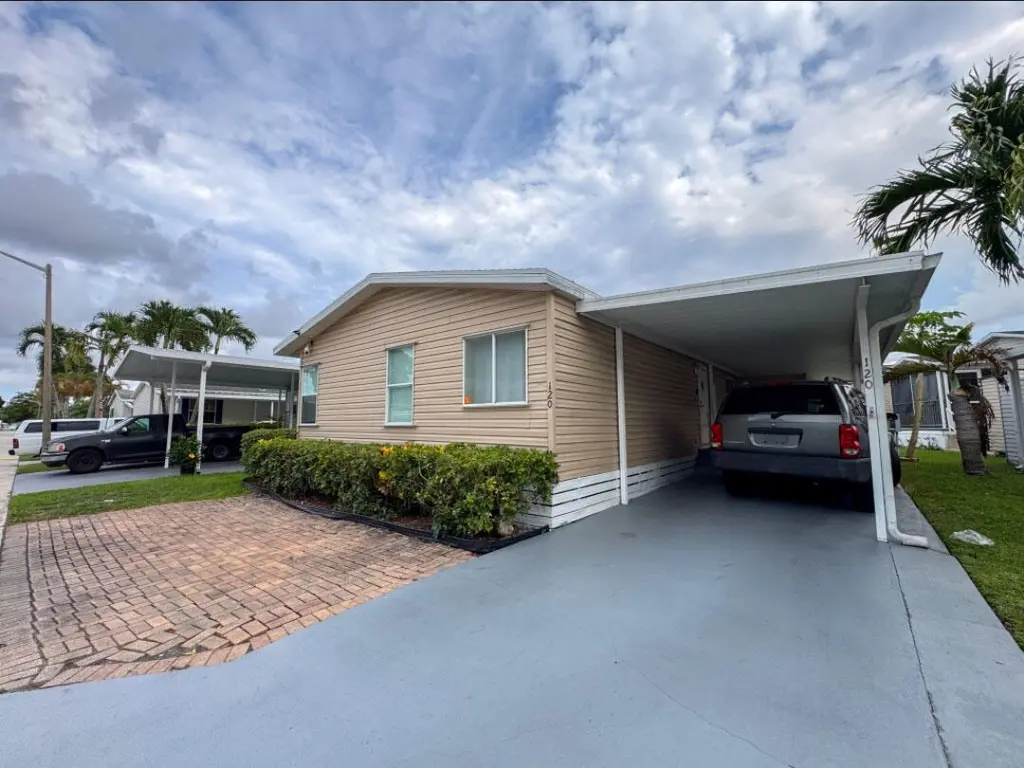
120 Plantation Blvd #120 · Greenacres, FL
Flood risk 1/10 · Minimal
- FEMA flood zone
- X (unshaded)
- Chance of flooding over 30 yrs
- 0.0%
- Est. flood insurance / yr
- $507 – $1,088
Fire risk 1/10 · Minimal
- Est. fire insurance / yr
- $947 – $1,759
Heat risk 10/10 · Severe
- Hot days now (above 106°F)
- 7 days/yr
- Hot days in 30 yrs
- 26 days/yr
Wind risk 10/10 · Severe
- Chance of severe wind over 30 yrs
- 99.0%
Air-quality risk 2/10 · Minimal
- Unhealthy air days now
- 0 days/yr
- Unhealthy air days in 30 yrs
- 2 days/yr
Risk factors via First Street. Map © Google.
Why this score? — see what drove the B- grade
The composite is a weighted blend of 9 inputs, each scored 0–100. Each bar is that input's sub-score; the figure is the points it added to the 100-point composite (weight × sub-score).
- Cash flow +30.0/30.0
- 1% rule +10.0/10.0
- DSCR +10.0/10.0
- ARV discount +7.5/15.0
- Schools +4.3/10.0
- Livability +3.5/5.0
- Rent growth +2.4/5.0
- Condition / age +2.2/5.0
- Appreciation +0.0/10.0
$120,000
🖨 Deal sheet 📄 Offer letter ✓ Due diligence
Listing remarks
Charming Mobile Home in a community for all ages in Palm Beach Plantation, Beautiful and comfortable 3 bedrooms and 2 bathrooms, with elegant tray ceilings with wood accents, recessed lighting, with laminate flooring, a private retreat with a wonderful lake view and spacious covered front porch for relaxing, and private carport. All measurements are approximate. This property is available for purchase with Financing or Cash. Call the listing agent today to schedule your private tour.
Key facts
- Covered front porch
- Lake view
- Private carport
Tags
Property features AI
Finance
- Other: Pets allowed with breed restrictions
Exterior
- Parking: Three covered parking spaces; Attached 2-car garage; Attached carport with 1 carport space
- Utilities: Public water; Public sewer; Electricity available; Natural gas connected; Cable available
- Home design: Mobile home; Single-story; Faces northeast; Resale condition
- Construction: Metal siding with metal frame; Built as a mobile home
- Exterior features: Zero lot line; Not waterfront; Roof over
Interior
- Kitchen: Includes dishwasher, microwave, refrigerator
- Bedrooms: One main-level bedroom
- Flooring: Carpet; Ceramic tile; Tile; Vinyl
- Bathrooms: Two full bathrooms (one on the main level)
- Heating & cooling: Central air conditioning
- Interior features: Dishwasher, Microwave, Refrigerator; Carpet, Ceramic tile, Tile, Vinyl flooring
Neighborhood map
What this means for you Summary
Snapshot
- This is a 3-bed/2.0-bath manufactured listed at $120k. Condition is rated fair.
Deal economics
- At list price, monthly cash flow is $1k ($16k/yr) — positive.
- The deal already cash-flows at list — no discount required.
- Meets the 1% rule at list price ($3k rent vs $120k).
Location & tenants
- Location reads 69/100 on livability (#490 in FL) — a middle-class / working-renter tenant base. Strengths: cost of living A+, housing A+, health & safety A; Watch: schools D+, employment D, amenities F.
- Palm Beach (suburban): math 46% / reading 53% proficiency, ranked #34 of 73 in FL (top 47%) — families likely to look elsewhere, expect single-tenant / working-renter base with shorter leases.
- Market conditions: Rents soft (-0.4%/yr); 651 active listings in the ZIP; 40 comparable units currently listed for rent nearby; rentals at typical pace (median 21d on market — plan ~3-4 weeks tenant-placement turnaround); solid renter incomes; 3,974 units permitted in Palm Beach County in 2024 (1,012 in 5+ unit buildings).
- This rent runs 34% of the median local income ($96k/yr) — at the standard rent-burdened threshold; future hikes will face affordability resistance.
Forward outlook
- Local home prices are declining (-3.0%/yr); year-one equity from $830 of loan paydown is wiped out by about $4k of value loss. Plan a longer hold.
- Palm Beach County population projected at +30% by 2050 — long-run rental-demand tailwind backs the buy-and-hold thesis.
- At projected returns (-3.0% appreciation + 0.0% rent growth), your $34k cash investment doubles in ~3 years — after that, you're playing with house money.
Negotiation context
- Only 6 days on market — expect competitive offers; lowballing is unlikely to land.
Risks & watch-outs
- Climate carrying-cost: severe wind risk, 99% chance of damaging wind over 30y; extreme-heat days projected 7→26/yr by 2055 (HVAC capex compounding) — expect insurance premiums to compound above CPI over the hold.
Questions for the listing agent
- Have any recent inspections been done? Can we get a copy of the seller's disclosures and any deferred-maintenance estimates?
- Is there a deadline driving the sale (1031 exchange, divorce, estate, relocation)? That informs how much negotiation room exists.
- Schools are D-rated, which usually means shorter tenancies and higher turnover. Who's the typical renter profile here, and what's been the actual vacancy rate?
- What's the average days-on-market for RENTAL listings here right now (not sales)? A rising rental-DOM trend means longer vacancies and softer asking-rent achievability than the comps imply.
- What's the recent tenant-quality profile in this submarket — average credit score on applications, eviction rate, late-payment / NSF rate, and stable-employment percentage? A property-management company in the area should have these aggregated.
- How much new for-sale + rental construction is in the pipeline within 1–3 miles? Heavy new supply typically softens prices + rents 12–24 months out; constrained supply supports both.
Investment metrics
- 1% rule
- 2.24% ✓
- Cap rate
- 19.27%
- Cash-on-cash
- 46.36%
- DSCR
- 3.06
- GRM
- 3.7
CMA / ARV
No comps found within radius.
Projected returns pro-forma
-3.0% appreciation · 0.0% rent growth · sell at horizon
- IRR
- 40.2%
- Equity multiple
- 2.65×
- Total profit
- $55,376
- Equity at exit
- $17,892
- IRR
- 45.0%
- Equity multiple
- 4.70×
- Total profit
- $124,341
- Equity at exit
- $10,375
Cash invested: $33,600 (down + closing). Projections, not guarantees.
Landlord ↔ Tenant lean methodology
- Overall (STATE)
- 87 Strongly Landlord-Friendly
- State Florida
- 87 Strongly Landlord-Friendly · R+3
- County
- — inherits STATE
- City
- — inherits STATE
ZIP-level market 33467
- Rents YoY
- -0.4%
- Active inventory
- 651
- Price-to-rent
- 3.7×
Monthly cashflow live
- Estimated rent
- $2,693 high interval (Pro) →
- Mortgage (P&I)
- −$629
- Tax est. 1.5%
- −$150 /mo · $1,800/yr
- Insurance
- −$50
- HOA
- −$0
- Vacancy / Maint / Mgmt
- −$565
- Net cashflow
- $1,298
Break-even live
UW: 25.0% down · 7.5% · 30yr · 1.5% tax · 5.0% vac · 8.0% maint · 8.0% mgmt
Financing live
Cash to close
- Down payment
- $30,000
- Closing costs
- $3,600
- Reserves months
- —
- Total cash needed
- —
Loan-product check · same deal, 3 products live
Conventional
25% down · 7.5% · 30yr
- Down + closing
- —
- Monthly P&I
- —
- Monthly cashflow
- —
- DSCR
- —
- Eligible?
- —
Personal DTI + credit; lowest rate.
DSCR
20% down · 8.5% · 30yr
- Down + closing
- —
- Monthly P&I
- —
- Monthly cashflow
- —
- DSCR
- —
- Eligible?
- —
No personal income docs; deal must DSCR.
Hard money
10% down · 12.0% · 12mo
- Down + closing
- —
- Monthly P&I
- —
- Monthly cashflow
- —
- DSCR
- —
- Eligible?
- —
Short-term bridge; refi at stabilization.
Rent comps 40 comps
| Address | Beds | Baths | Sqft | Rent | $/sqft | DOM | Units | Dist |
|---|---|---|---|---|---|---|---|---|
| 183 Plantation Blvd Lake Worth, FL | 3.0 | 2.0 | 1458 | $2,350 | $1.61 | 2d | 1 | 0.14mi |
| 5592 1st Rd Lake Worth, FL | 3.0 | 2.0 | 1693 | $3,500 | $2.07 | 4d | 1 | 0.46mi |
| 5586 3rd Rd Lake Worth, FL | 3.0 | 2.0 | 1116 | $3,250 | $2.91 | 4d | 1 | 0.67mi |
| 5721 Wingham Way Lake Worth, FL | 3.0 | 2.0 | 1161 | $2,500 | $2.15 | 12d | 1 | 0.80mi |
| 5721 Wingham Way Unit 5721 Greenacres, FL | 3.0 | 2.0 | 1161 | $2,500 | $2.15 | 17d | 1 | 0.80mi |
| 5098 Ambler Ln Lake Worth, FL | 3.0 | 2.0 | 1181 | $2,550 | $2.16 | 24d | 1 | 0.89mi |
| 5172 Fountains Dr S Lake Worth, FL | 2.0 | 2.0 | 1591 | $2,400 | $1.51 | 24d | 1 | 0.98mi |
| 6953 Crooked Fence Dr Lake Worth, FL | 2.0 | 2.5 | 1008 | $2,500 | $2.48 | 17d | 1 | 1.00mi |
| 6880 Brook Hollow Rd Lake Worth, FL | 3.0 | 2.5 | 1428 | $2,850 | $2.00 | 24d | 1 | 1.02mi |
| 6129 Moonbeam Dr Lake Worth, FL | 2.0 | 2.0 | 1317 | $2,226 | $1.69 | 20d | 1 | 1.03mi |
| 6975 Blacksmith Way Lake Worth, FL | 2.0 | 2.5 | 1008 | $2,300 | $2.28 | 24d | 1 | 1.04mi |
| 4735 Lucerne Lakes Blvd E #410 Lake Worth, FL | 2.0 | 2.0 | 1330 | $1,700 | $1.28 | 24d | 1 | 1.05mi |
| 4725 Lucerne Lakes Blvd E Lake Worth, FL | 2.0 | 2.0 | 1330 | $1,950 | $1.47 | 7d | 2 | 1.05mi |
| 4725 Lucerne Lakes Blvd E Lake Worth, FL | 2.0 | 2.0 | 1330 | $1,950 | $1.47 | 20d | 2 | 1.05mi |
| 4735 Lucerne Lakes Blvd W Unit 410 Greenacres, FL | 2.0 | 2.0 | 1330 | $1,700 | $1.28 | 22d | 1 | 1.06mi |
| 4770 Fountains Dr S #303 Lake Worth, FL | 2.0 | 2.0 | 1434 | $2,200 | $1.53 | 2d | 1 | 1.09mi |
| 4698 Lucerne Lakes Blvd E Unit 46 Greenacres, FL | 2.0 | 2.0 | 1600 | $2,000 | $1.25 | 24d | 1 | 1.09mi |
| 4698 Lucerne Lakes Blvd E #103 Lake Worth, FL | 2.0 | 2.0 | 1244 | $2,100 | $1.69 | 24d | 1 | 1.09mi |
| 6004 Westfall Rd Lake Worth, FL | 3.0 | 2.0 | 1417 | $3,326 | $2.35 | 12d | 1 | 1.11mi |
| 6064 Beaconwood Rd Lake Worth, FL | 2.0 | 2.0 | 1692 | $2,750 | $1.63 | 7d | 1 | 1.11mi |
| 6974 Oak Bridge Ln Lake Worth, FL | 2.0 | 2.5 | 1310 | $2,650 | $2.02 | 15d | 1 | 1.14mi |
| 4640 Lucerne Lakes Blvd W #605 Lake Worth, FL | 2.0 | 1.0 | 900 | $1,600 | $1.78 | 15d | 1 | 1.17mi |
| 6298 Harbour Chase Dr Lake Worth, FL | 3.0 | 2.0 | 1866 | $3,600 | $1.93 | 24d | 1 | 1.21mi |
| 6298 Harbour Chase Dr Lake Worth, FL | 3.0 | 2.0 | 1866 | $3,500 | $1.88 | 7d | 1 | 1.21mi |
| 7593 Tahiti Ln #205 Lake Worth, FL | 2.0 | 2.0 | 1186 | $1,800 | $1.52 | 24d | 1 | 1.21mi |
| 4489 Luxemburg Ct #101 Lake Worth, FL | 2.0 | 2.0 | 1005 | $2,000 | $1.99 | 24d | 1 | 1.23mi |
| 1204 Timberlane Cir Unit 12D Greenacres, FL | 3.0 | 2.0 | 1332 | $2,800 | $2.10 | 4d | 1 | 1.26mi |
| 4702 Fountains Dr S #207 Lake Worth, FL | 2.0 | 2.5 | 1434 | $2,600 | $1.81 | 1d | 1 | 1.27mi |
| 4702 Fountains Dr S #207 Lake Worth, FL | 2.0 | 2.5 | 1434 | $2,600 | $1.81 | 24d | 1 | 1.27mi |
| 4483 Luxemburg Ct #201 Lake Worth, FL | 3.0 | 2.0 | 1265 | $2,800 | $2.21 | 24d | 1 | 1.27mi |
| 4539 Luxemburg Ct Lake Worth, FL | 2.0 | 2.0 | 1027 | $2,250 | $2.19 | 5d | 1 | 1.29mi |
| 4539 Luxemburg Ct Lake Worth, FL | 2.0 | 2.0 | 1005 | $2,250 | $2.24 | 24d | 1 | 1.29mi |
| 4471 Luxemburg Ct #101 Lake Worth, FL | 2.0 | 2.0 | 1005 | $2,300 | $2.29 | 18d | 1 | 1.32mi |
| 4471 Luxemburg Ct Lake Worth, FL | 2.0 | 2.0 | 1005 | $2,150 | $2.14 | 24d | 2 | 1.32mi |
| 4557 Luxemburg Ct Lake Worth, FL | 2.0 | 1.5 | 1065 | $2,400 | $2.25 | 24d | 1 | 1.34mi |
| 4469 Luxemburg Ct Lake Worth, FL | 3.0 | 2.5 | 1502 | $3,400 | $2.26 | 24d | 1 | 1.34mi |
| 4801 Esedra Ct #201 Lake Worth, FL | 2.0 | 2.0 | 1005 | $2,300 | $2.29 | 24d | 1 | 1.35mi |
| 4801 Esedra Ct Lake Worth, FL | 2.0 | 2.0 | 1027 | $2,075 | $2.02 | 11d | 2 | 1.35mi |
| 4640 Lucerne Lakes Blvd W Lake Worth, FL | 2.0 | 1.0–2.0 | 960 | $1,525 | $1.59 | 4d | 2 | 1.36mi |
| 6836 Long Key St Lake Worth, FL | 3.0 | 2.5 | 1637 | $2,950 | $1.80 | 17d | 1 | 1.41mi |
Listing history 6 events
-
2026-06-18days on market $120,000 Active 6 DOM
-
2026-06-17days on market $120,000 Active 5 DOM
-
2026-06-16days on market $120,000 Active 4 DOM
-
2026-06-15days on market $120,000 Active 3 DOM
-
2026-06-13remarks 488-char remark
-
2026-06-13$120,000 Active 1 DOM
ⓘ Source: listings_history table (triggers on properties + properties_extension) + one-shot
backfill from property_details.listing_events for pre-trigger history.
Climate risk First Street
- Flood 1/10 Low FEMA zone X (unshaded) · 0% chance over 30 yrs
- Wildfire 1/10 Low
- Heat 10/10 Extreme 7 d/yr ≥106°F today · 26 d/yr by 30 yrs out
- Wind 10/10 Extreme 99% chance of damaging wind over 30 yrs
- Air quality 2/10 Low 0 unhealthy d/yr today · 2 by 30 yrs out
Nearby sold comps map
Loading sold comps map…
Walkable amenities ~0.75 mi
Loading nearby amenities…
Taxation est. · year 1
- Rental income
- $32,314
- − Mortgage interest
- −$6,722
- − Property taxes
- −$1,800
- − Insurance
- −$600
- − Repairs & maintenance
- −$2,585
- − Management
- −$2,585
- − Depreciation
- −$3,491
- Taxable income
- $14,531
- Est. tax owed @ 24.0%
- −$3,487
- After-tax cash flow
- $12,089/yr
For passive investors: Depreciation is non-cash, so a rental often shows a tax loss while cash-flowing — sheltering income. Rental losses are passive: they offset passive income freely, and up to $25,000/yr can offset ordinary (W-2) income if you actively participate and your MAGI is under $100k (phasing out to $0 by $150k); unused losses carry forward. On sale, claimed depreciation is recaptured at up to 25%, and gains may owe capital-gains tax (a 1031 exchange can defer both). Figures are a year-1 estimate at your 24.0% rate — not tax advice; consult a CPA.
Condition & rehab AI · 13 photos
The home is in fair condition with moderate wear. It requires updates to the kitchen and bathrooms to increase its resale value.
Repairs flagged
- Moderate kitchen cabinets — dated and in need of replacement
- Moderate bathroom fixtures — dated and in need of replacement
- Minor exterior siding — moderate wear
Value-add opportunities
- Resale update kitchen cabinets and appliances — modernizing the kitchen would attract more buyers
- Resale update bathrooms with new fixtures and tile — modernizing the bathrooms would attract more buyers
- Both paint interior walls — improves the home's appearance and can be done inexpensively
- Both replace carpet with hardwood or tile — improves the home's appearance and can be done inexpensively
Renovation cost estimate screening
| Repair item | Severity | Est. cost |
|---|---|---|
| kitchen cabinets · dated and in need of replacement | Moderate | $3,000–15,000 |
| bathroom fixtures · dated and in need of replacement | Moderate | $3,000–15,000 |
| exterior siding · moderate wear | Minor | $500–3,000 |
| Total estimated repair cost · 3 items | $6,500–33,000 |
Value-add ROI direction
- Resale update kitchen cabinets and appliances — modernizing the kitchen would attract more buyers ↑
- Resale update bathrooms with new fixtures and tile — modernizing the bathrooms would attract more buyers ↑
- Both paint interior walls — improves the home's appearance and can be done inexpensively ↑
- Both replace carpet with hardwood or tile — improves the home's appearance and can be done inexpensively ↑
ⓘ Cost ranges are severity-bucket heuristics (US national rule-of-thumb). Get contractor quotes + a written scope before underwriting a rehab budget.
Schools (NCES district)
- District
- Palm Beach
- NCES district ID
- 1201500
- Math proficiency
- 46% ▼ -16.00%
- Reading proficiency
- 53% ▼ -4.00%
- Median HH income
- $53,943
- Composite
- 42.72/100
- National rank
- #3160
- State rank
- #34 of 73 in FL
Livability — Greenacres
- Score
- 69/100
- State rank
- #490
- US rank
- #9008
Category grades
Schools grade is shown separately in the Schools card above.
Census & demographics
- County
- Palm Beach County · 1,438,312 people
- City population
- 65,478
- Metro
- Miami-Fort Lauderdale-Pompano Beach, FL
- Population (ZIP)
- 58,411
- Household income
- $95,739
- Rent vs Own
- Severe rent burden
- 960.0
Population outlook (Palm Beach County) Hauer SSP2
- Today (2025)
- 1,637,487 people
- By 2030
- 1,743,255 · +6.5%
- By 2040
- 1,948,712 · +19.0%
- By 2050
- 2,132,979 · +30.3%
- By 2075
- 2,530,027 · +54.5%
- By 2100
- 2,706,979 · +65.3%
Race, ethnicity, and origin ACS 2023
- Neighborhood character
- Diverse neighborhood (Simpson 0.59)
- Race & ethnicity
- White 59% Hispanic / Latino 22% Two or more races 13% Black 10% Asian 4%
- Hispanic origin (detail)
- Mexican 2% Puerto Rican 4% Cuban 4% Dominican 2%
- Common ancestry
- Romanian 4% Scotch-Irish 3% Hispanic 3%
- Foreign-born
- 24% · Canada, Jamaica, Vietnam
- Languages at home
- 71% English-only · Spanish 17% French/Haitian/Cajun 5% Other Indo-European 3%
Political lean MEDSL · Palm Beach
- 2024 margin
- Toss-up / Even · D 50.0% · R 49.2%
- 2008→2024 swing
- -22.1pp toward R · 2008: 22.9pp · 2024: 0.8pp
- All cycles
- 2024: D+0.8 2020: D+12.8 2016: D+15.3 2012: D+17.0 2008: D+22.9
Not yet ingested
- Civics
- —
Market trends
- HPI YoY
- ▼ -288.94%
- Current HPI
- 343.7738
- Rent YoY
- ▼ -0.40%
- Metro
- Miami-Fort Lauderdale-Pompano Beach, FL
- State GDP YoY
- ▲ 3.28%
- F500 in state
- 36
Industry mix (Fortune 500 HQ in FL)
| Industry | F500 HQs | Revenue |
|---|---|---|
| Industrial Technology | 2 | $29B |
|
||
| Insurance | 2 | $17B |
|
||
| Retail | 1 | $60B |
|
||
| Technology Distribution | 1 | $58B |
|
||
| Homebuilding | 1 | $35B |
|
||
| Technology Manufacturing | 1 | $35B |
|
||
Price history
1 event — show timeline
- 2026-06-12 Listed $120,000 Beaches MLS
Cash-flow waterfall
monthlySold comps — $/sqft
last 12 mo · ≤1 miLoading sold comps…