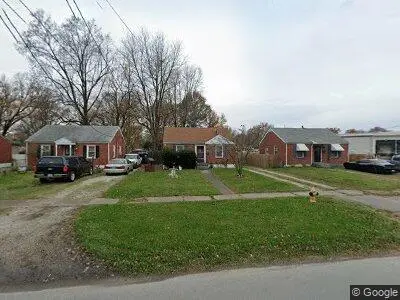
1159 W Indian Trl · Louisville/Jefferson County metro government (balance), KY
Flood risk 6/10 · Moderate
- FEMA flood zone
- X (unshaded)
- Chance of flooding over 30 yrs
- 0.61%
- Est. flood insurance / yr
- $507 – $1,088
Fire risk 1/10 · Minimal
- Est. fire insurance / yr
- $839 – $1,559
Heat risk 5/10 · Moderate
- Hot days now (above 105°F)
- 7 days/yr
- Hot days in 30 yrs
- 19 days/yr
Wind risk 2/10 · Minimal
- Chance of severe wind over 30 yrs
- 2.0%
Air-quality risk 3/10 · Minor
- Unhealthy air days now
- 3 days/yr
- Unhealthy air days in 30 yrs
- 5 days/yr
Risk factors via First Street. Map © Google.
Why this score? — see what drove the B grade
The composite is a weighted blend of 9 inputs, each scored 0–100. Each bar is that input's sub-score; the figure is the points it added to the 100-point composite (weight × sub-score).
- Cash flow +28.1/30.0
- ARV discount +15.0/15.0
- DSCR +10.0/10.0
- 1% rule +7.3/10.0
- Rent growth +2.5/5.0
- Livability +2.5/5.0
- Condition / age +2.5/5.0
- Schools +2.3/10.0
- Appreciation +0.0/10.0
$100,000
🖨 Deal sheet 📄 Offer letter ✓ Due diligence
Listing remarks MLS
Nice brick home. Currently excellent rental property. Big yard. Priced below assessed value!
Key facts
- Built 1949
Neighborhood map
What this means for you Summary
Snapshot
- This is a 2-bed/1.0-bath single-family listed at $100k.
Deal economics
- At list price, monthly cash flow is $316 ($4k/yr) — positive.
- The deal already cash-flows at list — no discount required.
- Meets the 1% rule at list price ($1k rent vs $100k).
- Cap rate 10.1% vs local median 4.0% in Louisville/Jefferson County metro government (balance) — top-decile yield for the area; either an underpriced asset or a hidden risk that comps aren't pricing in. Stress-test before assuming the spread holds.
Location & tenants
- Location reads: area grade B — affects rentability + tenant quality, not the cash-flow math above.
- Jefferson County (urban): math 19% / reading 35% proficiency, ranked #121 of 165 in KY (top 73%) — low school quality limits family demand, transient renter base, plan for 1-2y turnover.
- Market conditions: 47 active listings in the ZIP; 13 comparable units currently listed for rent nearby; rentals leasing fast (median 12d on market — plan ~1-2 weeks tenant-placement turnaround); 2,836 units permitted in Jefferson County in 2024 (1,558 in 5+ unit buildings).
Forward outlook
- Local home prices are declining (-3.0%/yr); year-one equity from $691 of loan paydown is wiped out by about $3k of value loss. Plan a longer hold.
- Jefferson County population projected at +13% by 2050 — modest demand growth; plan on rents tracking national, not racing it.
- At projected returns (-3.0% appreciation + 3.0% rent growth), your $28k cash investment doubles in ~9 years — after that, you're playing with house money.
Negotiation context
- Only 0 days on market — expect competitive offers; lowballing is unlikely to land.
- 2 sale attempts since 15y ago with the ask held roughly flat each time — persistent listings suggest the price (not the market) is what's stuck; bring a comps-based counter.
- Current owner paid $51k; list at $100k implies a 96% gain — meaningful room to come down on a strong offer.
Risks & watch-outs
- Watch-outs: built in 1949 — expect roof / HVAC / electrical / plumbing capex.
- Climate carrying-cost: major flood risk; extreme-heat days projected 7→19/yr by 2055 (HVAC capex compounding) — expect insurance premiums to compound above CPI over the hold.
Questions for the listing agent
- Built in 1949 — when were the roof, HVAC, electrical panel, plumbing, and water heater last replaced?
- Is there a deadline driving the sale (1031 exchange, divorce, estate, relocation)? That informs how much negotiation room exists.
- What's the average days-on-market for RENTAL listings here right now (not sales)? A rising rental-DOM trend means longer vacancies and softer asking-rent achievability than the comps imply.
- What's the recent tenant-quality profile in this submarket — average credit score on applications, eviction rate, late-payment / NSF rate, and stable-employment percentage? A property-management company in the area should have these aggregated.
- How much new for-sale + rental construction is in the pipeline within 1–3 miles? Heavy new supply typically softens prices + rents 12–24 months out; constrained supply supports both.
Investment metrics
- 1% rule
- 1.23% ✓
- Cap rate
- 10.08%
- Cash-on-cash
- 13.53%
- DSCR
- 1.60
- GRM
- 6.8
CMA / ARV
- ARV (on-the-fly)
- $152,308
- Comps found
- 5
Show comp detail 5 sales within ~0.75 mi
| Address | Dist | Beds/Ba | Sqft | Sold | Price | $/sf | Match |
|---|---|---|---|---|---|---|---|
| 1210 Becker Ave | 0.25mi | 2/1.0 | 828 (+10%) | 6mo | $167,450 | $202 | 67 |
| 1218 Kremer Ave | 0.29mi | 2/1.0 | 850 (+13%) | 14mo | $200,000 | $235 | 53 |
| 1258 Vim Dr | 0.43mi | 1/1.0 (-1) | 672 (-11%) | 20mo | $110,000 | $164 | 40 |
| 4833 Partridge Run | 0.73mi | 2/1.0 | 828 (+10%) | 16mo | $173,000 | $209 | 36 |
| 1341 Vim DR Dr | 0.55mi | 2/1.0 | 866 (+15%) | 20mo | $85,000 | $98 | 33 |
Match score weights: distance 35% · size 25% · config 20% · recency 20%. Top-matched comps best support the ARV.
Projected returns pro-forma
-3.0% appreciation · 3.0% rent growth · sell at horizon
- IRR
- 3.6%
- Equity multiple
- 1.14×
- Total profit
- $3,898
- Equity at exit
- $14,910
- IRR
- 13.1%
- Equity multiple
- 2.05×
- Total profit
- $29,275
- Equity at exit
- $8,646
Cash invested: $28,000 (down + closing). Projections, not guarantees.
Landlord ↔ Tenant lean methodology
- Overall (STATE)
- 83 Strongly Landlord-Friendly
- State Kentucky
- 83 Strongly Landlord-Friendly · R+16
- County
- — inherits STATE
- City
- — inherits STATE
ZIP-level market 40213
- Active inventory
- 47
- Price-to-rent
- 6.8×
Monthly cashflow live
- Estimated rent
- $1,233 high interval (Pro) →
- Mortgage (P&I)
- −$524
- Tax from tax record
- −$93 /mo · $1,112/yr
- Insurance
- −$42
- HOA
- −$0
- Vacancy / Maint / Mgmt
- −$259
- Net cashflow
- $316
Break-even live
UW: 25.0% down · 7.5% · 30yr · 1.5% tax · 5.0% vac · 8.0% maint · 8.0% mgmt
Financing live
Cash to close
- Down payment
- $25,000
- Closing costs
- $3,000
- Reserves months
- —
- Total cash needed
- —
Loan-product check · same deal, 3 products live
Conventional
25% down · 7.5% · 30yr
- Down + closing
- —
- Monthly P&I
- —
- Monthly cashflow
- —
- DSCR
- —
- Eligible?
- —
Personal DTI + credit; lowest rate.
DSCR
20% down · 8.5% · 30yr
- Down + closing
- —
- Monthly P&I
- —
- Monthly cashflow
- —
- DSCR
- —
- Eligible?
- —
No personal income docs; deal must DSCR.
Hard money
10% down · 12.0% · 12mo
- Down + closing
- —
- Monthly P&I
- —
- Monthly cashflow
- —
- DSCR
- —
- Eligible?
- —
Short-term bridge; refi at stabilization.
Rent comps 13 comps
| Address | Beds | Baths | Sqft | Rent | $/sqft | DOM | Units | Dist |
|---|---|---|---|---|---|---|---|---|
| 5531 Halstead Ave Louisville, KY | 2.0 | 1.0 | 1025 | $1,650 | $1.61 | 23d | 1 | 0.16mi |
| 2901 Lakeheath Dr Louisville, KY | 2.0 | 1.0–1.5 | 975 | $1,142 | $1.17 | 16d | 2 | 0.30mi |
| 2901 Lakeheath Dr Louisville, KY | 2.0 | 1.0 | 900 | $1,115 | $1.24 | 10d | 1 | 0.30mi |
| 3210 Chinquapin Ln Unit 3210-7 Louisville, KY | 1.0 | 1.0 | 650 | $750 | $1.15 | 17d | 1 | 0.46mi |
| 1214 Gilmore Ln Louisville, KY | 1.0–2.0 | 1.0–1.5 | 785 | $1,100 | $1.40 | 1d | 14 | 0.54mi |
| 5546 Indian Oaks Cir Unit EO 5736 Louisville, KY | 2.0 | 1.0 | 944 | $1,066 | $1.13 | 3d | 1 | 1.22mi |
| 5504 Lodema Way Unit 6 Louisville, KY | 1.0 | 1.0 | 570 | $899 | $1.58 | 3d | 1 | 1.23mi |
| 5504 Lodema Way Unit 4 Louisville, KY | 2.0 | 1.0 | 730 | $995 | $1.36 | 14d | 1 | 1.23mi |
| 5546 Indian Oaks Cir Louisville, KY | 1.0 | 1.0 | 644 | $837 | $1.30 | 3d | 1 | 1.23mi |
| 4205 Norene Ln Unit 4207-4 Louisville, KY | 2.0 | 1.0 | 850 | $995 | $1.17 | 23d | 1 | 1.35mi |
| 4213 Norene Ln Unit 3 Louisville, KY | 2.0 | 1.0 | 850 | $999 | $1.18 | 23d | 1 | 1.38mi |
| 4200 Medallion Ct Louisville, KY | 2.0 | 1.0 | 900 | $995 | $1.11 | 2d | 2 | 1.42mi |
| 4301 Wooded Way Ct Unit 16 Louisville, KY | 2.0 | 1.0 | 775 | $1,058 | $1.37 | 11d | 1 | 1.49mi |
Listing history 2 events
-
2026-06-10remarks 92-char remark
-
2026-06-10$100,000 Under Contract
ⓘ Source: listings_history table (triggers on properties + properties_extension) + one-shot
backfill from property_details.listing_events for pre-trigger history.
Tax reassessment forecast KY · Resets to sale price
- Current annual tax
- $1,112 · $93/mo
- Projected year-2 tax
- $1,112 · $93/mo
- Expected delta
- $0/yr ($0/mo · 0.0%)
ⓘ Screening estimate from a state-policy table — verify with the county assessor before closing.
Climate risk First Street
- Flood 6/10 Major FEMA zone X (unshaded) · 61% chance over 30 yrs
- Wildfire 1/10 Low
- Heat 5/10 Major 7 d/yr ≥105°F today · 19 d/yr by 30 yrs out
- Wind 2/10 Low 2% chance of damaging wind over 30 yrs
- Air quality 3/10 Moderate 3 unhealthy d/yr today · 5 by 30 yrs out
Nearby sold comps map
Loading sold comps map…
Walkable amenities ~0.75 mi
Loading nearby amenities…
Taxation est. · year 1
- Rental income
- $14,801
- − Mortgage interest
- −$5,602
- − Property taxes
- −$1,112
- − Insurance
- −$500
- − Repairs & maintenance
- −$1,184
- − Management
- −$1,184
- − Depreciation
- −$2,909
- Taxable income
- $2,310
- Est. tax owed @ 24.0%
- −$554
- After-tax cash flow
- $3,233/yr
For passive investors: Depreciation is non-cash, so a rental often shows a tax loss while cash-flowing — sheltering income. Rental losses are passive: they offset passive income freely, and up to $25,000/yr can offset ordinary (W-2) income if you actively participate and your MAGI is under $100k (phasing out to $0 by $150k); unused losses carry forward. On sale, claimed depreciation is recaptured at up to 25%, and gains may owe capital-gains tax (a 1031 exchange can defer both). Figures are a year-1 estimate at your 24.0% rate — not tax advice; consult a CPA.
Schools (NCES district)
- District
- Jefferson County
- NCES district ID
- 2102990
- Math proficiency
- 19% ▼ -17.00%
- Reading proficiency
- 35% ▼ -11.00%
- Median HH income
- $47,885
- Composite
- 23.45/100
- National rank
- #7884
- State rank
- #121 of 165 in KY
Livability — Louisville/Jefferson County metro government (balance)
No livability data for this city. (Only ~50 U.S. cities are tracked.)
Census & demographics
- Census place
- Louisville/Jefferson County metro government (balance), KY
- County
- Jefferson County · 790,184 people
- City population
- 419,741
- Metro
- Louisville/Jefferson County, KY-IN
- Population (ZIP)
- 16,054
- Household income
- $55,897
- Rent vs Own
- Severe rent burden
- 706.0
Population outlook (Jefferson County) Hauer SSP2
- Today (2025)
- 823,112 people
- By 2030
- 849,343 · +3.2%
- By 2040
- 895,696 · +8.8%
- By 2050
- 933,630 · +13.4%
- By 2075
- 1,028,262 · +24.9%
- By 2100
- 1,072,675 · +30.3%
Race, ethnicity, and origin ACS 2023
- Neighborhood character
- Diverse neighborhood (Simpson 0.57)
- Race & ethnicity
- White 60% Black 19% Hispanic / Latino 19% Two or more races 12%
- Hispanic origin (detail)
- Mexican 6% Cuban 11%
- Common ancestry
- Slovak 2% Lithuanian 2% Italian 1%
- Foreign-born
- 12% · Canada
- Languages at home
- 82% English-only · Spanish 16% French/Haitian/Cajun 1%
Political lean MEDSL · Jefferson
- 2024 margin
- D (+16.6) · D 57.4% · R 40.9% · Other 1.7%
- 2008→2024 swing
- +4.5pp toward D · 2008: 12.0pp · 2024: 16.6pp
- All cycles
- 2024: D+16.6 2020: D+20.1 2016: D+13.3 2012: D+11.1 2008: D+12.0
Not yet ingested
- Civics
- —
Market trends
- HPI YoY
- ▼ -153.39%
- Current HPI
- 244.8465
- Rent YoY
- —
- Metro
- Louisville/Jefferson County, KY-IN
- State GDP YoY
- ▲ 1.81%
- F500 in state
- 4
Industry mix (Fortune 500 HQ in KY)
| Industry | F500 HQs | Revenue |
|---|---|---|
| Healthcare | 1 | $118B |
|
||
| Food / Beverage | 1 | $7B |
|
||
Price history
+61.3% since first listed4 events — show timeline
- 2026-06-10 Listed $100,000 FSBO.com
- 2011-12-06 Sold (Public Records) $51,000 Public Records
- 2011-12-02 Sold (MLS) $51,000 Metro Search MLS
- 2011-09-09 Listed $62,000 Metro Search MLS
Property tax history
+4.9%/yrLatest (2025): $1,112 · +34.7% YoY. Source: county tax records.
Cash-flow waterfall
monthlySold comps — $/sqft
last 12 mo · ≤1 miLoading sold comps…