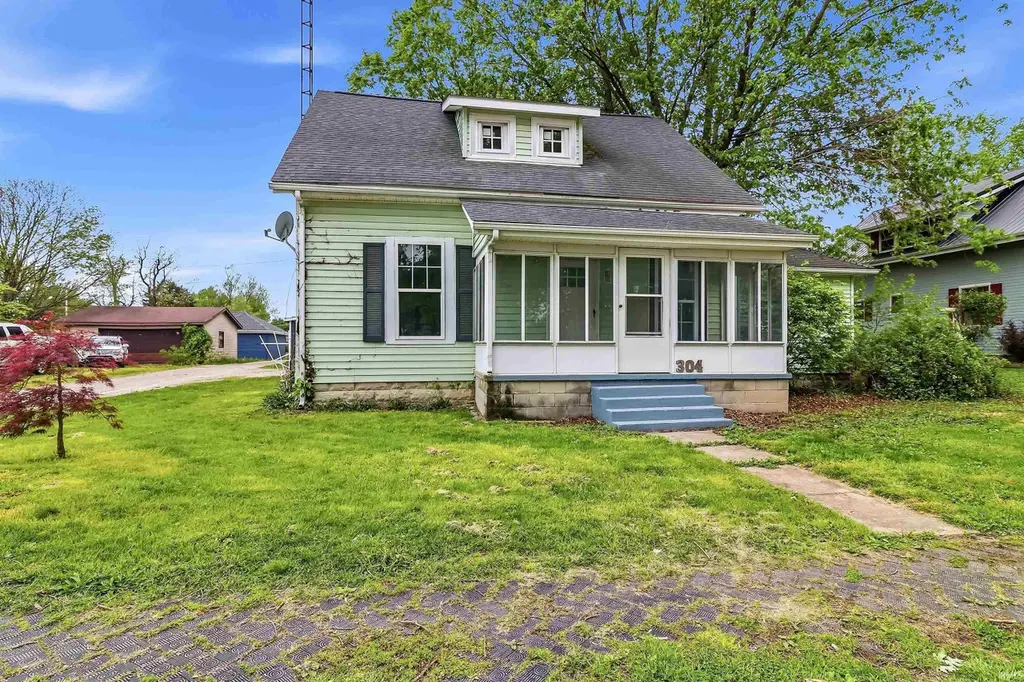
304 S 1st St · Van Buren, IN
Flood risk 1/10 · Minimal
- FEMA flood zone
- X (unshaded)
- Chance of flooding over 30 yrs
- 0.0%
- Est. flood insurance / yr
- $507 – $1,088
Fire risk 1/10 · Minimal
- Est. fire insurance / yr
- $717 – $1,331
Heat risk 3/10 · Minor
- Hot days now (above 100°F)
- 7 days/yr
- Hot days in 30 yrs
- 18 days/yr
Wind risk 2/10 · Minimal
- Chance of severe wind over 30 yrs
- 0.0%
Air-quality risk 3/10 · Minor
- Unhealthy air days now
- 2 days/yr
- Unhealthy air days in 30 yrs
- 3 days/yr
Risk factors via First Street. Map © Google.
Why this score? — see what drove the B+ grade
The composite is a weighted blend of 9 inputs, each scored 0–100. Each bar is that input's sub-score; the figure is the points it added to the 100-point composite (weight × sub-score).
- Cash flow +27.1/30.0
- ARV discount +15.0/15.0
- DSCR +9.4/10.0
- Appreciation +7.3/10.0
- 1% rule +6.2/10.0
- Schools +3.8/10.0
- Livability +3.0/5.0
- Rent growth +2.5/5.0
- Condition / age +2.5/5.0
$109,900
🖨 Deal sheet 📄 Offer letter ✓ Due diligence
Listing remarks
Welcome home to the 3-bedroom property situated on a corner lot in the quiet town of Van Buren. This home offers the perfect blend of small-town living and everyday convenience. Inside, you'll find a comfortable layout with plenty of space to make your own. Outside, the large detached garage provides excellent room for vehicles, storage, hobbies, or a workshop setup. Enjoy peaceful evenings and the charm of a desirable corner lot location. Whether you're looking for your first home, downsizing, or adding to your investment portfolio, this property gives options.
Key facts
- Corner lot
- Detached garage
- 8,712 sq ft lot
Tags
Property features AI
Exterior
- Parking: Detached 2-car garage
- Security: Smoke detector(s)
- Utilities: Public water; Public sewer; Cable connected
- Home design: Single-family residence (site-built); One story; Entry level: main level
- Construction: Vinyl siding; Shingle roof; Built on crawl space
- Exterior features: Covered, enclosed porch; Corner lot
Interior
- Kitchen: Refrigerator; Electric range
- Bathrooms: 1 full bathroom (main level)
- Heating & cooling: Natural gas forced-air heating; No central cooling
- Interior features: Open floorplan; Crawl space basement
- Laundry & utility: Washer hookup (main level); Electric dryer hookup (main level); Electric water heater
Neighborhood map
What this means for you Summary
Snapshot
- This is a 3-bed/1.0-bath single-family listed at $110k.
Deal economics
- At list price, monthly cash flow is $313 ($4k/yr) — positive.
- The deal already cash-flows at list — no discount required.
- Meets the 1% rule at list price ($1k rent vs $110k).
- Recommended offer: $108k (1.5% below list) — sets the bar for market timing.
Location & tenants
- Location reads 60/100 on livability (#529 in IN) — a middle-class / working-renter tenant base. Strengths: cost of living A+, housing A-; Watch: health & safety C-, crime D, amenities F.
- Eastbrook Community School Corporation (rural): math 42% / reading 46% proficiency, ranked #98 of 301 in IN (top 33%) — families likely to look elsewhere, expect single-tenant / working-renter base with shorter leases.
- Zoned schools: Eastbrook North Elementary (math 43% / reading 34%, grade F, #535 of 994 statewide, top 54%, 307 students, 52% FRL); Eastbrook Middle School (math 30% / reading 45%, grade F, #146 of 330 statewide, top 46%, 399 students, 48% FRL); Eastbrook High School (math 52% / reading 72%, grade B-, #41 of 369 statewide, top 12%, 509 students, 38% FRL).
- Market conditions: 9 active listings in the ZIP; 52 units permitted in Grant County in 2024 (8 in 5+ unit buildings).
Forward outlook
- In year one you build about $6k of equity ($760 loan paydown + $5k appreciation (4.6% local appreciation)).
- Grant County population projected at -18% by 2050 — secular population decline; favor cash flow + early exit over multi-decade hold.
- At projected returns (4.6% appreciation + 3.0% rent growth), your $31k cash investment doubles in ~4 years — after that, you're playing with house money.
- By year 6, paydown + projected appreciation supports a ~$31k cash-out refi (75% LTV) — recoverable capital for the next deal without selling this one.
Negotiation context
- It's been on market 24 days — a 2% lower offer ($108k) is reasonable based on typical stale-listing flexibility.
Risks & watch-outs
- Watch-outs: built in 1900 — expect roof / HVAC / electrical / plumbing capex.
Questions for the listing agent
- Built in 1900 — when were the roof, HVAC, electrical panel, plumbing, and water heater last replaced?
- Is there a deadline driving the sale (1031 exchange, divorce, estate, relocation)? That informs how much negotiation room exists.
- Schools are D-rated, which usually means shorter tenancies and higher turnover. Who's the typical renter profile here, and what's been the actual vacancy rate?
- Crime grade is D in this area — have there been break-ins, vandalism, or insurance claims at this property in the last 3 years? What carrier currently insures it and at what premium?
- What's the average days-on-market for RENTAL listings here right now (not sales)? A rising rental-DOM trend means longer vacancies and softer asking-rent achievability than the comps imply.
- What's the recent tenant-quality profile in this submarket — average credit score on applications, eviction rate, late-payment / NSF rate, and stable-employment percentage? A property-management company in the area should have these aggregated.
- How much new for-sale + rental construction is in the pipeline within 1–3 miles? Heavy new supply typically softens prices + rents 12–24 months out; constrained supply supports both.
Investment metrics
- 1% rule
- 1.12% ✓
- Cap rate
- 9.71%
- Cash-on-cash
- 12.20%
- DSCR
- 1.54
- GRM
- 7.4
CMA / ARV
- ARV (on-the-fly)
- $145,824
- Comps found
- 5
Show comp detail 5 sales within ~0.75 mi
| Address | Dist | Beds/Ba | Sqft | Sold | Price | $/sf | Match |
|---|---|---|---|---|---|---|---|
| 111 W Penn St | 0.39mi | 3/1.0 | 1,864 (+7%) | 6mo | $25,000 | $13 | 65 |
| 618 S First St | 0.28mi | 3/1.5 | 1,792 (+3%) | 18mo | $205,000 | $114 | 64 |
| 809 W Main St | 0.48mi | 4/2.5 (+1) | 1,800 (+4%) | 13mo | $125,000 | $69 | 50 |
| 722 N 1st St | 0.53mi | 3/2.0 | 1,966 (+13%) | 18mo | $165,900 | $84 | 34 |
| 708 W Main St | 0.45mi | 4/2.0 (+1) | 1,484 (-14%) | 19mo | $140,000 | $94 | 30 |
Match score weights: distance 35% · size 25% · config 20% · recency 20%. Top-matched comps best support the ARV.
Projected returns pro-forma
4.61% appreciation · 3.0% rent growth · sell at horizon
- IRR
- 22.5%
- Equity multiple
- 2.39×
- Total profit
- $42,810
- Equity at exit
- $59,721
- IRR
- 22.2%
- Equity multiple
- 4.68×
- Total profit
- $113,320
- Equity at exit
- $101,015
Cash invested: $30,772 (down + closing). Projections, not guarantees.
Landlord ↔ Tenant lean methodology
- Overall (STATE)
- 90 Strongly Landlord-Friendly
- State Indiana
- 90 Strongly Landlord-Friendly · R+11
- County
- — inherits STATE
- City
- — inherits STATE
ZIP-level market 46991
- Home prices YoY
- 2.4%
- Active inventory
- 9
- Price-to-rent
- 7.4×
Monthly cashflow live
- Estimated rent
- $1,235 medium interval (Pro) →
- Mortgage (P&I)
- −$576
- Tax from tax record
- −$41 /mo · $492/yr
- Insurance
- −$46
- HOA
- −$0
- Vacancy / Maint / Mgmt
- −$259
- Net cashflow
- $313
Break-even live
UW: 25.0% down · 7.5% · 30yr · 1.5% tax · 5.0% vac · 8.0% maint · 8.0% mgmt
Financing live
Cash to close
- Down payment
- $27,475
- Closing costs
- $3,297
- Reserves months
- —
- Total cash needed
- —
Loan-product check · same deal, 3 products live
Conventional
25% down · 7.5% · 30yr
- Down + closing
- —
- Monthly P&I
- —
- Monthly cashflow
- —
- DSCR
- —
- Eligible?
- —
Personal DTI + credit; lowest rate.
DSCR
20% down · 8.5% · 30yr
- Down + closing
- —
- Monthly P&I
- —
- Monthly cashflow
- —
- DSCR
- —
- Eligible?
- —
No personal income docs; deal must DSCR.
Hard money
10% down · 12.0% · 12mo
- Down + closing
- —
- Monthly P&I
- —
- Monthly cashflow
- —
- DSCR
- —
- Eligible?
- —
Short-term bridge; refi at stabilization.
Listing history 12 events
-
2026-06-14statusdays on market $109,900 Pending 24 DOM
-
2026-06-12days on market $109,900 Active 23 DOM
-
2026-06-09days on market $109,900 Active 20 DOM
-
2026-06-08days on market $109,900 Active 19 DOM
-
2026-06-07days on market $109,900 Active 18 DOM
-
2026-06-05days on market $109,900 Active 15 DOM
-
2026-06-03days on market $109,900 Active 14 DOM
-
2026-06-02days on market $109,900 Active 13 DOM
-
2026-06-01days on market $109,900 Active 12 DOM
-
2026-05-31days on market $109,900 Active 11 DOM
-
2026-05-30days on market $109,900 Active 10 DOM
-
2026-05-20$109,900 Active
ⓘ Source: listings_history table (triggers on properties + properties_extension) + one-shot
backfill from property_details.listing_events for pre-trigger history.
Tax reassessment forecast IN · Partial reset (capped growth)
- Current annual tax
- $492 · $41/mo
- Projected year-2 tax
- $713 · $59/mo
- Expected delta
- +$221/yr (+$18/mo · 44.9%)
ⓘ Screening estimate from a state-policy table — verify with the county assessor before closing.
Climate risk First Street
- Flood 1/10 Low FEMA zone X (unshaded) · 0% chance over 30 yrs
- Wildfire 1/10 Low
- Heat 3/10 Moderate 7 d/yr ≥100°F today · 18 d/yr by 30 yrs out
- Wind 2/10 Low 0% chance of damaging wind over 30 yrs
- Air quality 3/10 Moderate 2 unhealthy d/yr today · 3 by 30 yrs out
Nearby sold comps map
Loading sold comps map…
Walkable amenities ~0.75 mi
Loading nearby amenities…
Taxation est. · year 1
- Rental income
- $14,825
- − Mortgage interest
- −$6,156
- − Property taxes
- −$492
- − Insurance
- −$550
- − Repairs & maintenance
- −$1,186
- − Management
- −$1,186
- − Depreciation
- −$3,197
- Taxable income
- $2,058
- Est. tax owed @ 24.0%
- −$494
- After-tax cash flow
- $3,260/yr
For passive investors: Depreciation is non-cash, so a rental often shows a tax loss while cash-flowing — sheltering income. Rental losses are passive: they offset passive income freely, and up to $25,000/yr can offset ordinary (W-2) income if you actively participate and your MAGI is under $100k (phasing out to $0 by $150k); unused losses carry forward. On sale, claimed depreciation is recaptured at up to 25%, and gains may owe capital-gains tax (a 1031 exchange can defer both). Figures are a year-1 estimate at your 24.0% rate — not tax advice; consult a CPA.
Schools (NCES district)
- District
- Eastbrook Community School Corporation
- NCES district ID
- 1803030
- Math proficiency
- 42% ▬ 0.00%
- Reading proficiency
- 46% ▼ -1.00%
- Median HH income
- $55,030
- Composite
- 38.28/100
- National rank
- #4234
- State rank
- #98 of 301 in IN
Livability — Van Buren
- Score
- 60/100
- State rank
- #529
- US rank
- #19010
Category grades
Schools grade is shown separately in the Schools card above.
Census & demographics
- Census place
- Van Buren, IN
- Population (ZIP)
- 1,657
Population outlook (Grant County) Hauer SSP2
- Today (2025)
- 64,394 people
- By 2030
- 62,145 · -3.5%
- By 2040
- 57,252 · -11.1%
- By 2050
- 52,968 · -17.7%
- By 2075
- 45,986 · -28.6%
- By 2100
- 39,400 · -38.8%
Race, ethnicity, and origin ACS 2023
- Neighborhood character
- Predominantly White (90%)
- Race & ethnicity
- White 90% Two or more races 7% Hispanic / Latino 3%
- Common ancestry
- Serbian 2% Slovak 1% Lithuanian 1%
- Foreign-born
- 1% · Canada
- Languages at home
- 98% English-only · Spanish 1%
Political lean MEDSL · Grant
- 2024 margin
- Solid R (+41.8) · D 28.2% · R 70.0% · Other 1.9%
- 2008→2024 swing
- -28.7pp toward R · 2008: -13.1pp · 2024: -41.8pp
- All cycles
- 2024: R+41.8 2020: R+38.8 2016: R+39.5 2012: R+22.0 2008: R+13.1
Not yet ingested
- Civics
- —
Market trends
- HPI YoY
- ▲ 4.61%
- Current HPI
- 193.7506
- Rent YoY
- —
- Metro
- —
- State GDP YoY
- ▲ 2.90%
- F500 in state
- 18
Industry mix (Fortune 500 HQ in IN)
| Industry | F500 HQs | Revenue |
|---|---|---|
| Industrial Machinery | 2 | $37B |
|
||
| Healthcare | 1 | $177B |
|
||
| Pharmaceuticals | 1 | $45B |
|
||
| Metals / Steel | 1 | $18B |
|
||
| Agriculture | 1 | $17B |
|
||
| Packaging | 1 | $12B |
|
||
Price history
1 event — show timeline
- 2026-05-20 Listed $109,900 IRMLS
Property tax history
+53.0%/yrLatest (2025): $492 · +20.2% YoY. Source: county tax records.
Cash-flow waterfall
monthlySold comps — $/sqft
last 12 mo · ≤1 miLoading sold comps…