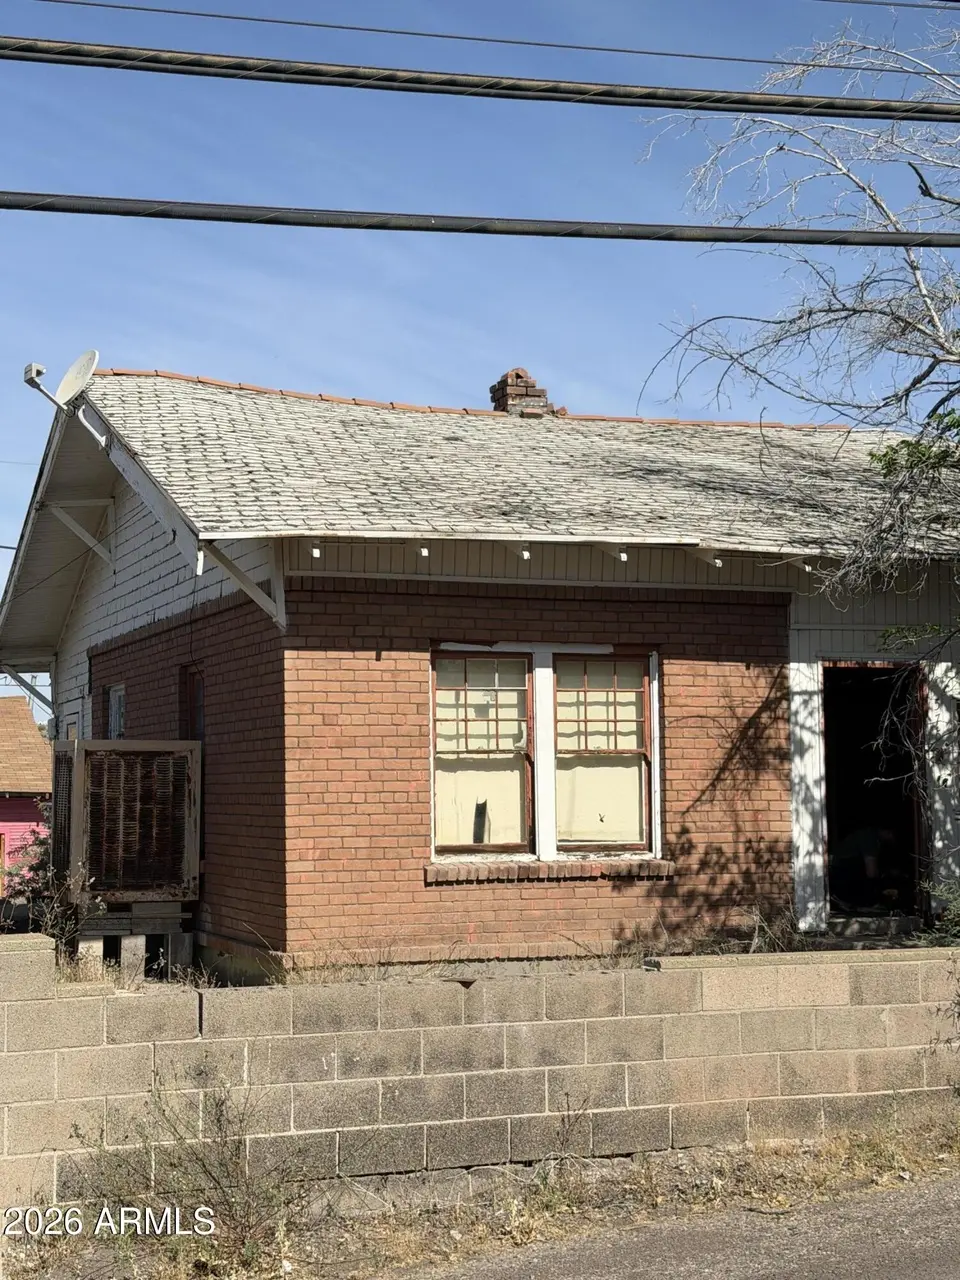
575 N Garfield Rd · Hayden, AZ
Flood risk 1/10 · Minimal
- FEMA flood zone
- X (unshaded)
- Chance of flooding over 30 yrs
- 0.0%
- Est. flood insurance / yr
- $507 – $1,088
Fire risk 5/10 · Moderate
- Est. fire insurance / yr
- $610 – $1,132
Heat risk 8/10 · Major
- Hot days now (above 109°F)
- 7 days/yr
- Hot days in 30 yrs
- 20 days/yr
Wind risk 1/10 · Minimal
- Chance of severe wind over 30 yrs
- —
Air-quality risk 1/10 · Minimal
- Unhealthy air days now
- 0 days/yr
- Unhealthy air days in 30 yrs
- 0 days/yr
Risk factors via First Street. Map © Google.
Why this score? — see what drove the D+ grade
The composite is a weighted blend of 9 inputs, each scored 0–100. Each bar is that input's sub-score; the figure is the points it added to the 100-point composite (weight × sub-score).
- Cash flow +15.0/30.0
- ARV discount +7.5/15.0
- 1% rule +5.0/10.0
- DSCR +5.0/10.0
- Appreciation +5.0/10.0
- Livability +2.9/5.0
- Rent growth +2.5/5.0
- Condition / age +2.5/5.0
- Schools +2.0/10.0
$7,500
🖨 Deal sheet 📄 Offer letter ✓ Due diligence
Listing remarks MLS
RED BRICK WITH FRAME CONSTRUCTION. THIS FIXER UPPER COULD BE SET BACK TO BEAUTIFUL. SMALL TOWN CHARMER. SELLER IS A LICENSED AGENT DOING BUSINESS IN ARIZONA. SELLER AND AGENT ARE RELATED.
Key facts
- 3,673 sq ft lot
- 2 parking spots
- Built 1950
Property features AI
Finance
- HOA & community: No association fees
Exterior
- Parking: 2 open parking spaces
- Utilities: City water; Public sewer; Utilities: see remarks
- Home design: Single-family residence; Fee simple ownership
- Construction: Wood-frame construction; Other roof type
- Exterior features: Fencing: see remarks
Interior
- Kitchen: Eat-in kitchen
- Bedrooms: 2 bedrooms
- Bathrooms: 1 full bathroom
- Heating & cooling: Heating: see remarks; Cooling: see remarks
- Interior features: Eat-in kitchen; Full bathroom connected to the master bedroom
- Laundry & utility: No laundry hookups inside (none listed)
Neighborhood map
What this means for you Summary
Snapshot
- This is a 2-bed/1.0-bath single-family listed at $8k.
Deal economics
- At list price, monthly cash flow is $936 ($11k/yr) — positive.
- The deal already cash-flows at list — no discount required.
- Meets the 1% rule at list price ($1k rent vs $8k).
Location & tenants
- Location reads 57/100 on livability (#223 in AZ) — a working-class tenant base; expect higher turnover. Strengths: cost of living A+, housing A+; Watch: crime F, amenities F, commute F.
- Hayden-Winkelman Unified District (4212) (rural): math 20% / reading 20% proficiency, ranked #374 of 501 in AZ (top 75%) — low school quality limits family demand, transient renter base, plan for 1-2y turnover; 64% free/reduced lunch — lower-income household profile, screen leases tightly.
- Zoned schools: Leonor Hambly K-8 (math 8% / reading 22%, grade F, #888 of 1,109 statewide, top 81%, 221 students, 83% FRL); Hayden High School (math 5% / reading 15%, grade F, #298 of 381 statewide, top 90%, 93 students, 50% FRL) — zoned schools at 66% FRL track the district average.
- Market conditions: 6 active listings in the ZIP; 1 comparable units currently listed for rent nearby; 217 units permitted in Gila County in 2024 (0 in 5+ unit buildings).
Forward outlook
- In year one you build about $277 of equity ($52 loan paydown + $225 appreciation (3.0% local appreciation)).
- Gila County population projected at -18% by 2050 — secular population decline; favor cash flow + early exit over multi-decade hold.
- At projected returns (3.0% appreciation + 3.0% rent growth), your $2k cash investment doubles in ~1 year — after that, you're playing with house money.
Negotiation context
- Only 1 days on market — expect competitive offers; lowballing is unlikely to land.
- 2 sale attempts since 9y ago with the ask held roughly flat each time — persistent listings suggest the price (not the market) is what's stuck; bring a comps-based counter.
Risks & watch-outs
- Watch-outs: built in 1950 — expect roof / HVAC / electrical / plumbing capex.
- Climate carrying-cost: moderate wildfire risk; extreme-heat days projected 7→20/yr by 2055 (HVAC capex compounding) — expect insurance premiums to compound above CPI over the hold.
Questions for the listing agent
- Built in 1950 — when were the roof, HVAC, electrical panel, plumbing, and water heater last replaced?
- Is there a deadline driving the sale (1031 exchange, divorce, estate, relocation)? That informs how much negotiation room exists.
- Schools are D-rated, which usually means shorter tenancies and higher turnover. Who's the typical renter profile here, and what's been the actual vacancy rate?
- Crime grade is F in this area — have there been break-ins, vandalism, or insurance claims at this property in the last 3 years? What carrier currently insures it and at what premium?
- The area grade is low — what's the realistic commute time and amenity access for the typical tenant pool here? Any planned neighborhood developments (good or bad) we should know about?
- What's the average days-on-market for RENTAL listings here right now (not sales)? A rising rental-DOM trend means longer vacancies and softer asking-rent achievability than the comps imply.
- What's the recent tenant-quality profile in this submarket — average credit score on applications, eviction rate, late-payment / NSF rate, and stable-employment percentage? A property-management company in the area should have these aggregated.
- How much new for-sale + rental construction is in the pipeline within 1–3 miles? Heavy new supply typically softens prices + rents 12–24 months out; constrained supply supports both.
Investment metrics
- 1% rule
- 16.67% ✓
- Cap rate
- 156.00%
- Cash-on-cash
- 534.67%
- DSCR
- 24.79
- GRM
- 0.5
CMA / ARV
- ARV (on-the-fly)
- $23,080
- Comps found
- 4
Show comp detail 4 sales within ~0.75 mi
| Address | Dist | Beds/Ba | Sqft | Sold | Price | $/sf | Match |
|---|---|---|---|---|---|---|---|
| 151 S Hillcrest Ave | 0.12mi | 3/1.0 (+1) | 1,144 (-1%) | 21mo | $37,000 | $32 | 70 |
| 194 S Terrace Dr | 0.27mi | 2/1.0 | 1,093 (-5%) | 10mo | $17,000 | $16 | 70 |
| 706 N San Pedro Rd | 0.38mi | 3/2.0 (+1) | 1,000 (-13%) | 6mo | $15,000 | $15 | 46 |
| 676 N San Pedro Rd | 0.34mi | 1/1.2 (-1) | 990 (-14%) | 14mo | $20,000 | $20 | 43 |
Match score weights: distance 35% · size 25% · config 20% · recency 20%. Top-matched comps best support the ARV.
Projected returns pro-forma
3.0% appreciation · 3.0% rent growth · sell at horizon
- IRR
- —
- Equity multiple
- 29.82×
- Total profit
- $60,516
- Equity at exit
- $3,372
- IRR
- —
- Equity multiple
- 63.83×
- Total profit
- $131,939
- Equity at exit
- $5,197
Cash invested: $2,100 (down + closing). Projections, not guarantees.
Landlord ↔ Tenant lean methodology
- Overall (STATE)
- 87 Strongly Landlord-Friendly
- State Arizona
- 87 Strongly Landlord-Friendly · R+3
- County
- — inherits STATE
- City
- — inherits STATE
ZIP-level market 85135
- Active inventory
- 6
- Price-to-rent
- 0.5×
Monthly cashflow live
- Estimated rent
- $1,250 medium interval (Pro) →
- Mortgage (P&I)
- −$39
- Tax est. 1.5%
- −$9 /mo · $112/yr
- Insurance
- −$3
- HOA
- −$0
- Vacancy / Maint / Mgmt
- −$262
- Net cashflow
- $936
Break-even live
UW: 25.0% down · 7.5% · 30yr · 1.5% tax · 5.0% vac · 8.0% maint · 8.0% mgmt
Financing live
Cash to close
- Down payment
- $1,875
- Closing costs
- $225
- Reserves months
- —
- Total cash needed
- —
Loan-product check · same deal, 3 products live
Conventional
25% down · 7.5% · 30yr
- Down + closing
- —
- Monthly P&I
- —
- Monthly cashflow
- —
- DSCR
- —
- Eligible?
- —
Personal DTI + credit; lowest rate.
DSCR
20% down · 8.5% · 30yr
- Down + closing
- —
- Monthly P&I
- —
- Monthly cashflow
- —
- DSCR
- —
- Eligible?
- —
No personal income docs; deal must DSCR.
Hard money
10% down · 12.0% · 12mo
- Down + closing
- —
- Monthly P&I
- —
- Monthly cashflow
- —
- DSCR
- —
- Eligible?
- —
Short-term bridge; refi at stabilization.
Rent comps 1 comps
| Address | Beds | Baths | Sqft | Rent | $/sqft | DOM | Units | Dist |
|---|---|---|---|---|---|---|---|---|
| 576 N Garfield Rd Hayden, AZ | 2.0 | 1.0 | 1030 | $1,250 | $1.21 | 1d | 1 | 0.02mi |
Listing history 5 events
-
2026-05-28status Pending
-
2026-05-28$7,500 Active
-
2018-01-31soldstatus $11,000 187-char remark
Show marketing remark (187 chars)
RED BRICK WITH FRAME CONSTRUCTION. THIS FIXER UPPER COULD BE SET BACK TO BEAUTIFUL. SMALL TOWN CHARMER. SELLER IS A LICENSED AGENT DOING BUSINESS IN ARIZONA. SELLER AND AGENT ARE RELATED.
-
2017-04-19$15,000 187-char remark
Show marketing remark (187 chars)
RED BRICK WITH FRAME CONSTRUCTION. THIS FIXER UPPER COULD BE SET BACK TO BEAUTIFUL. SMALL TOWN CHARMER. SELLER IS A LICENSED AGENT DOING BUSINESS IN ARIZONA. SELLER AND AGENT ARE RELATED.
-
2013-04-30soldstatus $15,000
ⓘ Source: listings_history table (triggers on properties + properties_extension) + one-shot
backfill from property_details.listing_events for pre-trigger history.
Climate risk First Street
- Flood 1/10 Low FEMA zone X (unshaded) · 0% chance over 30 yrs
- Wildfire 5/10 Major
- Heat 8/10 Severe 7 d/yr ≥109°F today · 20 d/yr by 30 yrs out
- Wind 1/10 Low
- Air quality 1/10 Low 0 unhealthy d/yr today · 0 by 30 yrs out
Nearby sold comps map
Loading sold comps map…
Walkable amenities ~0.75 mi
Loading nearby amenities…
Taxation est. · year 1
- Rental income
- $15,000
- − Mortgage interest
- −$420
- − Property taxes
- −$112
- − Insurance
- −$38
- − Repairs & maintenance
- −$1,200
- − Management
- −$1,200
- − Depreciation
- −$218
- Taxable income
- $11,812
- Est. tax owed @ 24.0%
- −$2,835
- After-tax cash flow
- $8,393/yr
For passive investors: Depreciation is non-cash, so a rental often shows a tax loss while cash-flowing — sheltering income. Rental losses are passive: they offset passive income freely, and up to $25,000/yr can offset ordinary (W-2) income if you actively participate and your MAGI is under $100k (phasing out to $0 by $150k); unused losses carry forward. On sale, claimed depreciation is recaptured at up to 25%, and gains may owe capital-gains tax (a 1031 exchange can defer both). Figures are a year-1 estimate at your 24.0% rate — not tax advice; consult a CPA.
Schools (NCES district)
- District
- Hayden-Winkelman Unified District (4212)
- NCES district ID
- 0403730
- Math proficiency
- 20% ▬ 0.00%
- Reading proficiency
- 20% ▼ -5.00%
- Median HH income
- $38,514
- Composite
- 20.06/100
- National rank
- #13860
- State rank
- #374 of 501 in AZ
Livability — Hayden
- Score
- 57/100
- State rank
- #223
- US rank
- #21713
Category grades
Schools grade is shown separately in the Schools card above.
Census & demographics
- Census place
- Hayden, AZ
- City population
- 412
- Population (ZIP)
- 412
Population outlook (Gila County) Hauer SSP2
- Today (2025)
- 50,229 people
- By 2030
- 48,202 · -4.0%
- By 2040
- 44,101 · -12.2%
- By 2050
- 41,041 · -18.3%
- By 2075
- 37,536 · -25.3%
- By 2100
- 32,485 · -35.3%
Race, ethnicity, and origin ACS 2023
- Neighborhood character
- Predominantly Hispanic (85%)
- Race & ethnicity
- Hispanic / Latino 85% Two or more races 40% White 15%
- Hispanic origin (detail)
- Mexican 85%
- Common ancestry
- English 1% Portuguese 1% Romanian 1%
- Foreign-born
- 2% · Canada
- Languages at home
- 56% English-only · Spanish 44%
Political lean MEDSL · Gila
- 2024 margin
- Solid R (+37.6) · D 30.8% · R 68.4%
- 2008→2024 swing
- -9.8pp toward R · 2008: -27.8pp · 2024: -37.6pp
- All cycles
- 2024: R+37.6 2020: R+34.1 2016: R+32.4 2012: R+26.4 2008: R+27.8
Not yet ingested
- Civics
- —
Market trends
- HPI YoY
- —
- Current HPI
- —
- Rent YoY
- —
- Metro
- —
- State GDP YoY
- ▲ 4.54%
- F500 in state
- 20
Industry mix (Fortune 500 HQ in AZ)
| Industry | F500 HQs | Revenue |
|---|---|---|
| Technology | 2 | $13B |
|
||
| Mining / Metals | 1 | $23B |
|
||
| Environmental Services | 1 | $16B |
|
||
| Metals / Steel | 1 | $14B |
|
||
| Technology Distribution | 1 | $9B |
|
||
| Homebuilding | 1 | $8B |
|
||
Price history
-50.0% since first listed5 events — show timeline
- 2026-05-28 Pending — ARMLS
- 2026-05-28 Listed $7,500 ARMLS
- 2018-01-31 Sold (MLS) $11,000 ARMLS
- 2017-04-19 Listed $15,000 ARMLS
- 2013-04-30 Sold (Public Records) $15,000 Public Records
Property tax history
+0.9%/yrLatest (2025): $498 · +4.8% YoY. Source: county tax records.
Cash-flow waterfall
monthlySold comps — $/sqft
last 12 mo · ≤1 miLoading sold comps…