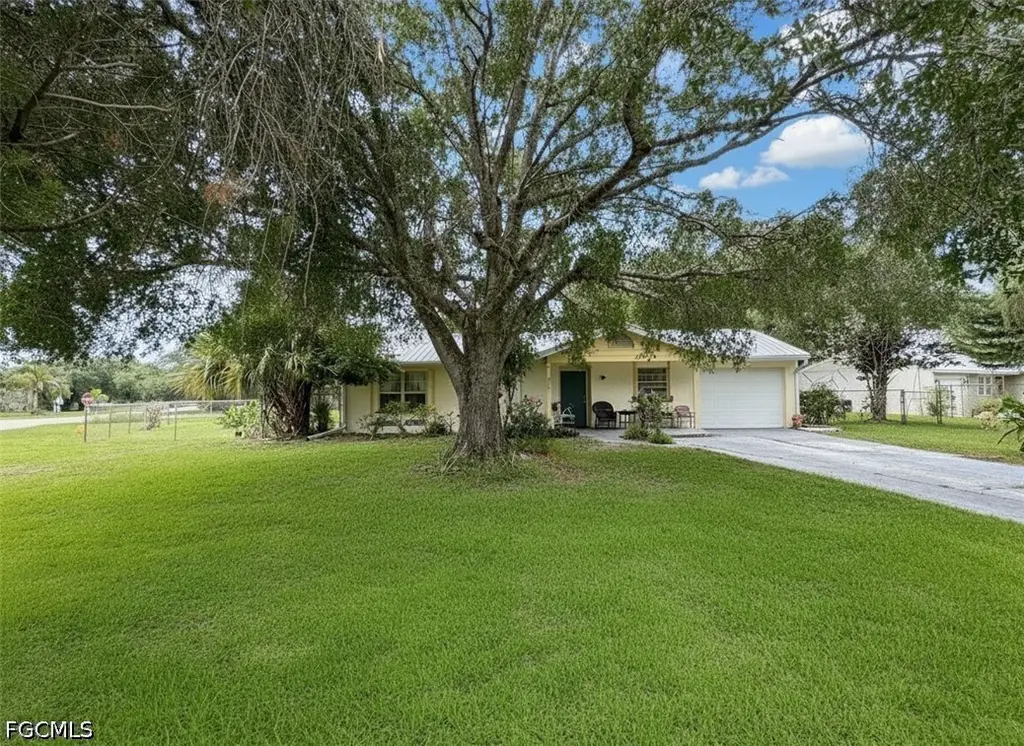
4001 Bishop Cir · Port LaBelle, FL
Flood risk 4/10 · Minor
- FEMA flood zone
- X (unshaded)
- Chance of flooding over 30 yrs
- 0.22%
- Est. flood insurance / yr
- $507 – $1,088
Fire risk 3/10 · Minor
- Est. fire insurance / yr
- $947 – $1,759
Heat risk 9/10 · Severe
- Hot days now (above 108°F)
- 7 days/yr
- Hot days in 30 yrs
- 25 days/yr
Wind risk 10/10 · Severe
- Chance of severe wind over 30 yrs
- 99.0%
Air-quality risk 2/10 · Minimal
- Unhealthy air days now
- 2 days/yr
- Unhealthy air days in 30 yrs
- 2 days/yr
Risk factors via First Street. Map © Google.
Why this score? — see what drove the C grade
The composite is a weighted blend of 9 inputs, each scored 0–100. Each bar is that input's sub-score; the figure is the points it added to the 100-point composite (weight × sub-score).
- Cash flow +14.3/30.0
- ARV discount +13.6/15.0
- Appreciation +10.0/10.0
- DSCR +4.3/10.0
- Schools +3.1/10.0
- Livability +3.1/5.0
- 1% rule +3.0/10.0
- Rent growth +2.5/5.0
- Condition / age +2.5/5.0
$219,000
🖨 Deal sheet 📄 Offer letter ✓ Due diligence
Listing remarks
Situated on a desirable corner lot with greenbelt views, this well-maintained home offers peace of mind and low-cost ownership. Highlights include a metal roof, storm shutters for every window, a fenced backyard with shed & a variety of fruit trees, and a screened lanai ideal for outdoor living. Community amenities — pool and park — are just a short walk away. Not located in a flood zone, and HOA dues are an exceptional value at only $180/year.
Key facts
- Metal roof
- Greenbelt views
- Storm shutters
Tags
Property features AI
Finance
- Financial info: Pets allowed
- HOA & community: Homeowners association with an annual fee of $180; Association amenities include pool, park, guest suites, storage, road maintenance, and street lights; Non-gated community
Exterior
- Parking: Attached garage with two parking spaces (one covered)
- Utilities: Public water; Public sewer; Cable available; High speed internet available; Underground utilities; Irrigation from well; Publicly maintained paved road
- Home design: Single-story; Single family zoning; Resale property; Property faces north; Corner lot; Lot exposed to south
- Construction: Stucco and wood frame construction; Metal roof; Built on conventional foundation
- Exterior features: Fence; Patio; Lanai; Screened porch; Porch; Shutters (manual); Outbuilding
Interior
- Kitchen: Dishwasher; Microwave; Range; Refrigerator
- Bedrooms: Guest quarters
- Flooring: Vinyl
- Bathrooms: 2 full bathrooms
- Heating & cooling: Central heating (electric); Central air (electric); Ceiling fans
- Interior features: Built-in features; Family/dining room; Living/dining room; Shower only with separate shower; Window treatments; Window coverings; High speed internet available; Unfurnished
- Laundry & utility: Laundry located in garage
Neighborhood map
What this means for you Summary
Snapshot
- This is a 2-bed/2.0-bath single-family listed at $219k.
Deal economics
- At list price, monthly cash flow is $39 ($473/yr) — positive.
- The deal already cash-flows at list — no discount required.
- To meet the 1% rule (rent ≥ 1% of price), the offer needs to be $175k (20.3% below list).
- Recommended offer: $175k (20.3% below list) — sets the bar for 1% rule.
- Cap rate 6.5% vs local median 5.1% in Port LaBelle — meaningfully above typical; check what's discounted (condition, days-on-market, listing class) to confirm the premium yield is real.
Location & tenants
- Location reads 62/100 on livability (#750 in FL) — a middle-class / working-renter tenant base. Strengths: cost of living A+, housing A+; Watch: schools F, amenities F, commute F.
- Hendry (town): math 35% / reading 40% proficiency, ranked #65 of 73 in FL (top 89%) — families likely to look elsewhere, expect single-tenant / working-renter base with shorter leases; 75% free/reduced lunch — lower-income household profile, screen leases tightly.
- Market conditions: 942 active listings in the ZIP; 1 comparable units currently listed for rent nearby; 557 units permitted in Hendry County in 2024 (45 in 5+ unit buildings).
- This rent runs 37% of the median local income ($57k/yr) — at the standard rent-burdened threshold; future hikes will face affordability resistance.
Forward outlook
- In year one you build about $23k of equity ($2k loan paydown + $22k appreciation (10.0% local appreciation)).
- Hendry County population projected to shrink 7% by 2050 — rents likely to lag national; underwrite the cash flow, not the appreciation.
- At projected returns (10.0% appreciation + 3.0% rent growth), your $61k cash investment doubles in ~3 years — after that, you're playing with house money.
- By year 2, paydown + projected appreciation supports a ~$38k cash-out refi (75% LTV) — recoverable capital for the next deal without selling this one.
Negotiation context
- Only 6 days on market — expect competitive offers; lowballing is unlikely to land.
- 3 sale attempts since 27y ago with the ask held roughly flat each time — persistent listings suggest the price (not the market) is what's stuck; bring a comps-based counter.
- Current owner paid $69k; list at $219k implies a 216% gain — meaningful room to come down on a strong offer.
Risks & watch-outs
- Climate carrying-cost: severe wind risk, 99% chance of damaging wind over 30y; extreme-heat days projected 7→25/yr by 2055 (HVAC capex compounding) — expect insurance premiums to compound above CPI over the hold.
Questions for the listing agent
- What does the HOA fee cover, when was the last increase, and are there any pending special assessments or reserve-fund shortfalls?
- Is there a deadline driving the sale (1031 exchange, divorce, estate, relocation)? That informs how much negotiation room exists.
- Schools are F-rated, which usually means shorter tenancies and higher turnover. Who's the typical renter profile here, and what's been the actual vacancy rate?
- What's the average days-on-market for RENTAL listings here right now (not sales)? A rising rental-DOM trend means longer vacancies and softer asking-rent achievability than the comps imply.
- What's the recent tenant-quality profile in this submarket — average credit score on applications, eviction rate, late-payment / NSF rate, and stable-employment percentage? A property-management company in the area should have these aggregated.
- How much new for-sale + rental construction is in the pipeline within 1–3 miles? Heavy new supply typically softens prices + rents 12–24 months out; constrained supply supports both.
Investment metrics
- 1% rule
- 0.80% ✗
- Cap rate
- 6.51%
- Cash-on-cash
- 0.77%
- DSCR
- 1.03
- GRM
- 10.5
CMA / ARV
- ARV (on-the-fly)
- $253,044
- Comps found
- 10
Show comp detail 10 sales within ~0.75 mi
| Address | Dist | Beds/Ba | Sqft | Sold | Price | $/sf | Match |
|---|---|---|---|---|---|---|---|
| 4015 E Palomar Cir | 0.16mi | 3/2.0 (+1) | 1,129 (-5%) | 18mo | $230,000 | $204 | 64 |
| 4049 Rainbow Cir | 0.46mi | 2/2.0 | 1,262 (+6%) | 12mo | $230,000 | $182 | 58 |
| 4032 S Edgewater Cir | 0.36mi | 3/2.0 (+1) | 1,218 (+2%) | 23mo | $228,000 | $187 | 55 |
| 4002 Cascade Ln | 0.34mi | 3/2.0 (+1) | 1,344 (+13%) | 3mo | $280,000 | $208 | 55 |
| 2006 Inglewood Cir | 0.49mi | 3/2.0 (+1) | 1,246 (+5%) | 13mo | $265,990 | $213 | 54 |
| 2004 Inglewood Cir | 0.48mi | 3/2.0 (+1) | 1,246 (+5%) | 18mo | $264,888 | $213 | 49 |
| 4086 Rainbow Cir | 0.38mi | 3/2.0 (+1) | 1,271 (+7%) | 20mo | $277,500 | $218 | 49 |
| 4017 W Palomar Cir | 0.17mi | 3/2.0 (+1) | 1,012 (-15%) | 18mo | $188,000 | $186 | 47 |
| 2001 Jeronimo Rd | 0.54mi | 3/2.0 (+1) | 1,356 (+14%) | 5mo | $295,000 | $218 | 42 |
| 2029 Jeronimo Rd | 0.67mi | 3/2.0 (+1) | 1,292 (+9%) | 11mo | $299,900 | $232 | 39 |
Match score weights: distance 35% · size 25% · config 20% · recency 20%. Top-matched comps best support the ARV.
Projected returns pro-forma
10.0% appreciation · 3.0% rent growth · sell at horizon
- IRR
- 24.8%
- Equity multiple
- 2.98×
- Total profit
- $121,704
- Equity at exit
- $197,293
- IRR
- 21.9%
- Equity multiple
- 6.81×
- Total profit
- $356,263
- Equity at exit
- $425,469
Cash invested: $61,320 (down + closing). Projections, not guarantees.
Landlord ↔ Tenant lean methodology
- Overall (STATE)
- 87 Strongly Landlord-Friendly
- State Florida
- 87 Strongly Landlord-Friendly · R+3
- County
- — inherits STATE
- City
- — inherits STATE
ZIP-level market 33935
- Home prices YoY
- 16.3%
- Active inventory
- 942
- Price-to-rent
- 10.5×
Monthly cashflow live
- Estimated rent
- $1,746 medium interval (Pro) →
- Mortgage (P&I)
- −$1,148
- Tax from tax record
- −$85 /mo · $1,023/yr
- Insurance
- −$91
- HOA
- −$15
- Vacancy / Maint / Mgmt
- −$367
- Net cashflow
- $39
Break-even live
UW: 25.0% down · 7.5% · 30yr · 1.5% tax · 5.0% vac · 8.0% maint · 8.0% mgmt
Financing live
Cash to close
- Down payment
- $54,750
- Closing costs
- $6,570
- Reserves months
- —
- Total cash needed
- —
Loan-product check · same deal, 3 products live
Conventional
25% down · 7.5% · 30yr
- Down + closing
- —
- Monthly P&I
- —
- Monthly cashflow
- —
- DSCR
- —
- Eligible?
- —
Personal DTI + credit; lowest rate.
DSCR
20% down · 8.5% · 30yr
- Down + closing
- —
- Monthly P&I
- —
- Monthly cashflow
- —
- DSCR
- —
- Eligible?
- —
No personal income docs; deal must DSCR.
Hard money
10% down · 12.0% · 12mo
- Down + closing
- —
- Monthly P&I
- —
- Monthly cashflow
- —
- DSCR
- —
- Eligible?
- —
Short-term bridge; refi at stabilization.
Rent comps 1 comps
| Address | Beds | Baths | Sqft | Rent | $/sqft | DOM | Units | Dist |
|---|---|---|---|---|---|---|---|---|
| 5029 S Rosebud Cir Labelle, FL | 3.0 | 2.0 | 1389 | $1,780 | $1.28 | 23d | 1 | 1.09mi |
HOA detail
- Monthly dues
- $15 · $180/yr
- Likely covers
- pool
Listing history 12 events
-
2026-06-18days on market $219,000 Active 6 DOM
-
2026-06-17days on market $219,000 Active 5 DOM
-
2026-06-16days on market $219,000 Active 4 DOM
-
2026-06-15days on market $219,000 Active 3 DOM
-
2026-06-13days on market $219,000 Active 1 DOM
-
2026-06-10days on market $219,000 Active 9 DOM
-
2026-06-09days on market $219,000 Active 8 DOM
-
2026-06-08days on market $219,000 Active 7 DOM
-
2026-06-07days on market $219,000 Active 6 DOM
-
2026-06-03days on market $219,000 Active 2 DOM
-
2026-06-02remarks 450-char remark
-
2026-06-02$219,000 Active 1 DOM
ⓘ Source: listings_history table (triggers on properties + properties_extension) + one-shot
backfill from property_details.listing_events for pre-trigger history.
Tax reassessment forecast FL · Resets to sale price
- Current annual tax
- $1,023 · $85/mo
- Projected year-2 tax
- $1,818 · $151/mo
- Expected delta
- +$795/yr (+$66/mo · 77.7%)
ⓘ Screening estimate from a state-policy table — verify with the county assessor before closing.
Climate risk First Street
- Flood 4/10 Moderate FEMA zone X (unshaded) · 22% chance over 30 yrs
- Wildfire 3/10 Moderate
- Heat 9/10 Extreme 7 d/yr ≥108°F today · 25 d/yr by 30 yrs out
- Wind 10/10 Extreme 99% chance of damaging wind over 30 yrs
- Air quality 2/10 Low 2 unhealthy d/yr today · 2 by 30 yrs out
Nearby sold comps map
Loading sold comps map…
Walkable amenities ~0.75 mi
Loading nearby amenities…
Taxation est. · year 1
- Rental income
- $20,952
- − Mortgage interest
- −$12,267
- − Property taxes
- −$1,023
- − Insurance
- −$1,095
- − Repairs & maintenance
- −$1,676
- − Management
- −$1,676
- − HOA
- −$180
- − Depreciation
- −$6,371
- Taxable loss
- −$3,336
- Est. tax savings @ 24.0%
- +$801
- After-tax cash flow
- $1,274/yr
For passive investors: Depreciation is non-cash, so a rental often shows a tax loss while cash-flowing — sheltering income. Rental losses are passive: they offset passive income freely, and up to $25,000/yr can offset ordinary (W-2) income if you actively participate and your MAGI is under $100k (phasing out to $0 by $150k); unused losses carry forward. On sale, claimed depreciation is recaptured at up to 25%, and gains may owe capital-gains tax (a 1031 exchange can defer both). Figures are a year-1 estimate at your 24.0% rate — not tax advice; consult a CPA.
Schools (NCES district)
- District
- Hendry
- NCES district ID
- 1200780
- Math proficiency
- 35% ▼ -11.00%
- Reading proficiency
- 40% ▼ -4.00%
- Median HH income
- $37,043
- Composite
- 31.16/100
- National rank
- #6054
- State rank
- #65 of 73 in FL
Livability — Port LaBelle
- Score
- 62/100
- State rank
- #750
- US rank
- #16264
Category grades
Schools grade is shown separately in the Schools card above.
Census & demographics
- Census place
- Port LaBelle, FL
- County
- Hendry County · 23,186 people
- City population
- 23,186
- Metro
- Clewiston, FL
- Population (ZIP)
- 23,186
- Household income
- $57,009
- Rent vs Own
- Severe rent burden
- 498.0
Population outlook (Hendry County) Hauer SSP2
- Today (2025)
- 38,866 people
- By 2030
- 38,558 · -0.8%
- By 2040
- 37,743 · -2.9%
- By 2050
- 36,117 · -7.1%
- By 2075
- 30,070 · -22.6%
- By 2100
- 21,966 · -43.5%
Race, ethnicity, and origin ACS 2023
- Neighborhood character
- Majority Hispanic (56%)
- Race & ethnicity
- Hispanic / Latino 56% White 39% Two or more races 21% Black 2% Native American 2%
- Hispanic origin (detail)
- Mexican 40% Puerto Rican 3% Cuban 5%
- Common ancestry
- Lithuanian 2% Serbian 2% Slovak 1%
- Foreign-born
- 27% · Canada, Jamaica
- Languages at home
- 50% English-only · Spanish 50%
Political lean MEDSL · Hendry
- 2024 margin
- Solid R (+38.3) · D 30.4% · R 68.7%
- 2008→2024 swing
- -31.1pp toward R · 2008: -7.2pp · 2024: -38.3pp
- All cycles
- 2024: R+38.3 2020: R+23.0 2016: R+14.2 2012: R+5.9 2008: R+7.2
Not yet ingested
- Civics
- —
Market trends
- HPI YoY
- ▲ 75.20%
- Current HPI
- 537.4928
- Rent YoY
- —
- Metro
- Clewiston, FL
- State GDP YoY
- ▲ 3.28%
- F500 in state
- 36
Industry mix (Fortune 500 HQ in FL)
| Industry | F500 HQs | Revenue |
|---|---|---|
| Industrial Technology | 2 | $29B |
|
||
| Insurance | 2 | $17B |
|
||
| Retail | 1 | $60B |
|
||
| Technology Distribution | 1 | $58B |
|
||
| Homebuilding | 1 | $35B |
|
||
| Technology Manufacturing | 1 | $35B |
|
||
Price history
+216.0% since first listed5 events — show timeline
- 2026-06-01 Listed $219,000 FORTMLS
- 2025-10-29 Listing Removed — FORTMLS
- 2025-09-08 Listed $225,000 FORTMLS
- 1999-05-03 Listed $36,900 FORTMLS
- 1982-08-01 Sold (Public Records) $69,300 Public Records
Property tax history
+7.2%/yrLatest (2025): $1,023 · +15.1% YoY. Source: county tax records.
Cash-flow waterfall
monthlySold comps — $/sqft
last 12 mo · ≤1 miLoading sold comps…