 🏷️ Likely Rental
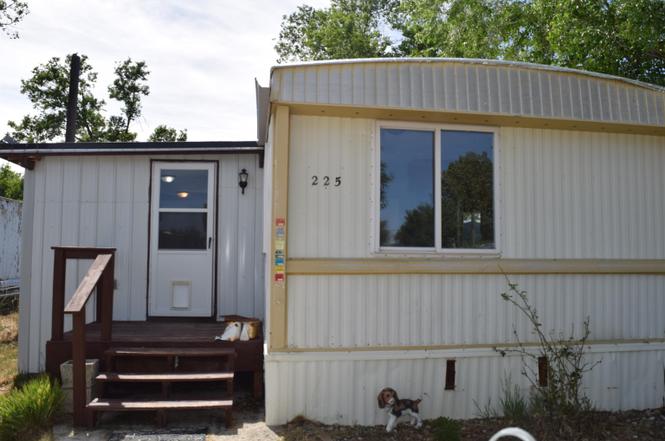
225 N 5th St · Glenrock, WY
Flood risk 1/10 · Minimal
- FEMA flood zone
- X (unshaded)
- Chance of flooding over 30 yrs
- 0.0%
- Est. flood insurance / yr
- $507 – $1,088
Fire risk 5/10 · Moderate
- Est. fire insurance / yr
- $564 – $1,046
Heat risk 3/10 · Minor
- Hot days now (above 92°F)
- 7 days/yr
- Hot days in 30 yrs
- 19 days/yr
Wind risk 1/10 · Minimal
- Chance of severe wind over 30 yrs
- —
Air-quality risk 2/10 · Minimal
- Unhealthy air days now
- 1 days/yr
- Unhealthy air days in 30 yrs
- 3 days/yr
Risk factors via First Street. Map © Google.
Why this score? — see what drove the B+ grade
The composite is a weighted blend of 9 inputs, each scored 0–100. Each bar is that input's sub-score; the figure is the points it added to the 100-point composite (weight × sub-score).
- Cash flow +30.0/30.0
- DSCR +10.0/10.0
- Appreciation +10.0/10.0
- 1% rule +9.2/10.0
- ARV discount +7.5/15.0
- Schools +3.7/10.0
- Livability +3.5/5.0
- Rent growth +2.5/5.0
- Condition / age +2.5/5.0
$65,000
🖨 Deal sheet 📄 Offer letter ✓ Due diligence
Listing remarks MLS
Owned Lot!!! This incredibly maintained 2 bedroom 1 bath 12x60 Skyline manufactured home is being sold with an owned lot of over 5000 sqft! The interior is incredibly clean and features an open concept and a fenced lot. It is currently rented for $650/mo and tenant pays their own utilities. The tenant is open to staying, but is only on a month to month basis. Dont let this opportuntity for a great home for you, or as an investment pass you by.
Key facts
- 20 x 10 storage shed
- Lots of parking
- Nicely tiled shower
Tags
Property features AI
Exterior
- Parking: No garage
- Utilities: Public water; Public sewer; Natural gas available
- Home design: Residential mobile home; Mobile/MFD detached
- Construction: Aluminum siding
- Exterior features: Chain link fencing; Shed on the property
Interior
- Kitchen: Range and oven; Refrigerator; No additional kitchen details provided
- Flooring: Carpet
- Heating & cooling: Forced air heating
- Interior features: Washer and dryer included; Refrigerator; Range/Oven
- Laundry & utility: Washer; Dryer
Neighborhood map
What this means for you Summary
Snapshot
- This is a 2-bed/1.0-bath single-family listed at $65k.
Deal economics
- At list price, monthly cash flow is $278 ($3k/yr) — positive.
- The deal already cash-flows at list — no discount required.
- Meets the 1% rule at list price ($921 rent vs $65k).
Location & tenants
- Location reads 69/100 on livability (#46 in WY) — a middle-class / working-renter tenant base. Strengths: crime A+, cost of living A+, housing A+; Watch: amenities F, commute F, health & safety F.
- Converse County School District #2 (rural): math 37% / reading 46% proficiency, ranked #37 of 41 in WY (top 90%) — families likely to look elsewhere, expect single-tenant / working-renter base with shorter leases.
- Market conditions: 64 active listings in the ZIP; 6 units permitted in Converse County in 2024 (0 in 5+ unit buildings).
Forward outlook
- In year one you build about $7k of equity ($449 loan paydown + $6k appreciation (10.0% local appreciation)).
- Converse County population projected at +21% by 2050 — long-run rental-demand tailwind backs the buy-and-hold thesis.
- At projected returns (10.0% appreciation + 3.0% rent growth), your $18k cash investment doubles in ~2 years — after that, you're playing with house money.
- By year 5, paydown + projected appreciation supports a ~$32k cash-out refi (75% LTV) — recoverable capital for the next deal without selling this one.
Negotiation context
- Only 2 days on market — expect competitive offers; lowballing is unlikely to land.
- 2 sale attempts since 5y ago with the ask held roughly flat each time — persistent listings suggest the price (not the market) is what's stuck; bring a comps-based counter.
Risks & watch-outs
- Climate carrying-cost: moderate wildfire risk — expect insurance premiums to compound above CPI over the hold.
Questions for the listing agent
- Built in 1977 — when were the roof, HVAC, electrical panel, plumbing, and water heater last replaced?
- Is there a deadline driving the sale (1031 exchange, divorce, estate, relocation)? That informs how much negotiation room exists.
- What's the average days-on-market for RENTAL listings here right now (not sales)? A rising rental-DOM trend means longer vacancies and softer asking-rent achievability than the comps imply.
- What's the recent tenant-quality profile in this submarket — average credit score on applications, eviction rate, late-payment / NSF rate, and stable-employment percentage? A property-management company in the area should have these aggregated.
- How much new for-sale + rental construction is in the pipeline within 1–3 miles? Heavy new supply typically softens prices + rents 12–24 months out; constrained supply supports both.
Investment metrics
- 1% rule
- 1.42% ✓
- Cap rate
- 11.43%
- Cash-on-cash
- 18.35%
- DSCR
- 1.82
- GRM
- 5.9
CMA / ARV
- ARV (on-the-fly)
- $211,564
- Comps found
- 4
Show comp detail 4 sales within ~0.75 mi
| Address | Dist | Beds/Ba | Sqft | Sold | Price | $/sf | Match |
|---|---|---|---|---|---|---|---|
| 16 Monkey Mountain Rd | 0.34mi | 2/1.5 | 884 (-3%) | 18mo | $219,900 | $249 | 62 |
| 103 E Birch St | 0.40mi | 2/1.0 | 1,044 (+15%) | 15mo | $185,000 | $177 | 44 |
| 74 Mesa Verde | 0.68mi | 3/1.0 (+1) | 1,008 (+11%) | 2mo | $234,900 | $233 | 44 |
| 654 S 2nd St | 0.71mi | 2/1.0 | 870 (-4%) | 21mo | $180,000 | $207 | 42 |
Match score weights: distance 35% · size 25% · config 20% · recency 20%. Top-matched comps best support the ARV.
Projected returns pro-forma
10.0% appreciation · 3.0% rent growth · sell at horizon
- IRR
- 37.9%
- Equity multiple
- 3.92×
- Total profit
- $53,138
- Equity at exit
- $58,557
- IRR
- 32.7%
- Equity multiple
- 8.83×
- Total profit
- $142,572
- Equity at exit
- $126,281
Cash invested: $18,200 (down + closing). Projections, not guarantees.
Landlord ↔ Tenant lean methodology
- Overall (STATE)
- 90 Strongly Landlord-Friendly
- State Wyoming
- 90 Strongly Landlord-Friendly · R+25
- County
- — inherits STATE
- City
- — inherits STATE
ZIP-level market 82637
- Home prices YoY
- 12.5%
- Active inventory
- 64
- Price-to-rent
- 5.9×
Monthly cashflow live
- Estimated rent
- $921 medium interval (Pro) →
- Mortgage (P&I)
- −$341
- Tax est. 1.5%
- −$81 /mo · $975/yr
- Insurance
- −$27
- HOA
- −$0
- Vacancy / Maint / Mgmt
- −$193
- Net cashflow
- $278
Break-even live
UW: 25.0% down · 7.5% · 30yr · 1.5% tax · 5.0% vac · 8.0% maint · 8.0% mgmt
Financing live
Cash to close
- Down payment
- $16,250
- Closing costs
- $1,950
- Reserves months
- —
- Total cash needed
- —
Loan-product check · same deal, 3 products live
Conventional
25% down · 7.5% · 30yr
- Down + closing
- —
- Monthly P&I
- —
- Monthly cashflow
- —
- DSCR
- —
- Eligible?
- —
Personal DTI + credit; lowest rate.
DSCR
20% down · 8.5% · 30yr
- Down + closing
- —
- Monthly P&I
- —
- Monthly cashflow
- —
- DSCR
- —
- Eligible?
- —
No personal income docs; deal must DSCR.
Hard money
10% down · 12.0% · 12mo
- Down + closing
- —
- Monthly P&I
- —
- Monthly cashflow
- —
- DSCR
- —
- Eligible?
- —
Short-term bridge; refi at stabilization.
Listing history 2 events
-
2026-06-19days on market $65,000 Active 2 DOM
-
2026-06-17$65,000 Active 1 DOM
ⓘ Source: listings_history table (triggers on properties + properties_extension) + one-shot
backfill from property_details.listing_events for pre-trigger history.
Climate risk First Street
- Flood 1/10 Low FEMA zone X (unshaded) · 0% chance over 30 yrs
- Wildfire 5/10 Major
- Heat 3/10 Moderate 7 d/yr ≥92°F today · 19 d/yr by 30 yrs out
- Wind 1/10 Low
- Air quality 2/10 Low 1 unhealthy d/yr today · 3 by 30 yrs out
Nearby sold comps map
Loading sold comps map…
Walkable amenities ~0.75 mi
Loading nearby amenities…
Taxation est. · year 1
- Rental income
- $11,050
- − Mortgage interest
- −$3,641
- − Property taxes
- −$975
- − Insurance
- −$325
- − Repairs & maintenance
- −$884
- − Management
- −$884
- − Depreciation
- −$1,891
- Taxable income
- $2,450
- Est. tax owed @ 24.0%
- −$588
- After-tax cash flow
- $2,751/yr
For passive investors: Depreciation is non-cash, so a rental often shows a tax loss while cash-flowing — sheltering income. Rental losses are passive: they offset passive income freely, and up to $25,000/yr can offset ordinary (W-2) income if you actively participate and your MAGI is under $100k (phasing out to $0 by $150k); unused losses carry forward. On sale, claimed depreciation is recaptured at up to 25%, and gains may owe capital-gains tax (a 1031 exchange can defer both). Figures are a year-1 estimate at your 24.0% rate — not tax advice; consult a CPA.
Schools (NCES district)
- District
- Converse County School District #2
- NCES district ID
- 5602150
- Math proficiency
- 37% ▼ -6.00%
- Reading proficiency
- 46% ▼ -4.00%
- Median HH income
- $60,412
- Composite
- 36.7/100
- National rank
- #4600
- State rank
- #37 of 41 in WY
Livability — Glenrock
- Score
- 69/100
- State rank
- #46
- US rank
- #8819
Category grades
Schools grade is shown separately in the Schools card above.
Census & demographics
- Census place
- Glenrock, WY
- Population (ZIP)
- 4,178
Population outlook (Converse County) Hauer SSP2
- Today (2025)
- 15,525 people
- By 2030
- 16,132 · +3.9%
- By 2040
- 17,428 · +12.3%
- By 2050
- 18,791 · +21.0%
- By 2075
- 22,822 · +47.0%
- By 2100
- 25,592 · +64.8%
Race, ethnicity, and origin ACS 2023
- Neighborhood character
- Predominantly White (91%)
- Race & ethnicity
- White 91% Two or more races 7% Hispanic / Latino 4%
- Common ancestry
- Portuguese 4% Iranian 4% Slovak 4%
- Foreign-born
- 2% · Canada
- Languages at home
- 96% English-only · Spanish 2% Other Indo-European 1%
Political lean MEDSL · Converse
- 2024 margin
- Solid R (+73.5) · D 12.7% · R 86.2% · Other 1.1%
- 2008→2024 swing
- -18.6pp toward R · 2008: -54.9pp · 2024: -73.5pp
- All cycles
- 2024: R+73.5 2020: R+72.5 2016: R+74.0 2012: R+62.9 2008: R+54.9
Not yet ingested
- Civics
- —
Market trends
- HPI YoY
- ▲ 41.31%
- Current HPI
- 370.62
- Rent YoY
- —
- Metro
- —
- State GDP YoY
- —
- F500 in state
- 0
Price history
+116.7% since first listed4 events — show timeline
- 2026-06-17 Listed $65,000 WMLS
- 2021-07-30 Sold (Public Records) — Public Records
- 2021-07-29 Sold (MLS) — WMLS
- 2021-03-21 Listed $30,000 WMLS
Property tax history
-1.3%/yrLatest (2025): $113 · -21.5% YoY. Source: county tax records.
Cash-flow waterfall
monthlySold comps — $/sqft
last 12 mo · ≤1 miLoading sold comps…