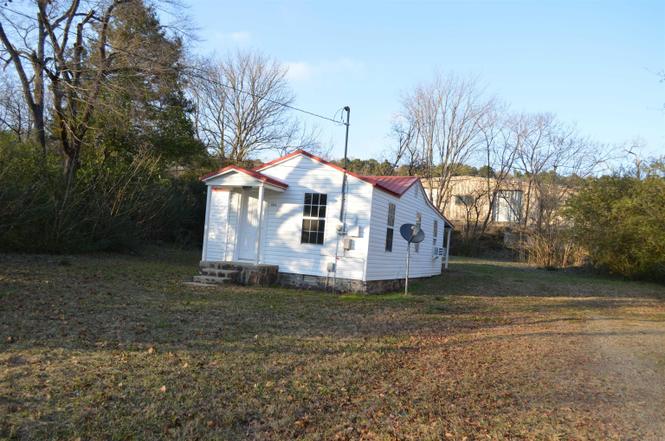
1104 W Searcy St · Heber Springs, AR
Flood risk 1/10 · Minimal
- FEMA flood zone
- X (unshaded)
- Chance of flooding over 30 yrs
- 0.0%
- Est. flood insurance / yr
- $507 – $1,088
Fire risk 3/10 · Minor
- Est. fire insurance / yr
- $1,499 – $2,785
Heat risk 6/10 · Moderate
- Hot days now (above 108°F)
- 7 days/yr
- Hot days in 30 yrs
- 20 days/yr
Wind risk 3/10 · Minor
- Chance of severe wind over 30 yrs
- 6.0%
Air-quality risk 1/10 · Minimal
- Unhealthy air days now
- 0 days/yr
- Unhealthy air days in 30 yrs
- 0 days/yr
Risk factors via First Street. Map © Google.
Why this score? — see what drove the C+ grade
The composite is a weighted blend of 9 inputs, each scored 0–100. Each bar is that input's sub-score; the figure is the points it added to the 100-point composite (weight × sub-score).
- Cash flow +26.6/30.0
- ARV discount +10.8/15.0
- DSCR +9.1/10.0
- 1% rule +6.0/10.0
- Schools +4.1/10.0
- Livability +2.9/5.0
- Rent growth +2.5/5.0
- Condition / age +2.5/5.0
- Appreciation +0.0/10.0
$69,900
🖨 Deal sheet (PDF) 📄 Offer letter ✓ Due diligence
Listing remarks
INVESTORS! This is a newly fixed up doll house. New windows, new floor coverings, new heat and air window units. Covered back patio off master bedroom. Cute as can be. Priced right. Large lot. Great location for walking downtown, Harp's, Dollar General and Library. Home will not qualify for FHA, RD and VA. Must be a cash buyer or bank loan.
Key facts
- Great location
- Large lot
- New floor coverings
Tags
Neighborhood map
What this means for you Summary
Snapshot
- This is a 2-bed/1.0-bath single-family listed at $70k.
Deal economics
- At list price, monthly cash flow is $187 ($2k/yr) — positive.
- The deal already cash-flows at list — no discount required.
- Meets the 1% rule at list price ($766 rent vs $70k).
- Cap rate 9.5% vs local median 2.1% in Heber Springs — top-decile yield for the area; either an underpriced asset or a hidden risk that comps aren't pricing in. Stress-test before assuming the spread holds.
Location & tenants
- Location reads 58/100 on livability (#329 in AR) — a working-class tenant base; expect higher turnover. Strengths: cost of living A+; Watch: crime C-, employment D+, amenities F.
- Heber Springs School District (town): math 50% / reading 49% proficiency, ranked #19 of 238 in AR (top 8%) — families likely to look elsewhere, expect single-tenant / working-renter base with shorter leases.
- Zoned schools: Heber Springs Elem. School (math 48% / reading 40%, grade F, #164 of 454 statewide, top 37%, 756 students, 61% FRL); Heber Springs High School (math 37% / reading 49%, grade F, #37 of 292 statewide, top 12%, 484 students, 40% FRL).
- Market conditions: 287 active listings in the ZIP; 2 comparable units currently listed for rent nearby; 13 units permitted in Cleburne County in 2024 (0 in 5+ unit buildings).
Forward outlook
- Local home prices are declining (-3.0%/yr); year-one equity from $483 of loan paydown is wiped out by about $2k of value loss. Plan a longer hold.
- Cleburne County population projected at -18% by 2050 — secular population decline; favor cash flow + early exit over multi-decade hold.
- At projected returns (-3.0% appreciation + 3.0% rent growth), your $20k cash investment doubles in ~10 years — after that, you're playing with house money.
Negotiation context
- Only 6 days on market — expect competitive offers; lowballing is unlikely to land.
- Current owner paid $18k; list at $70k implies a 288% gain — meaningful room to come down on a strong offer.
Risks & watch-outs
- Watch-outs: built in 1946 — expect roof / HVAC / electrical / plumbing capex.
- Climate carrying-cost: extreme-heat days projected 7→20/yr by 2055 (HVAC capex compounding) — expect insurance premiums to compound above CPI over the hold.
Questions for the listing agent
- Built in 1946 — when were the roof, HVAC, electrical panel, plumbing, and water heater last replaced?
- Is there a deadline driving the sale (1031 exchange, divorce, estate, relocation)? That informs how much negotiation room exists.
- What's the average days-on-market for RENTAL listings here right now (not sales)? A rising rental-DOM trend means longer vacancies and softer asking-rent achievability than the comps imply.
- What's the recent tenant-quality profile in this submarket — average credit score on applications, eviction rate, late-payment / NSF rate, and stable-employment percentage? A property-management company in the area should have these aggregated.
- How much new for-sale + rental construction is in the pipeline within 1–3 miles? Heavy new supply typically softens prices + rents 12–24 months out; constrained supply supports both.
Investment metrics
- 1% rule
- 1.10% ✓
- Cap rate
- 9.51%
- Cash-on-cash
- 11.49%
- DSCR
- 1.51
- GRM
- 7.6
CMA / ARV
- ARV (on-the-fly)
- $75,400
- Comps found
- 5
Show comp detail 5 sales within ~0.75 mi
| Address | Dist | Beds/Ba | Sqft | Sold | Price | $/sf | Match |
|---|---|---|---|---|---|---|---|
| 1107 W Quitman St | 0.09mi | 2/1.0 | 832 (+15%) | 15mo | $95,500 | $115 | 59 |
| 705 S 10th St | 0.43mi | 2/1.0 | 768 (+6%) | 21mo | $80,000 | $104 | 53 |
| 805 S 5th St | 0.65mi | 2/1.0 | 672 (-7%) | 6mo | $42,000 | $63 | 52 |
| 622 Cedar St | 0.48mi | 2/1.0 | 816 (+13%) | 19mo | $115,000 | $141 | 41 |
| 707 S 10th St | 0.40mi | 2/1.0 | 832 (+15%) | 20mo | $83,000 | $100 | 40 |
Match score weights: distance 35% · size 25% · config 20% · recency 20%. Top-matched comps best support the ARV.
Projected returns pro-forma
-3.0% appreciation · 3.0% rent growth · sell at horizon
- IRR
- 0.8%
- Equity multiple
- 1.03×
- Total profit
- $579
- Equity at exit
- $10,422
- IRR
- 10.4%
- Equity multiple
- 1.80×
- Total profit
- $15,755
- Equity at exit
- $6,044
Cash invested: $19,572 (down + closing). Projections, not guarantees.
Landlord ↔ Tenant lean methodology
- Overall (STATE)
- 92 Strongly Landlord-Friendly
- State Arkansas
- 92 Strongly Landlord-Friendly · R+14
- County
- — inherits STATE
- City
- — inherits STATE
ZIP-level market 72543
- Home prices YoY
- -26.7%
- Active inventory
- 287
- Price-to-rent
- 7.6×
Monthly cashflow live
- Estimated rent
- $766 medium interval (Pro) →
- Mortgage (P&I)
- −$367
- Tax from tax record
- −$22 /mo · $265/yr
- Insurance
- −$29
- HOA
- −$0
- Vacancy / Maint / Mgmt
- −$161
- Net cashflow
- $187
Break-even live
Sensitivity live
| Price | -10% $227 | -5% $207 | +0% $187 | +5% $168 | +10% $148 |
|---|---|---|---|---|---|
| Rent | -10% $127 | -5% $157 | +0% $187 | +5% $218 | +10% $248 |
| Rate | -1.0pp $223 | -0.5pp $205 | base $187 | +0.5pp $169 | +1.0pp $151 |
UW: 25.0% down · 7.5% · 30yr · 1.5% tax · 5.0% vac · 8.0% maint · 8.0% mgmt
Financing live
Cash to close
- Down payment
- $17,475
- Closing costs
- $2,097
- Reserves months
- —
- Total cash needed
- —
Loan-product check · same deal, 3 products live
Conventional
25% down · 7.5% · 30yr
- Down + closing
- —
- Monthly P&I
- —
- Monthly cashflow
- —
- DSCR
- —
- Eligible?
- —
Personal DTI + credit; lowest rate.
DSCR
20% down · 8.5% · 30yr
- Down + closing
- —
- Monthly P&I
- —
- Monthly cashflow
- —
- DSCR
- —
- Eligible?
- —
No personal income docs; deal must DSCR.
Hard money
10% down · 12.0% · 12mo
- Down + closing
- —
- Monthly P&I
- —
- Monthly cashflow
- —
- DSCR
- —
- Eligible?
- —
Short-term bridge; refi at stabilization.
Rent comps 2 comps
| Address | Beds | Baths | Sqft | Rent | $/sqft | DOM | Units | Dist |
|---|---|---|---|---|---|---|---|---|
| 311 Colonial Dr Unit 1 Heber Springs, AR | 2.0 | 1.0 | 720 | $775 | $1.08 | 44d | 1 | 0.65mi |
| 400 N Conway St Heber Springs, AR | 2.0 | 1.0 | 650 | $750 | $1.15 | 24d | 1 | 1.05mi |
Listing history 4 events
-
2025-12-16status Under Contract
-
2025-12-08$69,900 New Listing
-
1994-12-01soldstatus $18,000
-
1974-11-26soldstatus $8,000
ⓘ Source: listings_history table (triggers on properties + properties_extension) + one-shot
backfill from property_details.listing_events for pre-trigger history.
Tax reassessment forecast AR · Resets to sale price
- Current annual tax
- $265 · $22/mo
- Projected year-2 tax
- $447 · $37/mo
- Expected delta
- +$182/yr (+$15/mo · 68.8%)
ⓘ Screening estimate from a state-policy table — verify with the county assessor before closing.
Climate risk First Street
- Flood 1/10 Low FEMA zone X (unshaded) · 0% chance over 30 yrs
- Wildfire 3/10 Moderate
- Heat 6/10 Major 7 d/yr ≥108°F today · 20 d/yr by 30 yrs out
- Wind 3/10 Moderate 6% chance of damaging wind over 30 yrs
- Air quality 1/10 Low 0 unhealthy d/yr today · 0 by 30 yrs out
Nearby sold comps map
Loading sold comps map…
Walkable amenities ~0.75 mi
Loading nearby amenities…
Taxation est. · year 1
- Rental income
- $9,192
- − Mortgage interest
- −$3,915
- − Property taxes
- −$265
- − Insurance
- −$350
- − Repairs & maintenance
- −$735
- − Management
- −$735
- − Depreciation
- −$2,033
- Taxable income
- $1,158
- Est. tax owed @ 24.0%
- −$278
- After-tax cash flow
- $1,971/yr
For passive investors: Depreciation is non-cash, so a rental often shows a tax loss while cash-flowing — sheltering income. Rental losses are passive: they offset passive income freely, and up to $25,000/yr can offset ordinary (W-2) income if you actively participate and your MAGI is under $100k (phasing out to $0 by $150k); unused losses carry forward. On sale, claimed depreciation is recaptured at up to 25%, and gains may owe capital-gains tax (a 1031 exchange can defer both). Figures are a year-1 estimate at your 24.0% rate — not tax advice; consult a CPA.
Schools (NCES district)
- District
- Heber Springs School District
- NCES district ID
- 0507560
- Math proficiency
- 50% ▼ -11.00%
- Reading proficiency
- 49% ▼ -11.00%
- Median HH income
- $39,577
- Composite
- 41.39/100
- National rank
- #3478
- State rank
- #19 of 238 in AR
Livability — Heber Springs
- Score
- 58/100
- State rank
- #329
- US rank
- #21491
Category grades
Schools grade is shown separately in the Schools card above.
Census & demographics
- Census place
- Heber Springs, AR
- Population (ZIP)
- 12,642
Population outlook (Cleburne County) Hauer SSP2
- Today (2025)
- 24,198 people
- By 2030
- 23,324 · -3.6%
- By 2040
- 21,566 · -10.9%
- By 2050
- 19,916 · -17.7%
- By 2075
- 16,744 · -30.8%
- By 2100
- 13,303 · -45.0%
Race, ethnicity, and origin ACS 2023
- Neighborhood character
- Predominantly White (93%)
- Race & ethnicity
- White 93% Two or more races 3% Hispanic / Latino 3%
- Common ancestry
- Italian 3% Slovak 2% Lithuanian 2%
- Foreign-born
- 1%
- Languages at home
- 99% English-only · Spanish 1%
Political lean MEDSL · Cleburne
- 2024 margin
- Solid R (+67.9) · D 15.2% · R 83.2% · Other 1.6%
- 2008→2024 swing
- -23.7pp toward R · 2008: -44.2pp · 2024: -67.9pp
- All cycles
- 2024: R+67.9 2020: R+65.8 2016: R+61.4 2012: R+52.2 2008: R+44.2
Not yet ingested
- Civics
- —
Market trends
- HPI YoY
- ▼ -78.45%
- Current HPI
- 215.4322
- Rent YoY
- —
- Metro
- —
- State GDP YoY
- ▲ 3.80%
- F500 in state
- 10
Industry mix (Fortune 500 HQ in AR)
| Industry | F500 HQs | Revenue |
|---|---|---|
| Retail | 1 | $681B |
|
||
| Food / Agriculture | 1 | $53B |
|
||
| Retail / Energy | 1 | $22B |
|
||
| Transportation / Logistics | 1 | $12B |
|
||
| Energy | 1 | $4B |
|
||
Price history
+773.8% since first listed4 events — show timeline
- 2025-12-16 Pending — CARMLS
- 2025-12-08 Listed $69,900 CARMLS
- 1994-12-01 Sold (Public Records) $18,000 Public Records
- 1974-11-26 Sold (Public Records) $8,000 Public Records
Property tax history
+3.4%/yrLatest (2025): $265 · +10.0% YoY. Source: county tax records.
Cash-flow waterfall
monthlySold comps — $/sqft
last 12 mo · ≤1 miLoading sold comps…