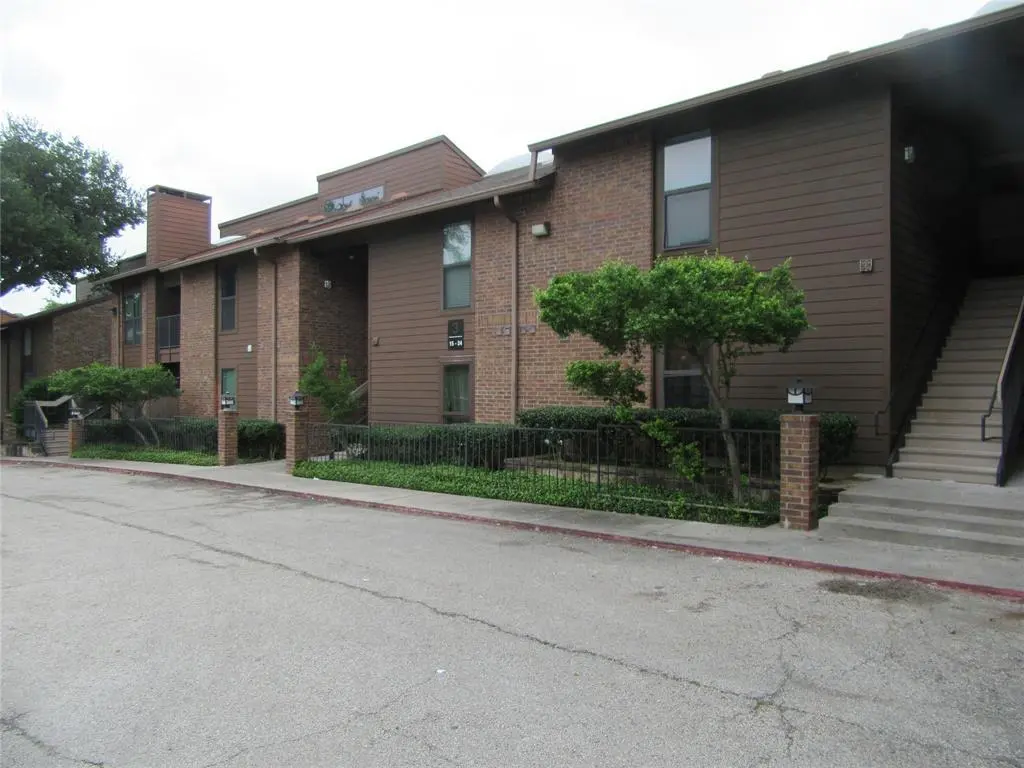
7522 Holly Hill Dr #18 · Dallas, TX
Flood risk 1/10 · Minimal
- FEMA flood zone
- X (unshaded)
- Chance of flooding over 30 yrs
- 0.0%
- Est. flood insurance / yr
- $507 – $1,088
Fire risk 3/10 · Minor
- Est. fire insurance / yr
- $1,222 – $2,270
Heat risk 7/10 · Major
- Hot days now (above 109°F)
- 7 days/yr
- Hot days in 30 yrs
- 23 days/yr
Wind risk 6/10 · Moderate
- Chance of severe wind over 30 yrs
- 27.0%
Air-quality risk 3/10 · Minor
- Unhealthy air days now
- 3 days/yr
- Unhealthy air days in 30 yrs
- 3 days/yr
Risk factors via First Street. Map © Google.
Why this score? — see what drove the F grade
The composite is a weighted blend of 9 inputs, each scored 0–100. Each bar is that input's sub-score; the figure is the points it added to the 100-point composite (weight × sub-score).
- ARV discount +13.3/15.0
- 1% rule +5.2/10.0
- Livability +4.0/5.0
- Cash flow +3.1/30.0
- Rent growth +3.0/5.0
- Schools +2.8/10.0
- Condition / age +2.5/5.0
- DSCR +0.0/10.0
- Appreciation +0.0/10.0
$119,800
🖨 Deal sheet (PDF) 📄 Offer letter ✓ Due diligence
Listing remarks
NICE SECOND FLOOR CONDO WITH VAULTED CEILINGS AND SKYLIGHTS, NICE OPEN FLOOR PLAN, LUXURY VINYL PLANK FLOORING, ELECTRIC FIREPLACE, LOTS OF UPDATES, WASHER AND DRYER, HUGE WALK IN CLOSET. ACCESS GATES, COVERED PARKING. GREAT CONDO.
Key facts
- Open floor plan
- Second floor condo
- Vaulted ceilings
Tags
Property features AI
Finance
- Other: No municipal utility district; No barns; Restrictions include no smoking and other restrictions
- Financial info: Treat as clear loan type; No second mortgage indicated
- HOA & community: Mandatory association (Holly Oaks); Monthly association fee; Association fee covers front yard maintenance, insurance, management fees, sewer, and water
Exterior
- Parking: Assigned covered parking; 1 covered space; 1 carport space
- Utilities: City water; City sewer; Electricity available
- Home design: Condominium (residential); Two-story building; Unit located on floor 2; Preowned (built in 1979); No accessibility features listed; Complex: HOLLY OAKS
- Construction: Brick and siding exterior; Built in 1979
- Exterior features: No fencing; Condo/Townhome lot setting; Sidewalks; Curbs; Concrete
Interior
- Kitchen: Dishwasher; Disposal; Electric cooktop; Electric oven; Electric range; Microwave; Refrigerator
- Bedrooms: Primary bedroom on level 1
- Bathrooms: 1 full bathroom
- Heating & cooling: Central heating (electric); Central air conditioning (electric); Electric fireplace
- Interior features: Vaulted ceilings; Pantry; Walk-in closet(s); One living area; One dining area; 3 total rooms
- Laundry & utility: Washer; Dryer
Neighborhood map
What this means for you Summary
Snapshot
- This is a 1-bed/1.0-bath condo listed at $120k.
Deal economics
- At list price, monthly cash flow is $-386 ($-5k/yr) — negative.
- To cash-flow at today's rent, offer at most $62k (48.4% below list).
- Meets the 1% rule at list price ($1k rent vs $120k).
- Recommended offer: $62k (48.4% below list) — sets the bar for cash-flow.
Location & tenants
- Location reads 81/100 on livability (#24 in TX, #1,380 nationally) — a professional / high-income tenant draw. Strengths: amenities A+, commute A+, housing A+; Watch: crime F.
- Dallas ISD (urban): math 31% / reading 36% proficiency, ranked #559 of 826 in TX (top 68%) — families likely to look elsewhere, expect single-tenant / working-renter base with shorter leases; 83% free/reduced lunch — lower-income household profile, screen leases tightly.
- Zoned schools: Jack Lowe Sr El (math 67% / reading 72%, grade A-, #146 of 4,322 statewide, top 4%, 526 students, 98% FRL).
- Zoned-school proficiency averages 70% at this address vs 34% district-wide (+36 pts) — the actual schools serving this property are materially stronger than the Dallas ISD average implies; a family-tenant draw the district grade alone would hide.
- Market conditions: Rents rising (+2.0%/yr); 214 active listings in the ZIP; 40 comparable units currently listed for rent nearby; rentals at typical pace (median 23d on market — plan ~3-4 weeks tenant-placement turnaround); 12,577 units permitted in Dallas County in 2024 (6,829 in 5+ unit buildings).
Forward outlook
- Local home prices are declining (-3.0%/yr); year-one equity from $828 of loan paydown is wiped out by about $4k of value loss. Plan a longer hold.
- Dallas County population projected at +35% by 2050 — long-run rental-demand tailwind backs the buy-and-hold thesis.
Negotiation context
- It's been on market 51 days — a 3% lower offer ($116k) is reasonable based on typical stale-listing flexibility.
Risks & watch-outs
- Watch-outs: property tax is 2.6% of price; HOA is 34% of rent.
- Climate carrying-cost: major wind risk, 27% chance of damaging wind over 30y; extreme-heat days projected 7→23/yr by 2055 (HVAC capex compounding) — expect insurance premiums to compound above CPI over the hold.
Questions for the listing agent
- What do current leases actually rent for vs. the listed asking? Can we see a recent rent roll and the last 12 months of T-12 income?
- It's been on market 51 days. Have you received any prior offers? Is the seller open to a 48% concession, seller financing, or rate buy-down credit?
- Built in 1979 — when were the roof, HVAC, electrical panel, plumbing, and water heater last replaced?
- Property tax is high relative to price — has the assessment been appealed recently, and will the sale trigger a re-assessment?
- What does the HOA fee cover, when was the last increase, and are there any pending special assessments or reserve-fund shortfalls?
- Any open or pending special assessments — roof, HVAC, plumbing, elevator, façade? What's the per-unit balance and payoff schedule, and is the seller paying it off at close or rolling it to the buyer?
- Is there a deadline driving the sale (1031 exchange, divorce, estate, relocation)? That informs how much negotiation room exists.
- Crime grade is F in this area — have there been break-ins, vandalism, or insurance claims at this property in the last 3 years? What carrier currently insures it and at what premium?
- The area grade is low — what's the realistic commute time and amenity access for the typical tenant pool here? Any planned neighborhood developments (good or bad) we should know about?
- What's the average days-on-market for RENTAL listings here right now (not sales)? A rising rental-DOM trend means longer vacancies and softer asking-rent achievability than the comps imply.
- What's the recent tenant-quality profile in this submarket — average credit score on applications, eviction rate, late-payment / NSF rate, and stable-employment percentage? A property-management company in the area should have these aggregated.
- How much new apartment / multifamily construction is in the pipeline within 1–3 miles? Heavy new supply (>2% of stock underway) typically softens rents 12–24 months out; light construction supports rent growth.
Investment metrics
- 1% rule
- 1.02% ✓
- Cap rate
- 2.43%
- Cash-on-cash
- -13.79%
- DSCR
- 0.39
- GRM
- 8.2
CMA / ARV
- ARV (median comp)
- $137,595
- List price
- $119,800
- Delta
- -12.93%
- Verdict
- UNDERPRICED
- Comps
- 20 within 1.0 mi
Projected returns pro-forma
-3.0% appreciation · 1.96% rent growth · sell at horizon
- IRR
- -44.1%
- Equity multiple
- -0.34×
- Total profit
- $-44,895
- Equity at exit
- $17,863
- IRR
- -90.4%
- Equity multiple
- -1.22×
- Total profit
- $-74,422
- Equity at exit
- $10,358
Cash invested: $33,544 (down + closing). Projections, not guarantees.
Landlord ↔ Tenant lean methodology
- Overall (STATE)
- 87 Strongly Landlord-Friendly
- State Texas
- 87 Strongly Landlord-Friendly · R+5
- County
- — inherits STATE
- City
- — inherits STATE
ZIP-level market 75231
- Rents YoY
- 2.0%
- Active inventory
- 214
- Price-to-rent
- 8.2×
Monthly cashflow live
- Estimated rent
- $1,223 high interval (Pro) →
- Mortgage (P&I)
- −$628
- Tax from tax record
- −$258 /mo · $3,093/yr
- Insurance
- −$50
- HOA
- −$416
- Vacancy / Maint / Mgmt
- −$257
- Net cashflow
- $-386
Break-even live
Sensitivity live
| Price | -10% $-318 | -5% $-352 | +0% $-386 | +5% $-419 | +10% $-453 |
|---|---|---|---|---|---|
| Rent | -10% $-482 | -5% $-434 | +0% $-386 | +5% $-337 | +10% $-289 |
| Rate | -1.0pp $-325 | -0.5pp $-355 | base $-386 | +0.5pp $-417 | +1.0pp $-448 |
UW: 25.0% down · 7.5% · 30yr · 1.5% tax · 5.0% vac · 8.0% maint · 8.0% mgmt
Financing live
Cash to close
- Down payment
- $29,950
- Closing costs
- $3,594
- Reserves months
- —
- Total cash needed
- —
Loan-product check · same deal, 3 products live
Conventional
25% down · 7.5% · 30yr
- Down + closing
- —
- Monthly P&I
- —
- Monthly cashflow
- —
- DSCR
- —
- Eligible?
- —
Personal DTI + credit; lowest rate.
DSCR
20% down · 8.5% · 30yr
- Down + closing
- —
- Monthly P&I
- —
- Monthly cashflow
- —
- DSCR
- —
- Eligible?
- —
No personal income docs; deal must DSCR.
Hard money
10% down · 12.0% · 12mo
- Down + closing
- —
- Monthly P&I
- —
- Monthly cashflow
- —
- DSCR
- —
- Eligible?
- —
Short-term bridge; refi at stabilization.
Rent comps 40 comps
| Address | Beds | Baths | Sqft | Rent | $/sqft | DOM | Units | Dist |
|---|---|---|---|---|---|---|---|---|
| 7525 Holly Hill Dr #58 Dallas, TX | 2.0 | 2.0 | 1069 | $1,450 | $1.36 | 6d | 1 | 0.07mi |
| 7431 Holly Hill Dr #201 Dallas, TX | 1.0 | 1.0 | 617 | $850 | $1.38 | 7d | 1 | 0.21mi |
| 5759 Pineland Dr Dallas, TX | 1.0–2.0 | 1.0–2.0 | 747 | $911 | $1.22 | 0d | 28 | 0.25mi |
| 7474 Fair Oaks Ave Unit 7409 Dallas, TX | 1.0 | 1.0 | 867 | $1,199 | $1.38 | 25d | 1 | 0.28mi |
| 7474 Fair Oaks Ave #7413 Dallas, TX | 2.0 | 2.0 | 1100 | $1,625 | $1.48 | 44d | 1 | 0.28mi |
| 7418 Fair Oaks Ave Dallas, TX | — | 1.0 | 715 | $1,104 | $1.54 | 44d | 1 | 0.30mi |
| 5750 Phoenix Dr #19 Dallas, TX | 1.0 | 1.0 | 605 | $795 | $1.31 | 44d | 1 | 0.47mi |
| 5750 Phoenix Dr #51 Dallas, TX | 1.0 | 1.0 | 817 | $1,350 | $1.65 | 16d | 1 | 0.47mi |
| 7107 Holly Hill Dr Unit 104 1 Dallas, TX | 1.0 | 1.0 | 865 | $1,350 | $1.56 | 8d | 1 | 0.59mi |
| 8281 Walnut Hill Ln Dallas, TX | 1.0 | 1.0 | 662 | $1,561 | $2.36 | 23d | 1 | 0.61mi |
| 8281 Walnut Hill Ln Dallas, TX | 1.0 | 1.0 | 662 | $1,561 | $2.36 | 44d | 1 | 0.61mi |
| 8601 Park Ln Dallas, TX | 1.0 | 1.0 | 618 | $1,350 | $2.18 | 44d | 2 | 0.63mi |
| 8601 Park Ln #416 Dallas, TX | 1.0 | 1.0 | 618 | $1,400 | $2.27 | 25d | 1 | 0.65mi |
| 7030 Fair Oaks Ave Unit 108 Dallas, TX | 2.0 | 2.5 | 983 | $1,290 | $1.31 | 44d | 1 | 0.66mi |
| 7025 Hemlock Ave #305 Dallas, TX | 1.0 | 1.0 | 720 | $1,100 | $1.53 | 44d | 1 | 0.67mi |
| 7557 Rambler Rd Ste 111 Dallas, TX | 1.0 | 1.0 | 610 | $1,182 | $1.94 | 44d | 1 | 0.69mi |
| 8510 Park Ln #102 Dallas, TX | 1.0 | 1.0 | 700 | $1,195 | $1.71 | 11d | 1 | 0.72mi |
| 8510 Park Ln #203 Dallas, TX | 1.0 | 1.0 | 700 | $1,275 | $1.82 | 12d | 1 | 0.72mi |
| 8510 Park Ln #201 Dallas, TX | 1.0 | 1.0 | 625 | $1,055 | $1.69 | 8d | 1 | 0.72mi |
| 6003 Ridgecrest Rd Dallas, TX | 1.0 | 1.0 | 634 | $1,200 | $1.89 | 8d | 1 | 0.74mi |
| 6019 Ridgecrest Rd Unit 202B Dallas, TX | 2.0 | 2.5 | 1102 | $1,895 | $1.72 | 23d | 1 | 0.75mi |
| 8250 Meadow Rd Dallas, TX | 3.0 | 1.0–2.0 | 980 | $1,684 | $1.72 | 0d | 25 | 0.77mi |
| 6041 Ridgecrest Rd Dallas, TX | 1.0 | 1.0 | 587 | $1,165 | $1.98 | 18d | 4 | 0.77mi |
| 8560 Park Ln #136 Dallas, TX | 2.0 | 2.0 | 1100 | $1,300 | $1.18 | 25d | 1 | 0.78mi |
| 6014 Ridgecrest Rd Dallas, TX | 1.0 | 1.0 | 734 | $975 | $1.33 | 44d | 1 | 0.78mi |
| 9600 Golf Lakes Trl Dallas, TX | 1.0–2.0 | 1.0–2.0 | 865 | $1,049 | $1.21 | 3d | 12 | 0.80mi |
| 6760 Eastridge Dr Unit 102 Dallas, TX | 1.0 | 1.0 | 725 | $1,350 | $1.86 | 19d | 1 | 0.83mi |
| 6050 Ridgecrest Rd Dallas, TX | 2.0 | 1.0–2.0 | 732 | $1,045 | $1.43 | 3d | 14 | 0.85mi |
| 8780 Park Ln Dallas, TX | 2.0 | 1.0–2.0 | 642 | $1,277 | $1.99 | 4d | 56 | 0.86mi |
| 7777 Manderville Ln Dallas, TX | 2.0 | 1.0–2.0 | 863 | $2,034 | $2.36 | 0d | 58 | 0.87mi |
| 5951 Melody Ln Dallas, TX | 1.0 | 1.0 | 588 | $1,075 | $1.83 | 8d | 5 | 0.87mi |
| 9606 Golf Lakes Trl Dallas, TX | 1.0 | 1.0 | 712 | $1,330 | $1.87 | 23d | 1 | 0.90mi |
| 9606 Golf Lakes Trl Dallas, TX | 2.0 | 2.0 | 1012 | $1,700 | $1.68 | 25d | 1 | 0.90mi |
| 9606 Golf Lakes Trl Dallas, TX | 1.0 | 1.0 | 712 | $1,330 | $1.87 | 44d | 1 | 0.90mi |
| 6503 Ridgecrest Rd Apt J Dallas, TX | 1.0 | 1.5 | 943 | $1,250 | $1.33 | 44d | 1 | 0.93mi |
| 6121 Melody Ln Dallas, TX | 2.0 | 2.0 | 871 | $1,390 | $1.60 | 5d | 1 | 0.93mi |
| 6121 Melody Ln Dallas, TX | 1.0 | 1.0 | 653 | $960 | $1.47 | 25d | 1 | 0.93mi |
| 6251 Melody Ln Dallas, TX | 1.0–2.0 | 1.0–2.0 | 819 | $770 | $0.94 | 0d | 39 | 0.95mi |
| 8175 Meadow Rd Dallas, TX | 2.0 | 1.0–2.0 | 620 | $1,200 | $1.93 | 44d | 1 | 0.96mi |
| 6050 Melody Ln Dallas, TX | 1.0–2.0 | 1.0–2.0 | 992 | $867 | $0.87 | 0d | 8 | 0.96mi |
HOA detail condo
- Monthly dues
- $416 · $4,992/yr
- Likely covers
- electric
- Assessments
- None detected in remarks — confirm with the listing agent.
Listing history 16 events
-
2026-06-21days on market $119,800 Active 51 DOM
-
2026-06-18days on market $119,800 Active 48 DOM
-
2026-06-17days on market $119,800 Active 47 DOM
-
2026-06-16days on market $119,800 Active 46 DOM
-
2026-06-15days on market $119,800 Active 45 DOM
-
2026-06-13days on market $119,800 Active 43 DOM
-
2026-06-09days on market $119,800 Active 39 DOM
-
2026-06-08days on market $119,800 Active 38 DOM
-
2026-06-07days on market $119,800 Active 37 DOM
-
2026-06-04days on market $119,800 Active 34 DOM
-
2026-06-03days on market $119,800 Active 33 DOM
-
2026-06-02days on market $119,800 Active 32 DOM
-
2026-06-01days on market $119,800 Active 31 DOM
-
2026-05-31days on market $119,800 Active 30 DOM
-
2026-05-01$129,000 Active 236-char remark
-
2014-07-31soldstatus
ⓘ Source: listings_history table (triggers on properties + properties_extension) + one-shot
backfill from property_details.listing_events for pre-trigger history.
Tax reassessment forecast TX · Resets to sale price
- Current annual tax
- $3,093 · $258/mo
- Projected year-2 tax
- $3,093 · $258/mo
- Expected delta
- $0/yr ($0/mo · 0.0%)
ⓘ Screening estimate from a state-policy table — verify with the county assessor before closing.
Climate risk First Street
- Flood 1/10 Low FEMA zone X (unshaded) · 0% chance over 30 yrs
- Wildfire 3/10 Moderate
- Heat 7/10 Severe 7 d/yr ≥109°F today · 23 d/yr by 30 yrs out
- Wind 6/10 Major 27% chance of damaging wind over 30 yrs
- Air quality 3/10 Moderate 3 unhealthy d/yr today · 3 by 30 yrs out
Nearby sold comps map
Loading sold comps map…
Walkable amenities ~0.75 mi
Loading nearby amenities…
Taxation est. · year 1
- Rental income
- $14,678
- − Mortgage interest
- −$6,711
- − Property taxes
- −$3,093
- − Insurance
- −$599
- − Repairs & maintenance
- −$1,174
- − Management
- −$1,174
- − HOA
- −$4,992
- − Depreciation
- −$3,485
- Taxable loss
- −$6,550
- Est. tax savings @ 24.0%
- +$1,572
- After-tax cash flow
- $-3,055/yr
For passive investors: Depreciation is non-cash, so a rental often shows a tax loss while cash-flowing — sheltering income. Rental losses are passive: they offset passive income freely, and up to $25,000/yr can offset ordinary (W-2) income if you actively participate and your MAGI is under $100k (phasing out to $0 by $150k); unused losses carry forward. On sale, claimed depreciation is recaptured at up to 25%, and gains may owe capital-gains tax (a 1031 exchange can defer both). Figures are a year-1 estimate at your 24.0% rate — not tax advice; consult a CPA.
Schools (NCES district)
- District
- Dallas ISD
- NCES district ID
- 4816230
- Math proficiency
- 31% ▼ -16.00%
- Reading proficiency
- 36% ▼ -4.00%
- Median HH income
- $42,881
- Composite
- 28.41/100
- National rank
- #6763
- State rank
- #559 of 826 in TX
Livability — Dallas
- Score
- 81/100
- State rank
- #24
- US rank
- #1380
Category grades
Schools grade is shown separately in the Schools card above.
Census & demographics
- Census place
- Dallas, TX
- County
- Dallas County · 2,612,404 people
- City population
- 1,168,437
- Metro
- Dallas-Fort Worth-Arlington, TX
- Population (ZIP)
- 38,370
- Household income
- $58,540
- Rent vs Own
- Severe rent burden
- 3482.0
Population outlook (Dallas County) Hauer SSP2
- Today (2025)
- 2,979,839 people
- By 2030
- 3,191,823 · +7.1%
- By 2040
- 3,619,611 · +21.5%
- By 2050
- 4,026,915 · +35.1%
- By 2075
- 4,957,073 · +66.4%
- By 2100
- 5,508,725 · +84.9%
Race, ethnicity, and origin ACS 2023
- Neighborhood character
- Highly diverse neighborhood (Simpson 0.74)
- Race & ethnicity
- Hispanic / Latino 33% White 29% Black 24% Two or more races 13% Asian 9%
- Hispanic origin (detail)
- Mexican 26%
- Common ancestry
- Slovak 1% Lithuanian 1% Romanian 1%
- Foreign-born
- 29% · Canada, Philippines, India
- Languages at home
- 57% English-only · Spanish 27% Other Asian/Pacific 4% Other Indo-European 3%
Political lean MEDSL · Dallas
- 2024 margin
- Strong D (+22.2) · D 60.2% · R 38.0% · Other 1.8%
- 2008→2024 swing
- +6.9pp toward D · 2008: 15.3pp · 2024: 22.2pp
- All cycles
- 2024: D+22.2 2020: D+31.6 2016: D+26.2 2012: D+15.4 2008: D+15.3
Not yet ingested
- Civics
- —
Market trends
- HPI YoY
- ▼ -359.41%
- Current HPI
- 249.5841
- Rent YoY
- ▲ 1.96%
- Metro
- Dallas-Fort Worth-Arlington, TX
- State GDP YoY
- ▲ 3.95%
- F500 in state
- 110
Industry mix (Fortune 500 HQ in TX)
| Industry | F500 HQs | Revenue |
|---|---|---|
| Energy | 16 | $1,198B |
|
||
| Technology | 5 | $198B |
|
||
| Engineering / Construction | 4 | $72B |
|
||
| Energy Services | 3 | $60B |
|
||
| Utilities | 3 | $41B |
|
||
| Healthcare | 2 | $330B |
|
||
Price history
-7.1% since first listed3 events — show timeline
- 2026-05-22 Price Changed $119,800 NTREIS
- 2026-05-01 Listed $129,000 NTREIS
- 2014-07-31 Sold (Public Records) — Public Records
Property tax history
+9.1%/yrLatest (2025): $3,093 · -0.4% YoY. Source: county tax records.
Cash-flow waterfall
monthlySold comps — $/sqft
last 12 mo · ≤1 miLoading sold comps…