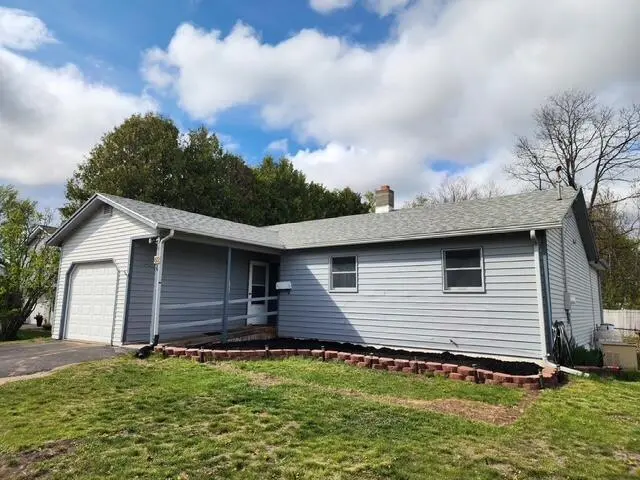
62 Cedar Ct · Keeseville, NY
Flood risk 1/10 · Minimal
- FEMA flood zone
- X (unshaded)
- Chance of flooding over 30 yrs
- 0.0%
- Est. flood insurance / yr
- $473 – $860
Fire risk 1/10 · Minimal
- Est. fire insurance / yr
- $691 – $1,283
Heat risk 2/10 · Minimal
- Hot days now (above 94°F)
- 7 days/yr
- Hot days in 30 yrs
- 15 days/yr
Wind risk 1/10 · Minimal
- Chance of severe wind over 30 yrs
- 1.0%
Air-quality risk 2/10 · Minimal
- Unhealthy air days now
- 1 days/yr
- Unhealthy air days in 30 yrs
- 1 days/yr
Risk factors via First Street. Map © Google.
Why this score? — see what drove the D- grade
The composite is a weighted blend of 9 inputs, each scored 0–100. Each bar is that input's sub-score; the figure is the points it added to the 100-point composite (weight × sub-score).
- Cash flow +12.4/30.0
- 1% rule +4.2/10.0
- DSCR +3.7/10.0
- Schools +3.7/10.0
- Livability +3.2/5.0
- Appreciation +3.1/10.0
- Rent growth +2.5/5.0
- Condition / age +2.5/5.0
- ARV discount +0.0/15.0
$215,000
🖨 Deal sheet (PDF) 📄 Offer letter ✓ Due diligence
Listing remarks MLS
immaculate 3bd, 2ba ranch completely painted last week. Open living/dining area with new wood door to lg screened porch overlooking the above ground pool in the rear yard. Kitchen offers abundant cabinetry and ergonomic layout. Large open space adjacent to the living room offers endless options for future redesign if desired. Full unfinished basement - completely dry for safe storage. Whole house generator set up and self-tests weekly. New boiler system in 2017w/ 2 oil tanks to allow for fuel purchase at summer rates. Roof is only 5-6 years old. Triangular back lawn completely fenced for safe use. Completely ready for a new owner to move right in.
Key facts
- New boiler system
- Above ground pool
- Full basement
Tags
Property features AI
Finance
- Other: Property zoned residential; Lot dimensions approximately 100 x 207 (0.28 acres)
Exterior
- Parking: Attached garage (1 car); Deck access to parking
- Security: Carbon monoxide detector(s); Smoke detector(s)
- Utilities: Public water; Sewer connected; 200+ amp electric service; Cable available and connected; Electricity connected; Water connected
- Home design: Single-family residence; One level; Updated/remodeled; Has a view; Vinyl siding
- Construction: Asphalt roof; Block foundation; Built with vinyl siding
- Exterior features: Deck; Porch (screened); Outbuilding; Above-ground pool; Fenced back yard; Paved road access; Wooded, level lot with many trees
Interior
- Kitchen: Dishwasher; Electric range; Microwave; Refrigerator
- Bedrooms: Total of 9 rooms (bedroom count not specified)
- Flooring: Carpet; Tile; Vinyl; Wood
- Bathrooms: 2 full bathrooms
- Heating & cooling: Hot water heating (oil); Ceiling fan cooling; No central air
- Interior features: Ceiling fans; High-speed internet; Double pane and insulated windows; Full, partially finished basement; Storage
- Laundry & utility: Laundry room with washer and electric dryer hookups; Fuel tank(s); Generator
Neighborhood map
What this means for you Summary
Snapshot
- This is a 3-bed/2.0-bath single-family listed at $215k.
Deal economics
- At list price, monthly cash flow is $-35 ($-422/yr) — negative.
- To cash-flow at today's rent, offer at most $209k (2.9% below list).
- To meet the 1% rule (rent ≥ 1% of price), the offer needs to be $197k (8.3% below list).
- Recommended offer: $197k (8.3% below list) — sets the bar for 1% rule.
Location & tenants
- Location reads 65/100 on livability (#673 in NY) — a middle-class / working-renter tenant base. Strengths: cost of living A+, housing A+, crime A-; Watch: employment D, amenities F, commute F.
- Ausable Valley Central School District (rural): math 36% / reading 51% proficiency, ranked #474 of 590 in NY (top 80%) — families likely to look elsewhere, expect single-tenant / working-renter base with shorter leases.
- Zoned schools: Keeseville Primary School (math 17% / reading 57%, grade F, #1,519 of 2,108 statewide, top 74%, 413 students, 0% FRL); Ausable Valley Middle School (math 22% / reading 47%, grade F, #483 of 729 statewide, top 68%, 193 students, 54% FRL); Ausable Valley High School (math 92% / reading 75%, grade A, #409 of 1,100 statewide, top 39%, 351 students, 50% FRL) — zoned schools at 35% FRL track the district average.
- Market conditions: 40 active listings in the ZIP; 192 units permitted in Clinton County in 2024 (64 in 5+ unit buildings).
Forward outlook
- Local home prices are declining (-3.0%/yr); year-one equity from $1k of loan paydown is wiped out by about $6k of value loss. Plan a longer hold.
- Clinton County population projected at -16% by 2050 — secular population decline; favor cash flow + early exit over multi-decade hold.
Negotiation context
- It's been on market 22 days — a 2% lower offer ($212k) is reasonable based on typical stale-listing flexibility.
- 2 sale attempts since 6y ago with the ask held roughly flat each time — persistent listings suggest the price (not the market) is what's stuck; bring a comps-based counter.
- Current owner paid $156k; 37% above their basis — modest negotiation headroom, anchor on the comps not their cost.
Questions for the listing agent
- What do current leases actually rent for vs. the listed asking? Can we see a recent rent roll and the last 12 months of T-12 income?
- Is there a deadline driving the sale (1031 exchange, divorce, estate, relocation)? That informs how much negotiation room exists.
- Schools are D-rated, which usually means shorter tenancies and higher turnover. Who's the typical renter profile here, and what's been the actual vacancy rate?
- The area grade is low — what's the realistic commute time and amenity access for the typical tenant pool here? Any planned neighborhood developments (good or bad) we should know about?
- What's the average days-on-market for RENTAL listings here right now (not sales)? A rising rental-DOM trend means longer vacancies and softer asking-rent achievability than the comps imply.
- What's the recent tenant-quality profile in this submarket — average credit score on applications, eviction rate, late-payment / NSF rate, and stable-employment percentage? A property-management company in the area should have these aggregated.
- How much new for-sale + rental construction is in the pipeline within 1–3 miles? Heavy new supply typically softens prices + rents 12–24 months out; constrained supply supports both.
Investment metrics
- 1% rule
- 0.92% ✗
- Cap rate
- 6.10%
- Cash-on-cash
- -0.70%
- DSCR
- 0.97
- GRM
- 9.1
CMA / ARV
- ARV (on-the-fly)
- $174,192
- Comps found
- 10
Show comp detail 10 sales within ~0.75 mi
| Address | Dist | Beds/Ba | Sqft | Sold | Price | $/sf | Match |
|---|---|---|---|---|---|---|---|
| 1817 Main St | 0.16mi | 3/1.0 | 1,120 (-2%) | 15mo | $106,000 | $95 | 73 |
| 13 River St | 0.37mi | 3/1.0 | 1,196 (+4%) | 0mo | $20,500 | $17 | 71 |
| 1867 Main St | 0.36mi | 3/1.0 | 1,232 (+8%) | 3mo | $132,900 | $108 | 65 |
| 1872 Main St | 0.38mi | 2/1.0 (-1) | 1,195 (+4%) | 22mo | $212,000 | $177 | 48 |
| 18 Grove Street St | 0.30mi | 3/2.0 | 979 (-15%) | 17mo | $169,995 | $174 | 48 |
| 9 Smart St | 0.51mi | 3/1.0 | 1,280 (+12%) | 11mo | $195,000 | $152 | 44 |
| 68 Pleasant St | 0.23mi | 2/1.0 (-1) | 984 (-14%) | 17mo | $147,000 | $149 | 43 |
| 43 Kent St | 0.66mi | 3/1.0 | 1,028 (-10%) | 7mo | $180,000 | $175 | 42 |
| 1831 Route 9 | 0.71mi | 2/1.0 (-1) | 1,023 (-11%) | 1mo | $126,500 | $124 | 39 |
| 70 Pine Tree Dr | 0.67mi | 2/1.0 (-1) | 1,233 (+8%) | 14mo | $192,500 | $156 | 35 |
Match score weights: distance 35% · size 25% · config 20% · recency 20%. Top-matched comps best support the ARV.
Projected returns pro-forma
-3.0% appreciation · 3.0% rent growth · sell at horizon
- IRR
- -17.4%
- Equity multiple
- 0.39×
- Total profit
- $-36,982
- Equity at exit
- $32,057
- IRR
- -9.3%
- Equity multiple
- 0.42×
- Total profit
- $-34,700
- Equity at exit
- $18,589
Cash invested: $60,200 (down + closing). Projections, not guarantees.
Landlord ↔ Tenant lean methodology
- Overall (STATE)
- 15 Strongly Tenant-Friendly
- State New York
- 15 Strongly Tenant-Friendly · D+10
- County
- — inherits STATE
- City
- — inherits STATE
ZIP-level market 12944
- Home prices YoY
- -1.7%
- Active inventory
- 40
- Price-to-rent
- 9.1×
Monthly cashflow live
- Estimated rent
- $1,970 medium interval (Pro) →
- Mortgage (P&I)
- −$1,127
- Tax from tax record
- −$375 /mo · $4,497/yr
- Insurance
- −$90
- HOA
- −$0
- Vacancy / Maint / Mgmt
- −$414
- Net cashflow
- $-35
Break-even live
Sensitivity live
| Price | -10% $87 | -5% $26 | +0% $-35 | +5% $-96 | +10% $-157 |
|---|---|---|---|---|---|
| Rent | -10% $-191 | -5% $-113 | +0% $-35 | +5% $43 | +10% $121 |
| Rate | -1.0pp $73 | -0.5pp $20 | base $-35 | +0.5pp $-91 | +1.0pp $-148 |
UW: 25.0% down · 7.5% · 30yr · 1.5% tax · 5.0% vac · 8.0% maint · 8.0% mgmt
Financing live
Cash to close
- Down payment
- $53,750
- Closing costs
- $6,450
- Reserves months
- —
- Total cash needed
- —
Loan-product check · same deal, 3 products live
Conventional
25% down · 7.5% · 30yr
- Down + closing
- —
- Monthly P&I
- —
- Monthly cashflow
- —
- DSCR
- —
- Eligible?
- —
Personal DTI + credit; lowest rate.
DSCR
20% down · 8.5% · 30yr
- Down + closing
- —
- Monthly P&I
- —
- Monthly cashflow
- —
- DSCR
- —
- Eligible?
- —
No personal income docs; deal must DSCR.
Hard money
10% down · 12.0% · 12mo
- Down + closing
- —
- Monthly P&I
- —
- Monthly cashflow
- —
- DSCR
- —
- Eligible?
- —
Short-term bridge; refi at stabilization.
Listing history 8 events
-
2026-06-02status $215,000 Pending 22 DOM
-
2026-06-01days on market $215,000 Active 22 DOM
-
2026-05-31days on market $215,000 Active 21 DOM
-
2026-05-30days on market $215,000 Active 20 DOM
-
2026-05-09$225,000 Active
-
2020-11-09soldstatus $156,500 655-char remark
Show marketing remark (655 chars)
immaculate 3bd, 2ba ranch completely painted last week. Open living/dining area with new wood door to lg screened porch overlooking the above ground pool in the rear yard. Kitchen offers abundant cabinetry and ergonomic layout. Large open space adjacent to the living room offers endless options for future redesign if desired. Full unfinished basement - completely dry for safe storage. Whole house generator set up and self-tests weekly. New boiler system in 2017w/ 2 oil tanks to allow for fuel purchase at summer rates. Roof is only 5-6 years old. Triangular back lawn completely fenced for safe use. Completely ready for a new owner to move right in.
-
2020-08-06$149,900 655-char remark
Show marketing remark (655 chars)
immaculate 3bd, 2ba ranch completely painted last week. Open living/dining area with new wood door to lg screened porch overlooking the above ground pool in the rear yard. Kitchen offers abundant cabinetry and ergonomic layout. Large open space adjacent to the living room offers endless options for future redesign if desired. Full unfinished basement - completely dry for safe storage. Whole house generator set up and self-tests weekly. New boiler system in 2017w/ 2 oil tanks to allow for fuel purchase at summer rates. Roof is only 5-6 years old. Triangular back lawn completely fenced for safe use. Completely ready for a new owner to move right in.
-
2004-03-24soldstatus $76,000
ⓘ Source: listings_history table (triggers on properties + properties_extension) + one-shot
backfill from property_details.listing_events for pre-trigger history.
Tax reassessment forecast NY · Partial reset (capped growth)
- Current annual tax
- $4,497 · $375/mo
- Projected year-2 tax
- $4,497 · $375/mo
- Expected delta
- $0/yr ($0/mo · 0.0%)
ⓘ Screening estimate from a state-policy table — verify with the county assessor before closing.
Climate risk First Street
- Flood 1/10 Low FEMA zone X (unshaded) · 0% chance over 30 yrs
- Wildfire 1/10 Low
- Heat 2/10 Low 7 d/yr ≥94°F today · 15 d/yr by 30 yrs out
- Wind 1/10 Low 100% chance of damaging wind over 30 yrs
- Air quality 2/10 Low 1 unhealthy d/yr today · 1 by 30 yrs out
Nearby sold comps map
Loading sold comps map…
Walkable amenities ~0.75 mi
Loading nearby amenities…
Taxation est. · year 1
- Rental income
- $23,646
- − Mortgage interest
- −$12,043
- − Property taxes
- −$4,497
- − Insurance
- −$1,075
- − Repairs & maintenance
- −$1,892
- − Management
- −$1,892
- − Depreciation
- −$6,255
- Taxable loss
- −$4,007
- Est. tax savings @ 24.0%
- +$962
- After-tax cash flow
- $540/yr
For passive investors: Depreciation is non-cash, so a rental often shows a tax loss while cash-flowing — sheltering income. Rental losses are passive: they offset passive income freely, and up to $25,000/yr can offset ordinary (W-2) income if you actively participate and your MAGI is under $100k (phasing out to $0 by $150k); unused losses carry forward. On sale, claimed depreciation is recaptured at up to 25%, and gains may owe capital-gains tax (a 1031 exchange can defer both). Figures are a year-1 estimate at your 24.0% rate — not tax advice; consult a CPA.
Schools (NCES district)
- District
- Ausable Valley Central School District
- NCES district ID
- 3616170
- Math proficiency
- 36% ▼ -14.00%
- Reading proficiency
- 51% ▲ 5.00%
- Median HH income
- $50,989
- Composite
- 37.43/100
- National rank
- #4417
- State rank
- #474 of 590 in NY
Livability — Keeseville
- Score
- 65/100
- State rank
- #673
- US rank
- #12604
Category grades
Schools grade is shown separately in the Schools card above.
Census & demographics
- Census place
- Keeseville, NY
- Population (ZIP)
- 4,043
Population outlook (Clinton County) Hauer SSP2
- Today (2025)
- 78,791 people
- By 2030
- 76,848 · -2.5%
- By 2040
- 71,579 · -9.2%
- By 2050
- 66,471 · -15.6%
- By 2075
- 57,361 · -27.2%
- By 2100
- 47,232 · -40.1%
Race, ethnicity, and origin ACS 2023
- Neighborhood character
- Predominantly White (96%)
- Race & ethnicity
- White 96% Hispanic / Latino 2% Two or more races 2%
- Common ancestry
- Lithuanian 20% Romanian 1% Slovak 1%
- Foreign-born
- 2% · Canada
- Languages at home
- 97% English-only · Spanish 1% Other Indo-European 1%
Political lean MEDSL · Clinton
- 2024 margin
- Toss-up / Even · D 48.9% · R 51.1%
- 2008→2024 swing
- -25.1pp toward R · 2008: 22.9pp · 2024: -2.2pp
- All cycles
- 2024: R+2.2 2020: D+5.2 2016: D+0.9 2012: D+25.6 2008: D+22.9
Not yet ingested
- Civics
- —
Market trends
- HPI YoY
- ▼ -3.79%
- Current HPI
- 220.0385
- Rent YoY
- —
- Metro
- —
- State GDP YoY
- ▲ 2.60%
- F500 in state
- 92
Industry mix (Fortune 500 HQ in NY)
| Industry | F500 HQs | Revenue |
|---|---|---|
| Financial Services | 10 | $950B |
|
||
| Consumer Goods | 9 | $162B |
|
||
| Insurance | 4 | $225B |
|
||
| Telecommunications | 2 | $144B |
|
||
| Pharmaceuticals | 2 | $112B |
|
||
| Media / Entertainment | 2 | $69B |
|
||
Price history
+196.1% since first listed4 events — show timeline
- 2026-05-09 Listed $225,000 ACVMLS
- 2020-11-09 Sold (MLS) $156,500 ACVMLS
- 2020-08-06 Listed $149,900 ACVMLS
- 2004-03-24 Sold (Public Records) $76,000 Public Records
Property tax history
+6.8%/yrLatest (2025): $4,497 · +12.6% YoY. Source: county tax records.
Cash-flow waterfall
monthlySold comps — $/sqft
last 12 mo · ≤1 miLoading sold comps…