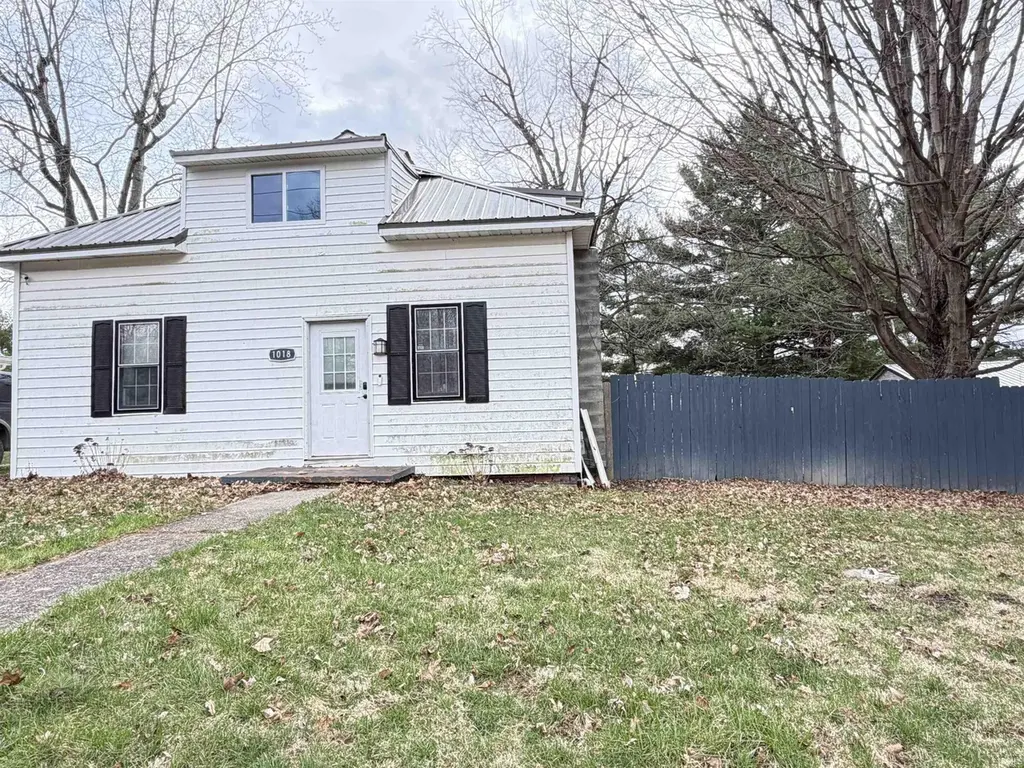
1018 E 8th St · Veedersburg, IN
Flood risk 1/10 · Minimal
- FEMA flood zone
- X (unshaded)
- Chance of flooding over 30 yrs
- 0.0%
- Est. flood insurance / yr
- $473 – $860
Fire risk 1/10 · Minimal
- Est. fire insurance / yr
- $717 – $1,331
Heat risk 3/10 · Minor
- Hot days now (above 102°F)
- 7 days/yr
- Hot days in 30 yrs
- 18 days/yr
Wind risk 2/10 · Minimal
- Chance of severe wind over 30 yrs
- 1.0%
Air-quality risk 3/10 · Minor
- Unhealthy air days now
- 2 days/yr
- Unhealthy air days in 30 yrs
- 3 days/yr
Risk factors via First Street. Map © Google.
Why this score? — see what drove the C+ grade
The composite is a weighted blend of 9 inputs, each scored 0–100. Each bar is that input's sub-score; the figure is the points it added to the 100-point composite (weight × sub-score).
- Cash flow +17.8/30.0
- ARV discount +13.0/15.0
- Appreciation +10.0/10.0
- DSCR +5.6/10.0
- 1% rule +4.0/10.0
- Schools +3.3/10.0
- Livability +3.2/5.0
- Rent growth +2.5/5.0
- Condition / age +2.5/5.0
$125,000
🖨 Deal sheet 📄 Offer letter ✓ Due diligence
Listing remarks MLS
Welcome home! This two-story property is full of opportunity, whether you’re looking for something move-in ready or a space to make your own. Enjoy the convenience of a 3-car detached garage and a fully fenced-in yard—perfect for entertaining, pets, or play. With a newer roof already in place, some of the big-ticket items are taken care of. Being sold as-is, this home is ideal for buyers ready to step in and add their personal style.
Key facts
- Newer roof
- Fully fenced yard
- Detached garage
Tags
Neighborhood map
What this means for you Summary
Snapshot
- This is a 3-bed/1.0-bath single-family listed at $125k.
Deal economics
- At list price, monthly cash flow is $102 ($1k/yr) — positive.
- The deal already cash-flows at list — no discount required.
- To meet the 1% rule (rent ≥ 1% of price), the offer needs to be $113k (9.7% below list).
- Recommended offer: $113k (9.7% below list) — sets the bar for 1% rule.
Location & tenants
- Location reads 64/100 on livability (#395 in IN) — a middle-class / working-renter tenant base. Strengths: crime A+, cost of living A+, housing A+; Watch: schools D-, amenities F, commute F.
- Southeast Fountain School Corporation (rural): math 34% / reading 43% proficiency, ranked #163 of 301 in IN (top 54%) — families likely to look elsewhere, expect single-tenant / working-renter base with shorter leases.
- Market conditions: 21 active listings in the ZIP; 2 comparable units currently listed for rent nearby; 19 units permitted in Fountain County in 2024 (0 in 5+ unit buildings).
Forward outlook
- In year one you build about $13k of equity ($864 loan paydown + $12k appreciation (10.0% local appreciation)).
- Fountain County population projected at -22% by 2050 — secular population decline; favor cash flow + early exit over multi-decade hold.
- At projected returns (10.0% appreciation + 3.0% rent growth), your $35k cash investment doubles in ~3 years — after that, you're playing with house money.
- By year 3, paydown + projected appreciation supports a ~$34k cash-out refi (75% LTV) — recoverable capital for the next deal without selling this one.
Negotiation context
- It's been on market 93 days — a 9% lower offer ($114k) is reasonable based on typical stale-listing flexibility.
- 6 sale attempts since 3y ago with the ask held roughly flat each time — persistent listings suggest the price (not the market) is what's stuck; bring a comps-based counter.
- Current owner paid $17k; list at $125k implies a 616% gain — meaningful room to come down on a strong offer.
Risks & watch-outs
- Watch-outs: built in 1915 — expect roof / HVAC / electrical / plumbing capex.
Questions for the listing agent
- It's been on market 93 days. Have you received any prior offers? Is the seller open to a 10% concession, seller financing, or rate buy-down credit?
- Built in 1915 — when were the roof, HVAC, electrical panel, plumbing, and water heater last replaced?
- Why hasn't it sold? Are there any deal-killer items the seller is aware of (foundation, flood, title, zoning, code violations)?
- Is there a deadline driving the sale (1031 exchange, divorce, estate, relocation)? That informs how much negotiation room exists.
- Schools are D-rated, which usually means shorter tenancies and higher turnover. Who's the typical renter profile here, and what's been the actual vacancy rate?
- What's the average days-on-market for RENTAL listings here right now (not sales)? A rising rental-DOM trend means longer vacancies and softer asking-rent achievability than the comps imply.
- What's the recent tenant-quality profile in this submarket — average credit score on applications, eviction rate, late-payment / NSF rate, and stable-employment percentage? A property-management company in the area should have these aggregated.
- How much new for-sale + rental construction is in the pipeline within 1–3 miles? Heavy new supply typically softens prices + rents 12–24 months out; constrained supply supports both.
Investment metrics
- 1% rule
- 0.90% ✗
- Cap rate
- 7.27%
- Cash-on-cash
- 3.49%
- DSCR
- 1.16
- GRM
- 9.2
CMA / ARV
- ARV (median comp)
- $142,500
- List price
- $125,000
- Delta
- -12.28%
- Verdict
- UNDERPRICED
- Comps
- 11 within 1.0 mi
Projected returns pro-forma
10.0% appreciation · 3.0% rent growth · sell at horizon
- IRR
- 26.8%
- Equity multiple
- 3.13×
- Total profit
- $74,535
- Equity at exit
- $112,610
- IRR
- 23.4%
- Equity multiple
- 7.12×
- Total profit
- $214,336
- Equity at exit
- $242,848
Cash invested: $35,000 (down + closing). Projections, not guarantees.
Landlord ↔ Tenant lean methodology
- Overall (STATE)
- 90 Strongly Landlord-Friendly
- State Indiana
- 90 Strongly Landlord-Friendly · R+11
- County
- — inherits STATE
- City
- — inherits STATE
ZIP-level market 47987
- Home prices YoY
- 4.8%
- Active inventory
- 21
- Price-to-rent
- 9.2×
Monthly cashflow live
- Estimated rent
- $1,128 medium interval (Pro) →
- Mortgage (P&I)
- −$656
- Tax from tax record
- −$82 /mo · $984/yr
- Insurance
- −$52
- HOA
- −$0
- Vacancy / Maint / Mgmt
- −$237
- Net cashflow
- $102
Break-even live
UW: 25.0% down · 7.5% · 30yr · 1.5% tax · 5.0% vac · 8.0% maint · 8.0% mgmt
Financing live
Cash to close
- Down payment
- $31,250
- Closing costs
- $3,750
- Reserves months
- —
- Total cash needed
- —
Loan-product check · same deal, 3 products live
Conventional
25% down · 7.5% · 30yr
- Down + closing
- —
- Monthly P&I
- —
- Monthly cashflow
- —
- DSCR
- —
- Eligible?
- —
Personal DTI + credit; lowest rate.
DSCR
20% down · 8.5% · 30yr
- Down + closing
- —
- Monthly P&I
- —
- Monthly cashflow
- —
- DSCR
- —
- Eligible?
- —
No personal income docs; deal must DSCR.
Hard money
10% down · 12.0% · 12mo
- Down + closing
- —
- Monthly P&I
- —
- Monthly cashflow
- —
- DSCR
- —
- Eligible?
- —
Short-term bridge; refi at stabilization.
Rent comps 2 comps
| Address | Beds | Baths | Sqft | Rent | $/sqft | DOM | Units | Dist |
|---|---|---|---|---|---|---|---|---|
| 110 N Main St Unit 110 Veedersburg, IN | 3.0 | 1.0 | 1386 | $1,350 | $0.97 | 21d | 1 | 0.89mi |
| 414 W Harrison St Apt 10 Veedersburg, IN | 2.0 | 1.0 | 700 | $799 | $1.14 | 21d | 1 | 1.19mi |
Listing history 31 events
-
2026-06-19days on market $125,000 Active 93 DOM
-
2026-06-18days on market $125,000 Active 92 DOM
-
2026-06-17days on market $125,000 Active 91 DOM
-
2026-06-16days on market $125,000 Active 90 DOM
-
2026-06-15days on market $125,000 Active 89 DOM
-
2026-06-14days on market $125,000 Active 87 DOM
-
2026-06-12days on market $125,000 Active 86 DOM
-
2026-06-09days on market $125,000 Active 83 DOM
-
2026-06-08days on market $125,000 Active 82 DOM
-
2026-06-07days on market $125,000 Active 81 DOM
-
2026-06-03days on market $125,000 Active 77 DOM
-
2026-06-02days on market $125,000 Active 76 DOM
-
2026-06-01days on market $125,000 Active 75 DOM
-
2026-05-31days on market $125,000 Active 74 DOM
-
2026-05-30days on market $125,000 Active 73 DOM
-
2026-03-17$125,000 Active 449-char remark
Show marketing remark (449 chars)
Welcome home! This two-story property is full of opportunity, whether you’re looking for something move-in ready or a space to make your own. Enjoy the convenience of a 3-car detached garage and a fully fenced-in yard—perfect for entertaining, pets, or play. With a newer roof already in place, some of the big-ticket items are taken care of. Being sold as-is, this home is ideal for buyers ready to step in and add their personal style.
-
2026-03-04historical
-
2026-01-14price $125,000
-
2026-01-01status Active
-
2025-12-31historical
-
2025-07-21status Active
-
2025-07-21price $130,000
-
2025-06-06historical
-
2025-05-08price $140,000
-
2025-01-09$150,000 Active
-
2023-06-03historical
-
2023-05-15status Active
-
2023-04-27status Pending
-
2023-03-28price $170,000
-
2023-02-18$180,000 Active
-
2012-02-20soldstatus $17,461
ⓘ Source: listings_history table (triggers on properties + properties_extension) + one-shot
backfill from property_details.listing_events for pre-trigger history.
Tax reassessment forecast IN · Partial reset (capped growth)
- Current annual tax
- $984 · $82/mo
- Projected year-2 tax
- $1,023 · $85/mo
- Expected delta
- +$39/yr (+$3/mo · 4.0%)
ⓘ Screening estimate from a state-policy table — verify with the county assessor before closing.
Climate risk First Street
- Flood 1/10 Low FEMA zone X (unshaded) · 0% chance over 30 yrs
- Wildfire 1/10 Low
- Heat 3/10 Moderate 7 d/yr ≥102°F today · 18 d/yr by 30 yrs out
- Wind 2/10 Low 100% chance of damaging wind over 30 yrs
- Air quality 3/10 Moderate 2 unhealthy d/yr today · 3 by 30 yrs out
Nearby sold comps map
Loading sold comps map…
Walkable amenities ~0.75 mi
Loading nearby amenities…
Taxation est. · year 1
- Rental income
- $13,540
- − Mortgage interest
- −$7,002
- − Property taxes
- −$984
- − Insurance
- −$625
- − Repairs & maintenance
- −$1,083
- − Management
- −$1,083
- − Depreciation
- −$3,636
- Taxable loss
- −$873
- Est. tax savings @ 24.0%
- +$210
- After-tax cash flow
- $1,431/yr
For passive investors: Depreciation is non-cash, so a rental often shows a tax loss while cash-flowing — sheltering income. Rental losses are passive: they offset passive income freely, and up to $25,000/yr can offset ordinary (W-2) income if you actively participate and your MAGI is under $100k (phasing out to $0 by $150k); unused losses carry forward. On sale, claimed depreciation is recaptured at up to 25%, and gains may owe capital-gains tax (a 1031 exchange can defer both). Figures are a year-1 estimate at your 24.0% rate — not tax advice; consult a CPA.
Schools (NCES district)
- District
- Southeast Fountain School Corporation
- NCES district ID
- 1810620
- Math proficiency
- 34% ▼ -8.00%
- Reading proficiency
- 43% ▼ -5.00%
- Median HH income
- $44,911
- Composite
- 32.73/100
- National rank
- #5640
- State rank
- #163 of 301 in IN
Livability — Veedersburg
- Score
- 64/100
- State rank
- #395
- US rank
- #14573
Category grades
Schools grade is shown separately in the Schools card above.
Census & demographics
- Census place
- Veedersburg, IN
- Population (ZIP)
- 3,705
Population outlook (Fountain County) Hauer SSP2
- Today (2025)
- 15,481 people
- By 2030
- 14,841 · -4.1%
- By 2040
- 13,505 · -12.8%
- By 2050
- 12,149 · -21.5%
- By 2075
- 9,214 · -40.5%
- By 2100
- 6,463 · -58.3%
Race, ethnicity, and origin ACS 2023
- Neighborhood character
- Predominantly White (95%)
- Race & ethnicity
- White 95% Hispanic / Latino 3% Two or more races 3%
- Common ancestry
- Romanian 2% Lithuanian 2% Slovak 1%
- Foreign-born
- 1% · Canada
- Languages at home
- 99% English-only · Spanish 1%
Political lean MEDSL · Fountain
- 2024 margin
- Solid R (+60.0) · D 19.1% · R 79.1% · Other 1.8%
- 2008→2024 swing
- -45.6pp toward R · 2008: -14.4pp · 2024: -60.0pp
- All cycles
- 2024: R+60.0 2020: R+56.7 2016: R+56.0 2012: R+34.2 2008: R+14.4
Not yet ingested
- Civics
- —
Market trends
- HPI YoY
- ▲ 10.85%
- Current HPI
- 235.6913
- Rent YoY
- —
- Metro
- —
- State GDP YoY
- ▲ 2.90%
- F500 in state
- 18
Industry mix (Fortune 500 HQ in IN)
| Industry | F500 HQs | Revenue |
|---|---|---|
| Industrial Machinery | 2 | $37B |
|
||
| Healthcare | 1 | $177B |
|
||
| Pharmaceuticals | 1 | $45B |
|
||
| Metals / Steel | 1 | $18B |
|
||
| Agriculture | 1 | $17B |
|
||
| Packaging | 1 | $12B |
|
||
Price history
+615.9% since first listed16 events — show timeline
- 2026-03-17 Listed $125,000 IRMLS
- 2026-03-04 Listing Removed — MIBOR as Distributed by MLS Grid
- 2026-01-14 Price Changed $125,000 MIBOR as Distributed by MLS Grid
- 2026-01-01 Relisted — MIBOR as Distributed by MLS Grid
- 2025-12-31 Listing Removed — MIBOR as Distributed by MLS Grid
- 2025-07-21 Relisted — MIBOR as Distributed by MLS Grid
- 2025-07-21 Price Changed $130,000 MIBOR as Distributed by MLS Grid
- 2025-06-06 Listing Removed — MIBOR as Distributed by MLS Grid
- 2025-05-08 Price Changed $140,000 MIBOR as Distributed by MLS Grid
- 2025-01-09 Listed $150,000 MIBOR as Distributed by MLS Grid
- 2023-06-03 Listing Removed — MIBOR as Distributed by MLS Grid
- 2023-05-15 Relisted — MIBOR as Distributed by MLS Grid
- 2023-04-27 Pending — MIBOR as Distributed by MLS Grid
- 2023-03-28 Price Changed $170,000 MIBOR as Distributed by MLS Grid
- 2023-02-18 Listed $180,000 MIBOR as Distributed by MLS Grid
- 2012-02-20 Sold (Public Records) $17,461 Public Records
Property tax history
+1.2%/yrLatest (2024): $984 · -3.4% YoY. Source: county tax records.
Cash-flow waterfall
monthlySold comps — $/sqft
last 12 mo · ≤1 miLoading sold comps…