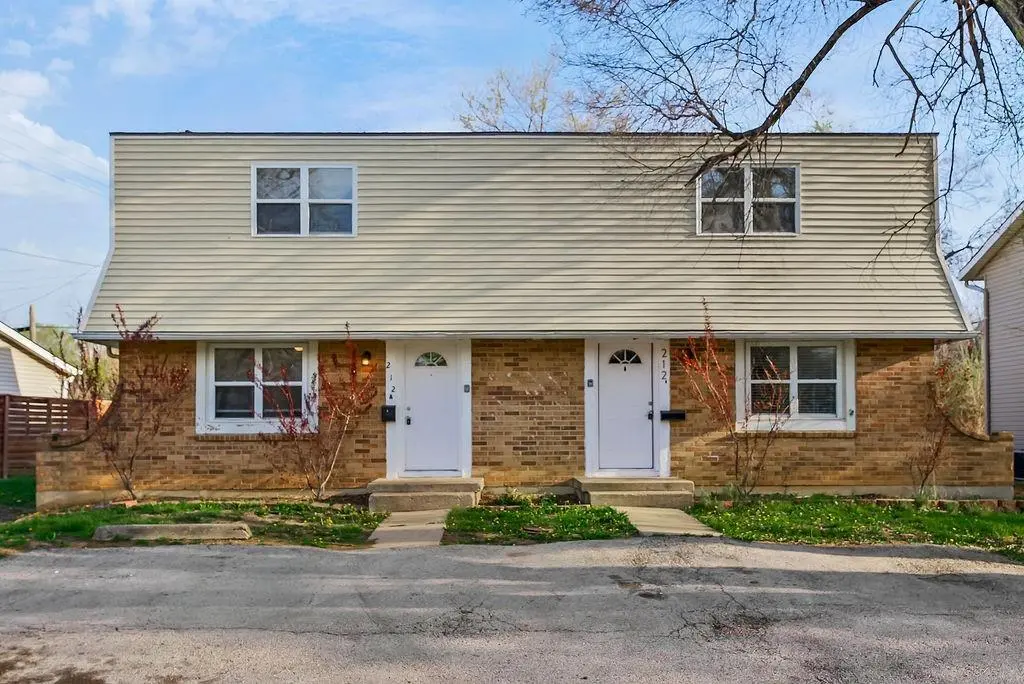
212 N Oak Dr · Belton, MO
Flood risk 1/10 · Minimal
- FEMA flood zone
- X (unshaded)
- Chance of flooding over 30 yrs
- 0.0%
- Est. flood insurance / yr
- $473 – $860
Fire risk 1/10 · Minimal
- Est. fire insurance / yr
- $1,054 – $1,958
Heat risk 4/10 · Minor
- Hot days now (above 106°F)
- 7 days/yr
- Hot days in 30 yrs
- 16 days/yr
Wind risk 2/10 · Minimal
- Chance of severe wind over 30 yrs
- —
Air-quality risk 2/10 · Minimal
- Unhealthy air days now
- 2 days/yr
- Unhealthy air days in 30 yrs
- 2 days/yr
Risk factors via First Street. Map © Google.
Why this score? — see what drove the C- grade
The composite is a weighted blend of 9 inputs, each scored 0–100. Each bar is that input's sub-score; the figure is the points it added to the 100-point composite (weight × sub-score).
- Cash flow +17.4/30.0
- ARV discount +15.0/15.0
- DSCR +5.4/10.0
- 1% rule +3.8/10.0
- Rent growth +3.8/5.0
- Livability +3.8/5.0
- Schools +3.0/10.0
- Condition / age +2.5/5.0
- Appreciation +0.0/10.0
$250,000
🖨 Deal sheet 📄 Offer letter ✓ Due diligence
Listing remarks MLS
Calling Investors! This is an opportunity to own a duplex in the growing Belton submarket! This duplex has desirable two-bedroom 1.5 bath townhome-style units. Each unit is two stories with parking out front. Every unit has washer-dryer hook-ups in the living area plus a ~600 sf unfinished basement. All of the utilities are sub-metered – including water. Low expense ratios and proven rental upside with renovations. 1050/mo rents are being achieved in the same neighborhood with the same layout.
Key facts
- Unfinished basement
- Washer dryer hookups
- Additional storage
Tags
Property features AI
Finance
- Other: Lot approximately 6,186 square feet (public records)
- Financial info: Operating expenses include other items (multi-family); Two total units (both 2-bedroom); Current occupancy: unknown—verify
Exterior
- Parking: 4 parking spaces (off street)
- Utilities: Public water; Public sewer; Separate meters
- Home design: Duplex residential income property; Two stories; Zoned R2
- Construction: Frame construction; Composition roof; Has basement
- Exterior features: Off-street parking
Interior
- Kitchen: Includes refrigerator and electric range
- Bedrooms: Two-bedroom units
- Bathrooms: Each unit has 1 full bath and 1 half bath
- Heating & cooling: Natural gas heating; Electric cooling (has cooling)
- Interior features: Refrigerator; Electric range
- Laundry & utility: Laundry located in basement
Neighborhood map
What this means for you Summary
Snapshot
- This is a 4-bed/3.0-bath single-family listed at $250k.
Deal economics
- At list price, monthly cash flow is $188 ($2k/yr) — positive.
- The deal already cash-flows at list — no discount required.
- To meet the 1% rule (rent ≥ 1% of price), the offer needs to be $220k (11.8% below list).
- Recommended offer: $220k (11.8% below list) — sets the bar for 1% rule.
- Cap rate 7.2% vs local median 4.7% in Belton — top-decile yield for the area; either an underpriced asset or a hidden risk that comps aren't pricing in. Stress-test before assuming the spread holds.
Location & tenants
- Location reads 76/100 on livability (#52 in MO, #3,782 nationally) — a middle-class / working-renter tenant base. Strengths: cost of living A+, housing A+, health & safety A+; Watch: crime C-, schools D+, commute F.
- Belton 124 (suburban): math 28% / reading 39% proficiency, ranked #216 of 324 in MO (top 67%) — families likely to look elsewhere, expect single-tenant / working-renter base with shorter leases.
- Market conditions: Rents rising fast (+5.2%/yr); 204 active listings in the ZIP; 9 comparable units currently listed for rent nearby; rentals at typical pace (median 21d on market — plan ~3-4 weeks tenant-placement turnaround); 588 units permitted in Cass County in 2024 (0 in 5+ unit buildings).
- This rent runs 37% of the median local income ($72k/yr) — at the standard rent-burdened threshold; future hikes will face affordability resistance.
Forward outlook
- Local home prices are declining (-3.0%/yr); year-one equity from $2k of loan paydown is wiped out by about $8k of value loss. Plan a longer hold.
- Cass County population projected to shrink 3% by 2050 — rents likely to lag national; underwrite the cash flow, not the appreciation.
Negotiation context
- It's been on market 32 days — a 3% lower offer ($242k) is reasonable based on typical stale-listing flexibility.
- 4 sale attempts since 4y ago with the ask held roughly flat each time — persistent listings suggest the price (not the market) is what's stuck; bring a comps-based counter.
Questions for the listing agent
- It's been on market 32 days. Have you received any prior offers? Is the seller open to a 12% concession, seller financing, or rate buy-down credit?
- Built in 1960 — when were the roof, HVAC, electrical panel, plumbing, and water heater last replaced?
- Is there a deadline driving the sale (1031 exchange, divorce, estate, relocation)? That informs how much negotiation room exists.
- Schools are D-rated, which usually means shorter tenancies and higher turnover. Who's the typical renter profile here, and what's been the actual vacancy rate?
- What's the average days-on-market for RENTAL listings here right now (not sales)? A rising rental-DOM trend means longer vacancies and softer asking-rent achievability than the comps imply.
- What's the recent tenant-quality profile in this submarket — average credit score on applications, eviction rate, late-payment / NSF rate, and stable-employment percentage? A property-management company in the area should have these aggregated.
- How much new for-sale + rental construction is in the pipeline within 1–3 miles? Heavy new supply typically softens prices + rents 12–24 months out; constrained supply supports both.
Investment metrics
- 1% rule
- 0.88% ✗
- Cap rate
- 7.20%
- Cash-on-cash
- 3.22%
- DSCR
- 1.14
- GRM
- 9.4
CMA / ARV
- ARV (on-the-fly)
- $306,432
- Comps found
- 12
Show comp detail 12 sales within ~0.75 mi
| Address | Dist | Beds/Ba | Sqft | Sold | Price | $/sf | Match |
|---|---|---|---|---|---|---|---|
| 207 King Ave | 0.60mi | 4/1.0 | 1,984 (-2%) | 3mo | $85,000 | $43 | 59 |
| 404 Hillcrest Cir | 0.65mi | 4/2.5 | 1,920 (-5%) | 4mo | $330,000 | $172 | 56 |
| 304 Givan Ct | 0.59mi | 3/2.5 (-1) | 1,849 (-8%) | 3mo | $340,000 | $184 | 49 |
| 124 Redbud Ln | 0.46mi | 3/2.5 (-1) | 1,834 (-9%) | 10mo | $307,000 | $167 | 48 |
| 110 Hillcrest Rd | 0.67mi | 4/3.0 | 1,955 (-3%) | 19mo | $242,000 | $124 | 48 |
| 522 N Park Dr | 0.64mi | 3/2.5 (-1) | 2,044 (+1%) | 19mo | $265,000 | $130 | 45 |
| 301 Lacy Ct | 0.69mi | 3/2.5 (-1) | 2,042 (+1%) | 18mo | $310,000 | $152 | 44 |
| 214 Lacy Ln | 0.70mi | 3/2.5 (-1) | 2,050 (+2%) | 19mo | $304,000 | $148 | 41 |
| 212 W Walnut St | 0.74mi | 3/3.5 (-1) | 2,127 (+6%) | 16mo | $335,000 | $157 | 36 |
| 308 Mill St | 0.73mi | 3/2.5 (-1) | 1,918 (-5%) | 18mo | $310,000 | $162 | 36 |
| 202 E South Ave | 0.75mi | 3/1.5 (-1) | 1,736 (-14%) | 9mo | $244,900 | $141 | 23 |
| 310 Baldwin St | 0.74mi | 3/2.0 (-1) | 1,760 (-13%) | 15mo | $219,500 | $125 | 22 |
Match score weights: distance 35% · size 25% · config 20% · recency 20%. Top-matched comps best support the ARV.
Projected returns pro-forma
-3.0% appreciation · 5.17% rent growth · sell at horizon
- IRR
- -9.1%
- Equity multiple
- 0.66×
- Total profit
- $-23,692
- Equity at exit
- $37,276
- IRR
- 2.8%
- Equity multiple
- 1.22×
- Total profit
- $15,587
- Equity at exit
- $21,615
Cash invested: $70,000 (down + closing). Projections, not guarantees.
Landlord ↔ Tenant lean methodology
- Overall (STATE)
- 81 Strongly Landlord-Friendly
- State Missouri
- 81 Strongly Landlord-Friendly · R+10
- County
- — inherits STATE
- City
- — inherits STATE
ZIP-level market 64012
- Rents YoY
- 5.2%
- Active inventory
- 204
- Price-to-rent
- 9.4×
Monthly cashflow live
- Estimated rent
- $2,205 high interval (Pro) →
- Mortgage (P&I)
- −$1,311
- Tax from tax record
- −$139 /mo · $1,664/yr
- Insurance
- −$104
- HOA
- −$0
- Vacancy / Maint / Mgmt
- −$463
- Net cashflow
- $188
Break-even live
UW: 25.0% down · 7.5% · 30yr · 1.5% tax · 5.0% vac · 8.0% maint · 8.0% mgmt
Financing live
Cash to close
- Down payment
- $62,500
- Closing costs
- $7,500
- Reserves months
- —
- Total cash needed
- —
Loan-product check · same deal, 3 products live
Conventional
25% down · 7.5% · 30yr
- Down + closing
- —
- Monthly P&I
- —
- Monthly cashflow
- —
- DSCR
- —
- Eligible?
- —
Personal DTI + credit; lowest rate.
DSCR
20% down · 8.5% · 30yr
- Down + closing
- —
- Monthly P&I
- —
- Monthly cashflow
- —
- DSCR
- —
- Eligible?
- —
No personal income docs; deal must DSCR.
Hard money
10% down · 12.0% · 12mo
- Down + closing
- —
- Monthly P&I
- —
- Monthly cashflow
- —
- DSCR
- —
- Eligible?
- —
Short-term bridge; refi at stabilization.
Rent comps 9 comps
| Address | Beds | Baths | Sqft | Rent | $/sqft | DOM | Units | Dist |
|---|---|---|---|---|---|---|---|---|
| 161 Rainbow Dr Belton, MO | 3.0 | 2.0 | 1624 | $1,478 | $0.91 | 23d | 1 | 0.35mi |
| 214 Lacy Ln Belton, MO | 3.0 | 2.5 | 2562 | $2,455 | $0.96 | 21d | 1 | 0.73mi |
| 211 Apple Blossom Ln Belton, MO | 4.0 | 2.5 | 1414 | $2,066 | $1.46 | 2d | 1 | 0.87mi |
| 610 Winter Dr Belton, MO | 4.0 | 3.0 | 1959 | $2,673 | $1.36 | 23d | 1 | 1.08mi |
| 117 Monroe Ave Belton, MO | 3.0 | 2.5 | 1972 | $1,950 | $0.99 | 7d | 1 | 1.10mi |
| 611 W Sunrise Dr Belton, MO | 3.0 | 2.5 | 1496 | $1,990 | $1.33 | 7d | 1 | 1.17mi |
| 805 Emerson Dr Belton, MO | 4.0 | 3.0 | 1942 | $2,355 | $1.21 | 12d | 1 | 1.18mi |
| 904 Ridge Dr Belton, MO | 5.0 | 2.0 | 1728 | $1,950 | $1.13 | 23d | 1 | 1.36mi |
| 909 Ridge Dr Belton, MO | 3.0 | 2.0 | 1539 | $1,756 | $1.14 | 20d | 1 | 1.38mi |
Listing history 16 events
-
2026-06-07statusdays on market $250,000 Pending 32 DOM
-
2026-06-05days on market $250,000 Active 31 DOM
-
2026-06-03days on market $250,000 Active 30 DOM
-
2026-06-02days on market $250,000 Active 29 DOM
-
2026-06-01days on market $250,000 Active 28 DOM
-
2026-05-31days on market $250,000 Active 27 DOM
-
2026-05-22status Active
-
2026-05-16status Pending
-
2026-05-02status Active
-
2026-04-07historical
-
2026-04-02$250,000 Active
-
2024-04-23soldstatus
-
2023-02-01soldstatus Closed 504-char remark
Show marketing remark (504 chars)
Calling Investors! This is an opportunity to own a duplex in the growing Belton submarket! This duplex has desirable two-bedroom 1.5 bath townhome-style units. Each unit is two stories with parking out front. Every unit has washer-dryer hook-ups in the living area plus a ~600 sf unfinished basement. All of the utilities are sub-metered – including water. Low expense ratios and proven rental upside with renovations. 1050/mo rents are being achieved in the same neighborhood with the same layout.
-
2022-12-23status Pending 504-char remark
Show marketing remark (504 chars)
Calling Investors! This is an opportunity to own a duplex in the growing Belton submarket! This duplex has desirable two-bedroom 1.5 bath townhome-style units. Each unit is two stories with parking out front. Every unit has washer-dryer hook-ups in the living area plus a ~600 sf unfinished basement. All of the utilities are sub-metered – including water. Low expense ratios and proven rental upside with renovations. 1050/mo rents are being achieved in the same neighborhood with the same layout.
-
2022-12-13$190,000 Active 504-char remark
Show marketing remark (504 chars)
Calling Investors! This is an opportunity to own a duplex in the growing Belton submarket! This duplex has desirable two-bedroom 1.5 bath townhome-style units. Each unit is two stories with parking out front. Every unit has washer-dryer hook-ups in the living area plus a ~600 sf unfinished basement. All of the utilities are sub-metered – including water. Low expense ratios and proven rental upside with renovations. 1050/mo rents are being achieved in the same neighborhood with the same layout.
-
2020-09-02soldstatus
ⓘ Source: listings_history table (triggers on properties + properties_extension) + one-shot
backfill from property_details.listing_events for pre-trigger history.
Tax reassessment forecast MO · Resets to sale price
- Current annual tax
- $1,664 · $139/mo
- Projected year-2 tax
- $2,425 · $202/mo
- Expected delta
- +$761/yr (+$63/mo · 45.7%)
ⓘ Screening estimate from a state-policy table — verify with the county assessor before closing.
Climate risk First Street
- Flood 1/10 Low FEMA zone X (unshaded) · 0% chance over 30 yrs
- Wildfire 1/10 Low
- Heat 4/10 Moderate 7 d/yr ≥106°F today · 16 d/yr by 30 yrs out
- Wind 2/10 Low
- Air quality 2/10 Low 2 unhealthy d/yr today · 2 by 30 yrs out
Nearby sold comps map
Loading sold comps map…
Walkable amenities ~0.75 mi
Loading nearby amenities…
Taxation est. · year 1
- Rental income
- $26,459
- − Mortgage interest
- −$14,004
- − Property taxes
- −$1,664
- − Insurance
- −$1,250
- − Repairs & maintenance
- −$2,117
- − Management
- −$2,117
- − Depreciation
- −$7,273
- Taxable loss
- −$1,965
- Est. tax savings @ 24.0%
- +$472
- After-tax cash flow
- $2,728/yr
For passive investors: Depreciation is non-cash, so a rental often shows a tax loss while cash-flowing — sheltering income. Rental losses are passive: they offset passive income freely, and up to $25,000/yr can offset ordinary (W-2) income if you actively participate and your MAGI is under $100k (phasing out to $0 by $150k); unused losses carry forward. On sale, claimed depreciation is recaptured at up to 25%, and gains may owe capital-gains tax (a 1031 exchange can defer both). Figures are a year-1 estimate at your 24.0% rate — not tax advice; consult a CPA.
Schools (NCES district)
- District
- Belton 124
- NCES district ID
- 2904620
- Math proficiency
- 28% ▼ -9.00%
- Reading proficiency
- 39% ▼ -9.00%
- Median HH income
- $56,946
- Composite
- 29.73/100
- National rank
- #6446
- State rank
- #216 of 324 in MO
Livability — Belton
- Score
- 76/100
- State rank
- #52
- US rank
- #3782
Category grades
Schools grade is shown separately in the Schools card above.
Census & demographics
- Census place
- Belton, MO
- County
- Cass County · 65,358 people
- City population
- 29,304
- Metro
- Kansas City, MO-KS
- Population (ZIP)
- 29,304
- Household income
- $71,814
- Rent vs Own
- Severe rent burden
- 1081.0
Population outlook (Cass County) Hauer SSP2
- Today (2025)
- 105,292 people
- By 2030
- 106,109 · +0.8%
- By 2040
- 105,786 · +0.5%
- By 2050
- 102,062 · -3.1%
- By 2075
- 88,569 · -15.9%
- By 2100
- 68,293 · -35.1%
Race, ethnicity, and origin ACS 2023
- Neighborhood character
- Predominantly White (80%)
- Race & ethnicity
- White 80% Two or more races 7% Hispanic / Latino 7% Black 6% Asian 1%
- Hispanic origin (detail)
- Mexican 5%
- Common ancestry
- Italian 2% Lithuanian 2% Portuguese 2%
- Foreign-born
- 2% · Canada
- Languages at home
- 96% English-only · Spanish 2% German/W. Germanic 1% Other Asian/Pacific 1%
Political lean MEDSL · Cass
- 2024 margin
- Solid R (+32.1) · D 33.3% · R 65.4% · Other 1.3%
- 2008→2024 swing
- -12.5pp toward R · 2008: -19.6pp · 2024: -32.1pp
- All cycles
- 2024: R+32.1 2020: R+31.6 2016: R+35.9 2012: R+28.4 2008: R+19.6
Not yet ingested
- Civics
- —
Market trends
- HPI YoY
- ▼ -244.76%
- Current HPI
- 214.6157
- Rent YoY
- ▲ 5.17%
- Metro
- Kansas City, MO-KS
- State GDP YoY
- ▲ 1.84%
- F500 in state
- 20
Industry mix (Fortune 500 HQ in MO)
| Industry | F500 HQs | Revenue |
|---|---|---|
| Healthcare | 1 | $163B |
|
||
| Insurance | 1 | $21B |
|
||
| Industrial Technology | 1 | $17B |
|
||
| Retail | 1 | $16B |
|
||
| Industrial Distribution | 1 | $10B |
|
||
| Utilities | 1 | $9B |
|
||
Price history
+31.6% since first listed10 events — show timeline
- 2026-05-22 Relisted — Heartland MLS as Distributed by MLS Grid
- 2026-05-16 Pending — Heartland MLS as Distributed by MLS Grid
- 2026-05-02 Relisted — Heartland MLS as Distributed by MLS Grid
- 2026-04-07 Listing Removed — Heartland MLS as Distributed by MLS Grid
- 2026-04-02 Listed $250,000 Heartland MLS as Distributed by MLS Grid
- 2024-04-23 Sold (Public Records) — Public Records
- 2023-02-01 Sold (MLS) — Heartland MLS as Distributed by MLS Grid
- 2022-12-23 Pending — Heartland MLS as Distributed by MLS Grid
- 2022-12-13 Listed $190,000 Heartland MLS as Distributed by MLS Grid
- 2020-09-02 Sold (Public Records) — Public Records
Property tax history
+4.9%/yrLatest (2025): $1,664 · +10.9% YoY. Source: county tax records.
Cash-flow waterfall
monthlySold comps — $/sqft
last 12 mo · ≤1 miLoading sold comps…