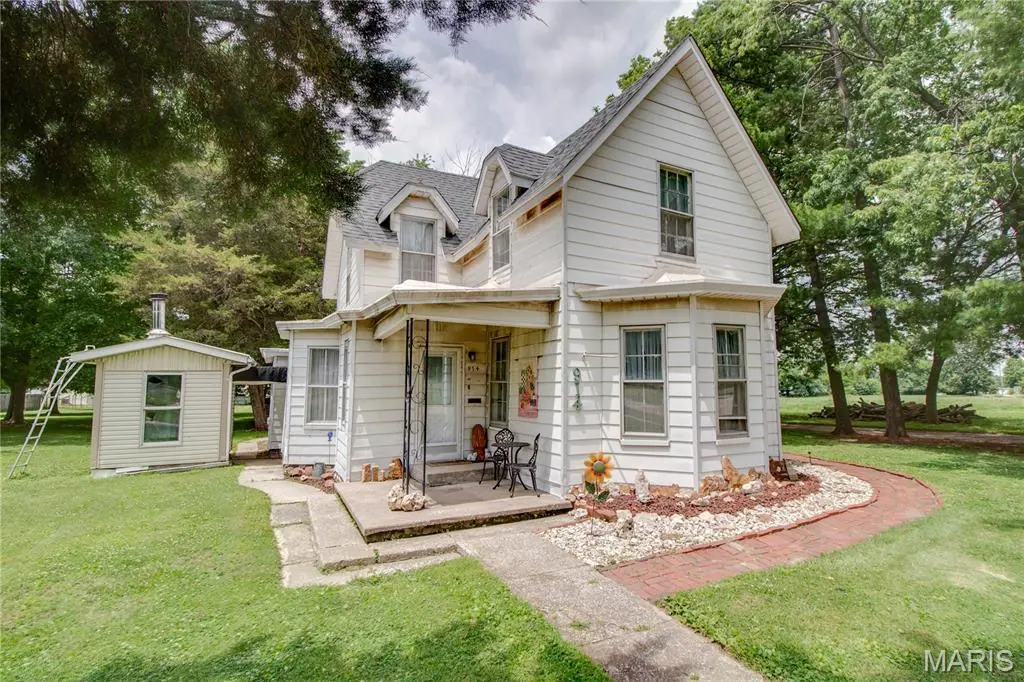
914 N Giddings Ave · Jerseyville, IL
Flood risk 1/10 · Minimal
- FEMA flood zone
- X (unshaded)
- Chance of flooding over 30 yrs
- 0.0%
- Est. flood insurance / yr
- $507 – $1,088
Fire risk 1/10 · Minimal
- Est. fire insurance / yr
- $804 – $1,492
Heat risk 4/10 · Minor
- Hot days now (above 105°F)
- 7 days/yr
- Hot days in 30 yrs
- 20 days/yr
Wind risk 2/10 · Minimal
- Chance of severe wind over 30 yrs
- 1.0%
Air-quality risk 2/10 · Minimal
- Unhealthy air days now
- 0 days/yr
- Unhealthy air days in 30 yrs
- 1 days/yr
Risk factors via First Street. Map © Google.
Why this score? — see what drove the B+ grade
The composite is a weighted blend of 9 inputs, each scored 0–100. Each bar is that input's sub-score; the figure is the points it added to the 100-point composite (weight × sub-score).
- Cash flow +30.0/30.0
- 1% rule +10.0/10.0
- DSCR +10.0/10.0
- Appreciation +10.0/10.0
- ARV discount +7.5/15.0
- Livability +3.6/5.0
- Rent growth +2.5/5.0
- Schools +2.5/10.0
- Condition / age +2.5/5.0
$99,900
🖨 Deal sheet 📄 Offer letter ✓ Due diligence
Listing remarks
Situated on 1.16 acres in Jerseyville, this well-maintained 3-bedroom home offers space, functionality, and the potential for a 4th bedroom to fit your needs. An inviting entryway welcomes you inside, where you'll find comfortable living spaces, a separate dining room, and the convenience of main-level laundry. The home features an updated full bathroom, a basement for additional storage, and dual staircases that provide easy access throughout the home. The flexible floor plan offers plenty of possibilities for a home office, guest room, or additional bedroom space. Outside, you'll appreciate the expansive yard with room to enjoy the outdoors, garden, or simply take in the peaceful setting.
Key facts
- Dual staircases
- 1.16 acres
- Expansive yard
Tags
Property features AI
Finance
- Other: Owner by contract
- Financial info: Seller may consider concessions; Lease not considered
Exterior
- Parking: 2-car garage
- Utilities: Public water; Public sewer; Electric service (Ameren); Electricity, sewer and water connected
- Home design: Single-family residence; One-and-one-half story
- Construction: Aluminum siding
- Exterior features: Level lot with some trees
Interior
- Kitchen: Kitchen on main level
- Bedrooms: 4 bedrooms total — 2 on the main level and 2 on the upper level; Upper-level bonus room
- Bathrooms: 1 full bathroom (main/upper levels)
- Heating & cooling: Forced air heating (natural gas); Central air conditioning
- Interior features: Unfinished walk-up basement; 9 total rooms
Neighborhood map
What this means for you Summary
Snapshot
- This is a 4-bed/1.0-bath single-family listed at $100k.
Deal economics
- At list price, monthly cash flow is $498 ($6k/yr) — positive.
- The deal already cash-flows at list — no discount required.
- Meets the 1% rule at list price ($1k rent vs $100k).
- Cap rate 12.3% vs local median 4.6% in Jerseyville — top-decile yield for the area; either an underpriced asset or a hidden risk that comps aren't pricing in. Stress-test before assuming the spread holds.
Location & tenants
- Location reads 72/100 on livability (#327 in IL) — a middle-class / working-renter tenant base. Strengths: cost of living A+, housing A+, crime A; Watch: health & safety C-, amenities D+, commute F.
- Jersey CUSD 100 (town): math 25% / reading 32% proficiency, ranked #260 of 620 in IL (top 42%) — low school quality limits family demand, transient renter base, plan for 1-2y turnover.
- Market conditions: 90 active listings in the ZIP; 101 units permitted in Jersey County in 2024 (68 in 5+ unit buildings).
Forward outlook
- In year one you build about $11k of equity ($691 loan paydown + $10k appreciation (10.0% local appreciation)).
- Jersey County population projected at -24% by 2050 — secular population decline; favor cash flow + early exit over multi-decade hold.
- At projected returns (10.0% appreciation + 3.0% rent growth), your $28k cash investment doubles in ~2 years — after that, you're playing with house money.
- By year 4, paydown + projected appreciation supports a ~$38k cash-out refi (75% LTV) — recoverable capital for the next deal without selling this one.
Negotiation context
- Only 6 days on market — expect competitive offers; lowballing is unlikely to land.
Risks & watch-outs
- Watch-outs: built in 1890 — expect roof / HVAC / electrical / plumbing capex.
Questions for the listing agent
- Built in 1890 — when were the roof, HVAC, electrical panel, plumbing, and water heater last replaced?
- Is there a deadline driving the sale (1031 exchange, divorce, estate, relocation)? That informs how much negotiation room exists.
- What's the average days-on-market for RENTAL listings here right now (not sales)? A rising rental-DOM trend means longer vacancies and softer asking-rent achievability than the comps imply.
- What's the recent tenant-quality profile in this submarket — average credit score on applications, eviction rate, late-payment / NSF rate, and stable-employment percentage? A property-management company in the area should have these aggregated.
- How much new for-sale + rental construction is in the pipeline within 1–3 miles? Heavy new supply typically softens prices + rents 12–24 months out; constrained supply supports both.
Investment metrics
- 1% rule
- 1.50% ✓
- Cap rate
- 12.28%
- Cash-on-cash
- 21.38%
- DSCR
- 1.95
- GRM
- 5.6
CMA / ARV
- ARV (on-the-fly)
- $213,948
- Comps found
- 12
Show comp detail 12 sales within ~0.75 mi
| Address | Dist | Beds/Ba | Sqft | Sold | Price | $/sf | Match |
|---|---|---|---|---|---|---|---|
| 502 N State St | 0.42mi | 4/1.5 | 1,928 (-3%) | 9mo | $139,900 | $73 | 67 |
| 708 N Giddings | 0.15mi | 3/2.0 (-1) | 1,729 (-13%) | 10mo | $239,000 | $138 | 55 |
| 801 High St | 0.35mi | 4/2.5 | 1,789 (-10%) | 13mo | $189,000 | $106 | 51 |
| 201 Cheney | 0.54mi | 4/2.0 | 1,856 (-6%) | 15mo | $139,900 | $75 | 48 |
| 109 Hawbrook Pl | 0.65mi | 4/2.0 | 2,128 (+7%) | 8mo | $247,400 | $116 | 47 |
| 501 W Exchange St | 0.72mi | 4/2.0 | 1,787 (-10%) | 1mo | $189,900 | $106 | 46 |
| 208 E Arch St | 0.58mi | 4/2.0 | 2,226 (+12%) | 10mo | $240,000 | $108 | 40 |
| 306 E Carpenter St | 0.68mi | 3/2.0 (-1) | 1,857 (-6%) | 11mo | $144,900 | $78 | 39 |
| 405 Henry St | 0.71mi | 3/3.0 (-1) | 1,900 (-4%) | 11mo | $235,000 | $124 | 38 |
| 614 Cleveland St | 0.62mi | 3/2.0 (-1) | 2,179 (+10%) | 9mo | $195,000 | $89 | 38 |
| 1239 Witt Mill Rd | 0.73mi | 3/2.0 (-1) | 1,716 (-13%) | 0mo | $328,500 | $191 | 34 |
| 1206 Walnut St | 0.69mi | 3/3.0 (-1) | 1,779 (-10%) | 9mo | $229,000 | $129 | 30 |
Match score weights: distance 35% · size 25% · config 20% · recency 20%. Top-matched comps best support the ARV.
Projected returns pro-forma
10.0% appreciation · 3.0% rent growth · sell at horizon
- IRR
- 40.3%
- Equity multiple
- 4.08×
- Total profit
- $86,163
- Equity at exit
- $89,998
- IRR
- 34.7%
- Equity multiple
- 9.18×
- Total profit
- $228,817
- Equity at exit
- $194,084
Cash invested: $27,972 (down + closing). Projections, not guarantees.
Landlord ↔ Tenant lean methodology
- Overall (STATE)
- 43 Moderately Tenant-Leaning
- State Illinois
- 43 Moderately Tenant-Leaning · D+7
- County
- — inherits STATE
- City
- — inherits STATE
ZIP-level market 62052
- Home prices YoY
- 10.2%
- Active inventory
- 90
- Price-to-rent
- 5.6×
Monthly cashflow live
- Estimated rent
- $1,497 medium interval (Pro) →
- Mortgage (P&I)
- −$524
- Tax from tax record
- −$119 /mo · $1,431/yr
- Insurance
- −$42
- HOA
- −$0
- Vacancy / Maint / Mgmt
- −$314
- Net cashflow
- $498
Break-even live
UW: 25.0% down · 7.5% · 30yr · 1.5% tax · 5.0% vac · 8.0% maint · 8.0% mgmt
Financing live
Cash to close
- Down payment
- $24,975
- Closing costs
- $2,997
- Reserves months
- —
- Total cash needed
- —
Loan-product check · same deal, 3 products live
Conventional
25% down · 7.5% · 30yr
- Down + closing
- —
- Monthly P&I
- —
- Monthly cashflow
- —
- DSCR
- —
- Eligible?
- —
Personal DTI + credit; lowest rate.
DSCR
20% down · 8.5% · 30yr
- Down + closing
- —
- Monthly P&I
- —
- Monthly cashflow
- —
- DSCR
- —
- Eligible?
- —
No personal income docs; deal must DSCR.
Hard money
10% down · 12.0% · 12mo
- Down + closing
- —
- Monthly P&I
- —
- Monthly cashflow
- —
- DSCR
- —
- Eligible?
- —
Short-term bridge; refi at stabilization.
Listing history 6 events
-
2026-06-18days on market $99,900 Active 6 DOM
-
2026-06-17days on market $99,900 Active 5 DOM
-
2026-06-16days on market $99,900 Active 4 DOM
-
2026-06-15days on market $99,900 Active 3 DOM
-
2026-06-13remarks 699-char remark
-
2026-06-13$99,900 Active 1 DOM
ⓘ Source: listings_history table (triggers on properties + properties_extension) + one-shot
backfill from property_details.listing_events for pre-trigger history.
Tax reassessment forecast IL · Partial reset (capped growth)
- Current annual tax
- $1,431 · $119/mo
- Projected year-2 tax
- $1,849 · $154/mo
- Expected delta
- +$419/yr (+$35/mo · 29.3%)
ⓘ Screening estimate from a state-policy table — verify with the county assessor before closing.
Climate risk First Street
- Flood 1/10 Low FEMA zone X (unshaded) · 0% chance over 30 yrs
- Wildfire 1/10 Low
- Heat 4/10 Moderate 7 d/yr ≥105°F today · 20 d/yr by 30 yrs out
- Wind 2/10 Low 100% chance of damaging wind over 30 yrs
- Air quality 2/10 Low 0 unhealthy d/yr today · 1 by 30 yrs out
Nearby sold comps map
Loading sold comps map…
Walkable amenities ~0.75 mi
Loading nearby amenities…
Taxation est. · year 1
- Rental income
- $17,970
- − Mortgage interest
- −$5,596
- − Property taxes
- −$1,431
- − Insurance
- −$500
- − Repairs & maintenance
- −$1,438
- − Management
- −$1,438
- − Depreciation
- −$2,906
- Taxable income
- $4,662
- Est. tax owed @ 24.0%
- −$1,119
- After-tax cash flow
- $4,860/yr
For passive investors: Depreciation is non-cash, so a rental often shows a tax loss while cash-flowing — sheltering income. Rental losses are passive: they offset passive income freely, and up to $25,000/yr can offset ordinary (W-2) income if you actively participate and your MAGI is under $100k (phasing out to $0 by $150k); unused losses carry forward. On sale, claimed depreciation is recaptured at up to 25%, and gains may owe capital-gains tax (a 1031 exchange can defer both). Figures are a year-1 estimate at your 24.0% rate — not tax advice; consult a CPA.
Schools (NCES district)
- District
- Jersey CUSD 100
- NCES district ID
- 1720430
- Math proficiency
- 25% ▼ -10.00%
- Reading proficiency
- 32% ▼ -14.00%
- Median HH income
- $52,066
- Composite
- 25.13/100
- National rank
- #7522
- State rank
- #260 of 620 in IL
Livability — Jerseyville
- Score
- 72/100
- State rank
- #327
- US rank
- #6498
Category grades
Schools grade is shown separately in the Schools card above.
Census & demographics
- Census place
- Jerseyville, IL
- City population
- 12,483
- Population (ZIP)
- 12,483
Population outlook (Jersey County) Hauer SSP2
- Today (2025)
- 21,031 people
- By 2030
- 20,138 · -4.2%
- By 2040
- 18,077 · -14.0%
- By 2050
- 15,882 · -24.5%
- By 2075
- 11,718 · -44.3%
- By 2100
- 8,546 · -59.4%
Race, ethnicity, and origin ACS 2023
- Neighborhood character
- Predominantly White (96%)
- Race & ethnicity
- White 96% Two or more races 4% Hispanic / Latino 2%
- Common ancestry
- Slovak 2% Italian 1% Romanian 1%
- Foreign-born
- 1% · Canada
- Languages at home
- 99% English-only · Spanish 1%
Political lean MEDSL · Jersey
- 2024 margin
- Solid R (+50.2) · D 24.1% · R 74.3% · Other 1.6%
- 2008→2024 swing
- -47.5pp toward R · 2008: -2.7pp · 2024: -50.2pp
- All cycles
- 2024: R+50.2 2020: R+48.1 2016: R+46.4 2012: R+23.9 2008: R+2.7
Not yet ingested
- Civics
- —
Market trends
- HPI YoY
- ▲ 23.63%
- Current HPI
- 255.48
- Rent YoY
- —
- Metro
- —
- State GDP YoY
- ▲ 1.59%
- F500 in state
- 60
Industry mix (Fortune 500 HQ in IL)
| Industry | F500 HQs | Revenue |
|---|---|---|
| Insurance | 4 | $201B |
|
||
| Consumer Goods | 4 | $87B |
|
||
| Industrial Machinery | 3 | $64B |
|
||
| Healthcare | 2 | $55B |
|
||
| Retail / Pharmacy | 1 | $148B |
|
||
| Agriculture / Food | 1 | $86B |
|
||
Price history
1 event — show timeline
- 2026-06-12 Listed $99,900 MARIS as Distributed by MLS Grid
Property tax history
+3.4%/yrLatest (2024): $1,431 · +6.7% YoY. Source: county tax records.
Cash-flow waterfall
monthlySold comps — $/sqft
last 12 mo · ≤1 miLoading sold comps…