 🏗️ New Construction
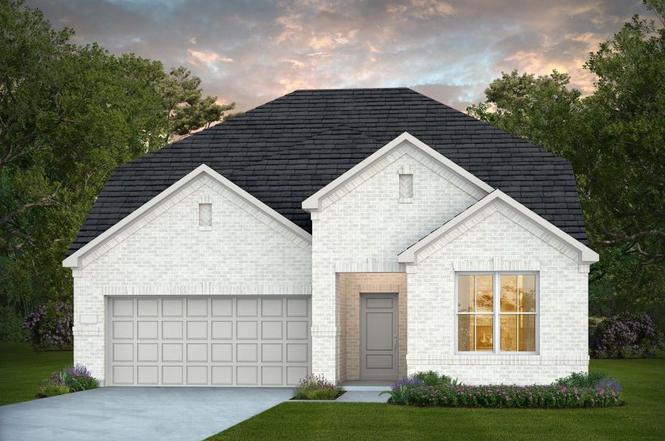
Keller Plan · Lakeway, TX
Flood risk 1/10 · Minimal
- FEMA flood zone
- X (unshaded)
- Chance of flooding over 30 yrs
- 0.0%
- Est. flood insurance / yr
- $507 – $1,088
Fire risk 5/10 · Moderate
- Est. fire insurance / yr
- $1,222 – $2,270
Heat risk 8/10 · Major
- Hot days now (above 107°F)
- 7 days/yr
- Hot days in 30 yrs
- 22 days/yr
Wind risk 6/10 · Moderate
- Chance of severe wind over 30 yrs
- 65.0%
Air-quality risk 1/10 · Minimal
- Unhealthy air days now
- 0 days/yr
- Unhealthy air days in 30 yrs
- 0 days/yr
Risk factors via First Street. Map © Google.
Why this score? — see what drove the F grade
The composite is a weighted blend of 9 inputs, each scored 0–100. Each bar is that input's sub-score; the figure is the points it added to the 100-point composite (weight × sub-score).
- ARV discount +7.5/15.0
- Cash flow +5.6/30.0
- Schools +5.5/10.0
- Livability +3.6/5.0
- Rent growth +3.3/5.0
- Condition / age +2.5/5.0
- 1% rule +1.1/10.0
- DSCR +0.0/10.0
- Appreciation +0.0/10.0
$520,990
🖨 Deal sheet 📄 Offer letter ✓ Due diligence
Listing remarks MLS
Design a life you love with the Pulte Homes Keller floor plan, a versatile two-story new home designed to fit your lifestyle. Personalize your space with options like a quiet study, extended covered patio, 3-car garage, or a spa-like bath. Enjoy flexible new home construction designed for comfort, style, and everyday living.
Key facts
- Upstairs kids' oasis
- Welcoming entry
- Loft area
Tags
Neighborhood map
What this means for you Summary
Snapshot
- This is a 4-bed/2.0-bath single-family listed at $521k.
Deal economics
- At list price, monthly cash flow is $-1k ($-15k/yr) — negative.
- To cash-flow at today's rent, offer at most $427k (18.1% below list).
- To meet the 1% rule (rent ≥ 1% of price), the offer needs to be $373k (28.4% below list).
- Recommended offer: $373k (28.4% below list) — sets the bar for 1% rule.
- Cap rate 3.8% vs local median 1.7% in Lakeway — top-decile yield for the area; either an underpriced asset or a hidden risk that comps aren't pricing in. Stress-test before assuming the spread holds.
Location & tenants
- Location reads 71/100 on livability (#330 in TX) — a middle-class / working-renter tenant base. Strengths: crime A+, employment A+, housing A+; Watch: amenities F, commute F, cost of living F.
- Lake Travis ISD (rural): math 57% / reading 61% proficiency, ranked #39 of 826 in TX (top 5%) — acceptable for families but not a draw, mixed tenant base, ~2y average lease; only 15% free/reduced lunch — higher-income household profile.
- Market conditions: Rents rising (+3.4%/yr); 649 active listings in the ZIP; 3 comparable units currently listed for rent nearby; rentals at typical pace (median 22d on market — plan ~3-4 weeks tenant-placement turnaround); high-income renter base; 17,121 units permitted in Travis County in 2024 (11,963 in 5+ unit buildings).
- This rent runs 35% of the median local income ($128k/yr) — at the standard rent-burdened threshold; future hikes will face affordability resistance.
Forward outlook
- Local home prices are declining (-3.0%/yr); year-one equity from $4k of loan paydown is wiped out by about $18k of value loss. Plan a longer hold.
- Travis County population projected at +60% by 2050 — long-run rental-demand tailwind backs the buy-and-hold thesis.
Negotiation context
- It's been on market 139 days — a 12% lower offer ($458k) is reasonable based on typical stale-listing flexibility.
Risks & watch-outs
- Climate carrying-cost: major wind risk, 65% chance of damaging wind over 30y; moderate wildfire risk; extreme-heat days projected 7→22/yr by 2055 (HVAC capex compounding) — expect insurance premiums to compound above CPI over the hold.
Questions for the listing agent
- What do current leases actually rent for vs. the listed asking? Can we see a recent rent roll and the last 12 months of T-12 income?
- It's been on market 139 days. Have you received any prior offers? Is the seller open to a 28% concession, seller financing, or rate buy-down credit?
- Why hasn't it sold? Are there any deal-killer items the seller is aware of (foundation, flood, title, zoning, code violations)?
- Is there a deadline driving the sale (1031 exchange, divorce, estate, relocation)? That informs how much negotiation room exists.
- Schools are B-rated — typically a magnet for longer-tenancy family renters. What's the average tenant stay here, and is there a school-zone premium baked into asking?
- The area grade is low — what's the realistic commute time and amenity access for the typical tenant pool here? Any planned neighborhood developments (good or bad) we should know about?
- What's the average days-on-market for RENTAL listings here right now (not sales)? A rising rental-DOM trend means longer vacancies and softer asking-rent achievability than the comps imply.
- What's the recent tenant-quality profile in this submarket — average credit score on applications, eviction rate, late-payment / NSF rate, and stable-employment percentage? A property-management company in the area should have these aggregated.
- How much new for-sale + rental construction is in the pipeline within 1–3 miles? Heavy new supply typically softens prices + rents 12–24 months out; constrained supply supports both.
Investment metrics
- 1% rule
- 0.61% ✗
- Cap rate
- 3.78%
- Cash-on-cash
- -8.96%
- DSCR
- 0.60
- GRM
- 13.7
CMA / ARV
- ARV (median comp)
- $611,795
- List price
- $520,990
- Delta
- -14.84%
- Verdict
- UNDERPRICED
- Comps
- 20 within 1.0 mi
Show comp detail 12 sales within ~0.75 mi
| Address | Dist | Beds/Ba | Sqft | Sold | Price | $/sf | Match |
|---|---|---|---|---|---|---|---|
| 22409 Rock Wren Rd | 0.34mi | 4/2.5 | 2,370 (-5%) | 3mo | $520,000 | $219 | 71 |
| 5517 Texas Bluebell Dr | 0.16mi | 3/2.5 (-1) | 2,615 (+5%) | 12mo | $510,000 | $195 | 68 |
| 22332 Rock Wren Rd | 0.36mi | 4/3.0 | 2,674 (+7%) | 1mo | $549,000 | $205 | 67 |
| 5133 Texas Bluebell Dr | 0.31mi | 4/2.5 | 2,286 (-8%) | 3mo | $547,000 | $239 | 67 |
| 21708 Agarito Ln | 0.27mi | 4/2.5 | 2,265 (-9%) | 6mo | $525,000 | $232 | 65 |
| 21940 Agarito Ln | 0.22mi | 4/3.5 | 2,658 (+6%) | 11mo | $545,000 | $205 | 64 |
| 6016 Sabino Dr | 0.44mi | 4/2.0 | 2,741 (+10%) | 1mo | $579,000 | $211 | 62 |
| 22316 Verbena Pkwy | 0.53mi | 4/3.0 | 2,382 (-5%) | 7mo | $535,000 | $225 | 58 |
| 5612 Wild Foxglove Rd | 0.27mi | 4/3.5 | 2,840 (+14%) | 3mo | $529,000 | $186 | 56 |
| 22300 Verbena Pkwy | 0.54mi | 4/2.5 | 2,298 (-8%) | 8mo | $510,000 | $222 | 53 |
| 22300 Chipotle Pass | 0.47mi | 4/2.0 | 2,153 (-14%) | 10mo | $525,000 | $244 | 46 |
| 4603 Diamante Dr | 0.62mi | 4/3.0 | 2,843 (+14%) | 12mo | $999,000 | $351 | 34 |
Match score weights: distance 35% · size 25% · config 20% · recency 20%. Top-matched comps best support the ARV.
Projected returns pro-forma
-3.0% appreciation · 3.36% rent growth · sell at horizon
- IRR
- -31.8%
- Equity multiple
- -0.05×
- Total profit
- $-179,206
- Equity at exit
- $91,221
- IRR
- -34.3%
- Equity multiple
- -0.49×
- Total profit
- $-255,133
- Equity at exit
- $52,897
Cash invested: $171,303 (down + closing). Projections, not guarantees.
Landlord ↔ Tenant lean methodology
- Overall (STATE)
- 87 Strongly Landlord-Friendly
- State Texas
- 87 Strongly Landlord-Friendly · R+5
- County
- — inherits STATE
- City
- — inherits STATE
ZIP-level market 78669
- Home prices YoY
- -16.6%
- Rents YoY
- 3.4%
- Active inventory
- 649
- Price-to-rent
- 11.6×
Monthly cashflow live
- Estimated rent
- $3,732 medium interval (Pro) →
- Mortgage (P&I)
- −$3,208
- Tax est. 1.5%
- −$765 /mo · $9,177/yr
- Insurance
- −$255
- HOA
- −$0
- Vacancy / Maint / Mgmt
- −$784
- Net cashflow
- $-1,279
Break-even live
UW: 25.0% down · 7.5% · 30yr · 1.5% tax · 5.0% vac · 8.0% maint · 8.0% mgmt
Financing live
Cash to close
- Down payment
- $152,949
- Closing costs
- $18,354
- Reserves months
- —
- Total cash needed
- —
Loan-product check · same deal, 3 products live
Conventional
25% down · 7.5% · 30yr
- Down + closing
- —
- Monthly P&I
- —
- Monthly cashflow
- —
- DSCR
- —
- Eligible?
- —
Personal DTI + credit; lowest rate.
DSCR
20% down · 8.5% · 30yr
- Down + closing
- —
- Monthly P&I
- —
- Monthly cashflow
- —
- DSCR
- —
- Eligible?
- —
No personal income docs; deal must DSCR.
Hard money
10% down · 12.0% · 12mo
- Down + closing
- —
- Monthly P&I
- —
- Monthly cashflow
- —
- DSCR
- —
- Eligible?
- —
Short-term bridge; refi at stabilization.
Rent comps 3 comps
| Address | Beds | Baths | Sqft | Rent | $/sqft | DOM | Units | Dist |
|---|---|---|---|---|---|---|---|---|
| 21824 Agarito Ln Spicewood, TX | 5.0 | 4.0 | 3253 | $3,500 | $1.08 | 2d | 1 | 0.28mi |
| 22212 Coyote Cave Trl Spicewood, TX | 5.0 | 3.0 | 2900 | $3,600 | $1.24 | 43d | 1 | 0.59mi |
| 22208 Coyote Cave Trl Spicewood, TX | 4.0 | 2.0 | 1796 | $2,990 | $1.66 | 22d | 1 | 0.59mi |
Listing history 14 events
-
2026-06-18days on market $520,990 Active 139 DOM
-
2026-06-17days on market $520,990 Active 138 DOM
-
2026-06-16days on market $520,990 Active 137 DOM
-
2026-06-15days on market $520,990 Active 136 DOM
-
2026-06-13days on market $520,990 Active 134 DOM
-
2026-06-09days on market $520,990 Active 130 DOM
-
2026-06-08days on market $520,990 Active 129 DOM
-
2026-06-07days on market $520,990 Active 128 DOM
-
2026-06-04days on market $520,990 Active 125 DOM
-
2026-06-03days on market $520,990 Active 124 DOM
-
2026-06-02days on market $520,990 Active 123 DOM
-
2026-06-01days on market $520,990 Active 122 DOM
-
2026-05-31days on market $520,990 Active 121 DOM
-
2026-01-31$520,990 Active 326-char remark
Show marketing remark (326 chars)
Design a life you love with the Pulte Homes Keller floor plan, a versatile two-story new home designed to fit your lifestyle. Personalize your space with options like a quiet study, extended covered patio, 3-car garage, or a spa-like bath. Enjoy flexible new home construction designed for comfort, style, and everyday living.
ⓘ Source: listings_history table (triggers on properties + properties_extension) + one-shot
backfill from property_details.listing_events for pre-trigger history.
Climate risk First Street
- Flood 1/10 Low FEMA zone X (unshaded) · 0% chance over 30 yrs
- Wildfire 5/10 Major
- Heat 8/10 Severe 7 d/yr ≥107°F today · 22 d/yr by 30 yrs out
- Wind 6/10 Major 65% chance of damaging wind over 30 yrs
- Air quality 1/10 Low 0 unhealthy d/yr today · 0 by 30 yrs out
Nearby sold comps map
Loading sold comps map…
Walkable amenities ~0.75 mi
Loading nearby amenities…
Taxation est. · year 1
- Rental income
- $44,789
- − Mortgage interest
- −$34,270
- − Property taxes
- −$9,177
- − Insurance
- −$3,059
- − Repairs & maintenance
- −$3,583
- − Management
- −$3,583
- − Depreciation
- −$17,798
- Taxable loss
- −$26,680
- Est. tax savings @ 24.0%
- +$6,403
- After-tax cash flow
- $-8,949/yr
For passive investors: Depreciation is non-cash, so a rental often shows a tax loss while cash-flowing — sheltering income. Rental losses are passive: they offset passive income freely, and up to $25,000/yr can offset ordinary (W-2) income if you actively participate and your MAGI is under $100k (phasing out to $0 by $150k); unused losses carry forward. On sale, claimed depreciation is recaptured at up to 25%, and gains may owe capital-gains tax (a 1031 exchange can defer both). Figures are a year-1 estimate at your 24.0% rate — not tax advice; consult a CPA.
Schools (NCES district)
- District
- Lake Travis ISD
- NCES district ID
- 4826470
- Math proficiency
- 57% ▼ -12.00%
- Reading proficiency
- 61% ▼ -9.00%
- Median HH income
- $101,194
- Composite
- 55.13/100
- National rank
- #1283
- State rank
- #39 of 826 in TX
Livability — Lakeway
- Score
- 71/100
- State rank
- #330
- US rank
- #7227
Category grades
Schools grade is shown separately in the Schools card above.
Census & demographics
- County
- Travis County · 1,299,254 people
- City population
- 22,145
- Metro
- Austin-Round Rock-Georgetown, TX
- Population (ZIP)
- 12,592
- Household income
- $128,000
- Rent vs Own
- Severe rent burden
- 45.0
Population outlook (Travis County) Hauer SSP2
- Today (2025)
- 1,545,133 people
- By 2030
- 1,729,269 · +11.9%
- By 2040
- 2,097,596 · +35.8%
- By 2050
- 2,463,890 · +59.5%
- By 2075
- 3,249,374 · +110.3%
- By 2100
- 3,801,868 · +146.1%
Race, ethnicity, and origin ACS 2023
- Neighborhood character
- Predominantly White (81%)
- Race & ethnicity
- White 81% Hispanic / Latino 13% Two or more races 8% Black 1% Asian 1%
- Hispanic origin (detail)
- Mexican 9%
- Common ancestry
- Italian 5% Slovak 3% Lithuanian 3%
- Foreign-born
- 5% · Canada
- Languages at home
- 93% English-only · Spanish 5% Other Asian/Pacific 1%
Political lean MEDSL · Travis
- 2024 margin
- Solid D (+39.3) · D 68.8% · R 29.4% · Other 1.8%
- 2008→2024 swing
- +9.9pp toward D · 2008: 29.4pp · 2024: 39.3pp
- All cycles
- 2024: D+39.3 2020: D+45.0 2016: D+38.9 2012: D+23.9 2008: D+29.4
Not yet ingested
- Civics
- —
Market trends
- HPI YoY
- ▼ -50.06%
- Current HPI
- 251.3551
- Rent YoY
- ▲ 3.36%
- Metro
- Austin-Round Rock-Georgetown, TX
- State GDP YoY
- ▲ 3.95%
- F500 in state
- 110
Industry mix (Fortune 500 HQ in TX)
| Industry | F500 HQs | Revenue |
|---|---|---|
| Energy | 16 | $1,198B |
|
||
| Technology | 5 | $198B |
|
||
| Engineering / Construction | 4 | $72B |
|
||
| Energy Services | 3 | $60B |
|
||
| Utilities | 3 | $41B |
|
||
| Healthcare | 2 | $330B |
|
||
Price history
1 event — show timeline
- 2026-01-31 Listed $520,990 Zillow
Cash-flow waterfall
monthlySold comps — $/sqft
last 12 mo · ≤1 miLoading sold comps…