708 Barelas Ct SW · Albuquerque, NM
Flood risk 1/10 · Minimal
- FEMA flood zone
- X
- Chance of flooding over 30 yrs
- 0.0%
- Est. flood insurance / yr
- $507 – $1,088
Fire risk 2/10 · Minimal
- Est. fire insurance / yr
- $706 – $1,312
Heat risk 5/10 · Moderate
- Hot days now (above 96°F)
- 7 days/yr
- Hot days in 30 yrs
- 18 days/yr
Wind risk 1/10 · Minimal
- Chance of severe wind over 30 yrs
- —
Air-quality risk 2/10 · Minimal
- Unhealthy air days now
- 1 days/yr
- Unhealthy air days in 30 yrs
- 2 days/yr
Risk factors via First Street. Map © Google.
Why this score? — see what drove the D+ grade
The composite is a weighted blend of 9 inputs, each scored 0–100. Each bar is that input's sub-score; the figure is the points it added to the 100-point composite (weight × sub-score).
- ARV discount +14.7/15.0
- Cash flow +11.7/30.0
- Schools +5.3/10.0
- Rent growth +3.7/5.0
- Livability +3.6/5.0
- DSCR +3.4/10.0
- 1% rule +2.6/10.0
- Condition / age +2.5/5.0
- Appreciation +0.0/10.0
$270,000
🖨 Deal sheet (PDF) 📄 Offer letter ✓ Due diligence
Listing remarks
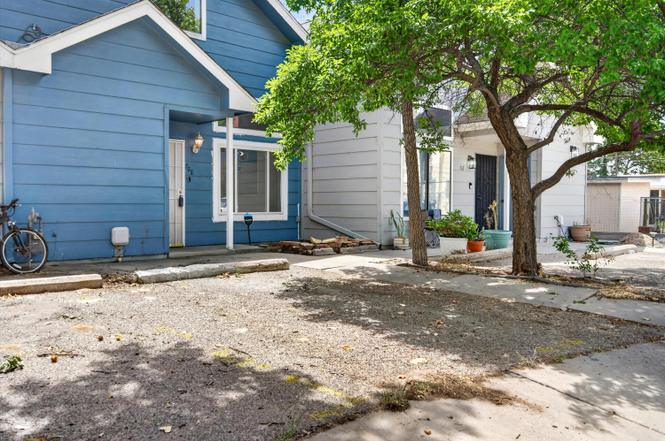
Welcome home to this charming two-story townhome tucked away in a quiet cul-de-sac in the heart of Downtown! Enjoy an unbeatable location just minutes from parks, the zoo, shopping, dining, and entertainment. This well-designed home features 2 bedrooms and 2 bathrooms, with one bedroom and bath conveniently located on the main level and the second upstairs for added privacy. The spacious living area offers plenty of room to relax and entertain, while the versatile loft is perfect for a home office, reading nook, or additional living space. Step outside to your own private, fenced backyard--ideal for morning coffee, pets, gardening, or outdoor gatherings. A rare opportunity to enjoy comfort,
Key facts
- Quiet cul de sac
- Versatile loft
- Two story townhome
Tags
Property features AI
Exterior
- Utilities: Electricity connected; Natural gas connected; Public water; Public sewer
- Home design: 2-story home; Entry level: 1; Faces east; Attached property
- Construction: Frame and stucco construction; Pitched shingle roof; Built by unknown builder
- Exterior features: Open patio
Interior
- Kitchen: Dishwasher; Free-standing gas range; Disposal; Refrigerator; Pantry
- Bedrooms: Bedrooms listed with multiple primary suites
- Flooring: Carpet; Tile; Vinyl
- Bathrooms: 2 full bathrooms
- Heating & cooling: Central heating (forced air, natural gas); Evaporative cooling
- Interior features: Ceiling fans; Dual sinks; High ceilings; Loft; Multiple primary suites; Pantry; Tub/shower; Thermal windows
- Laundry & utility: Washer; Dryer; Electric dryer hookup
Neighborhood map
What this means for you Summary
Snapshot
- This is a 2-bed/2.0-bath townhouse listed at $270k.
Deal economics
- At list price, monthly cash flow is $-81 ($-969/yr) — negative.
- To cash-flow at today's rent, offer at most $256k (5.3% below list).
- To meet the 1% rule (rent ≥ 1% of price), the offer needs to be $205k (24.1% below list).
- Recommended offer: $205k (24.1% below list) — sets the bar for 1% rule.
- Cap rate 5.9% vs local median 3.6% in Albuquerque — top-decile yield for the area; either an underpriced asset or a hidden risk that comps aren't pricing in. Stress-test before assuming the spread holds.
Location & tenants
- Location reads 72/100 on livability (#13 in NM) — a middle-class / working-renter tenant base. Strengths: amenities A+, commute A+, cost of living A+; Watch: crime F.
- Albuquerque Public Schools (urban): math 51% / reading 75% proficiency, ranked #3 of 29 in NM (top 10%) — acceptable for families but not a draw, mixed tenant base, ~2y average lease; 60% free/reduced lunch — lower-income household profile, screen leases tightly.
- Zoned schools: Coronado Elementary (308 students, 30% FRL); Washington Middle (275 students, 100% FRL); Albuquerque High (math 52% / reading 77%, grade B-, #22 of 110 statewide, top 22%, 1,714 students, 45% FRL) — zoned schools at 58% FRL track the district average.
- Market conditions: Rents rising fast (+4.9%/yr); 149 active listings in the ZIP; 20 comparable units currently listed for rent nearby; rentals lingering (median 46d on market — plan ~5-8 weeks vacancy on turnover, expect pricing pressure); 65% of comp listings sitting > 30 days — soft ceiling on asking rent; lower-income renter base — watch delinquency; 1,316 units permitted in Bernalillo County in 2024 (546 in 5+ unit buildings).
- At $2,049/mo this rent would consume 57% of the median local household income ($43k/yr) (locally 1721% of renters already pay >50% of income on rent) — very limited rent-growth headroom before tenants either downsize or default.
Forward outlook
- Local home prices are declining (-3.0%/yr); year-one equity from $2k of loan paydown is wiped out by about $8k of value loss. Plan a longer hold.
Negotiation context
- Only 7 days on market — expect competitive offers; lowballing is unlikely to land.
- 2 sale attempts since 6y ago with the ask held roughly flat each time — persistent listings suggest the price (not the market) is what's stuck; bring a comps-based counter.
Risks & watch-outs
- Climate carrying-cost: extreme-heat days projected 7→18/yr by 2055 (HVAC capex compounding) — expect insurance premiums to compound above CPI over the hold.
Questions for the listing agent
- What do current leases actually rent for vs. the listed asking? Can we see a recent rent roll and the last 12 months of T-12 income?
- Is there a deadline driving the sale (1031 exchange, divorce, estate, relocation)? That informs how much negotiation room exists.
- Schools are D-rated, which usually means shorter tenancies and higher turnover. Who's the typical renter profile here, and what's been the actual vacancy rate?
- Crime grade is F in this area — have there been break-ins, vandalism, or insurance claims at this property in the last 3 years? What carrier currently insures it and at what premium?
- The area grade is low — what's the realistic commute time and amenity access for the typical tenant pool here? Any planned neighborhood developments (good or bad) we should know about?
- What's the average days-on-market for RENTAL listings here right now (not sales)? A rising rental-DOM trend means longer vacancies and softer asking-rent achievability than the comps imply.
- What's the recent tenant-quality profile in this submarket — average credit score on applications, eviction rate, late-payment / NSF rate, and stable-employment percentage? A property-management company in the area should have these aggregated.
- How much new for-sale + rental construction is in the pipeline within 1–3 miles? Heavy new supply typically softens prices + rents 12–24 months out; constrained supply supports both.
Investment metrics
- 1% rule
- 0.76% ✗
- Cap rate
- 5.93%
- Cash-on-cash
- -1.28%
- DSCR
- 0.94
- GRM
- 11.0
CMA / ARV
- ARV (on-the-fly)
- $321,360
- Comps found
- 3
Show comp detail 3 sales within ~0.75 mi
| Address | Dist | Beds/Ba | Sqft | Sold | Price | $/sf | Match |
|---|---|---|---|---|---|---|---|
| 1215 3rd St SW Unit B | 0.20mi | 2/2.5 | 1,334 (-14%) | 1mo | $275,000 | $206 | 64 |
| 1612 Third St SW | 0.28mi | 3/2.5 (+1) | 1,750 (+12%) | 2mo | $299,999 | $171 | 58 |
| 237 Stover Ave SW | 0.47mi | 2/2.5 | 1,411 (-10%) | 8mo | $429,000 | $304 | 54 |
Match score weights: distance 35% · size 25% · config 20% · recency 20%. Top-matched comps best support the ARV.
Projected returns pro-forma
-3.0% appreciation · 4.92% rent growth · sell at horizon
- IRR
- -16.5%
- Equity multiple
- 0.41×
- Total profit
- $-44,933
- Equity at exit
- $40,258
- IRR
- -5.5%
- Equity multiple
- 0.62×
- Total profit
- $-28,826
- Equity at exit
- $23,345
Cash invested: $75,600 (down + closing). Projections, not guarantees.
Landlord ↔ Tenant lean methodology
- Overall (STATE)
- 55 Moderately Landlord-Leaning
- State New Mexico
- 55 Moderately Landlord-Leaning · D+3
- County
- — inherits STATE
- City
- — inherits STATE
ZIP-level market 87102
- Rents YoY
- 4.9%
- Active inventory
- 149
- Price-to-rent
- 11.0×
Monthly cashflow live
- Estimated rent
- $2,049 high interval (Pro) →
- Mortgage (P&I)
- −$1,416
- Tax from tax record
- −$171 /mo · $2,049/yr
- Insurance
- −$112
- HOA
- −$0
- Vacancy / Maint / Mgmt
- −$430
- Net cashflow
- $-81
Break-even live
Sensitivity live
| Price | -10% $72 | -5% $-4 | +0% $-81 | +5% $-157 | +10% $-234 |
|---|---|---|---|---|---|
| Rent | -10% $-243 | -5% $-162 | +0% $-81 | +5% $0 | +10% $81 |
| Rate | -1.0pp $55 | -0.5pp $-12 | base $-81 | +0.5pp $-151 | +1.0pp $-222 |
UW: 25.0% down · 7.5% · 30yr · 1.5% tax · 5.0% vac · 8.0% maint · 8.0% mgmt
Financing live
Cash to close
- Down payment
- $67,500
- Closing costs
- $8,100
- Reserves months
- —
- Total cash needed
- —
Loan-product check · same deal, 3 products live
Conventional
25% down · 7.5% · 30yr
- Down + closing
- —
- Monthly P&I
- —
- Monthly cashflow
- —
- DSCR
- —
- Eligible?
- —
Personal DTI + credit; lowest rate.
DSCR
20% down · 8.5% · 30yr
- Down + closing
- —
- Monthly P&I
- —
- Monthly cashflow
- —
- DSCR
- —
- Eligible?
- —
No personal income docs; deal must DSCR.
Hard money
10% down · 12.0% · 12mo
- Down + closing
- —
- Monthly P&I
- —
- Monthly cashflow
- —
- DSCR
- —
- Eligible?
- —
Short-term bridge; refi at stabilization.
Rent comps 20 comps
| Address | Beds | Baths | Sqft | Rent | $/sqft | DOM | Units | Dist |
|---|---|---|---|---|---|---|---|---|
| 1612 3rd St SW Albuquerque, NM | 3.0 | 2.5 | 1750 | $2,150 | $1.23 | 16d | 1 | 0.26mi |
| 702 Broadway Blvd SE #8 Albuquerque, NM | 2.0 | 1.5 | 1071 | $1,825 | $1.70 | 5d | 1 | 0.64mi |
| 323 Platinum St SW Albuquerque, NM | 2.0 | 1.5 | 1232 | $1,800 | $1.46 | 45d | 1 | 0.69mi |
| 225 Smith Ave SE Unit C Albuquerque, NM | 1.0 | 1.0 | 1229 | $750 | $0.61 | 5d | 1 | 0.70mi |
| 100 Gold Ave SW Albuquerque, NM | 1.0 | 2.0 | 1100 | $1,849 | $1.68 | 5d | 1 | 0.78mi |
| 100 Gold Ave SW #303 Albuquerque, NM | 1.0 | 1.0 | 1112 | $2,000 | $1.80 | 45d | 1 | 0.78mi |
| 1105 Silver Ave SW Unit B Albuquerque, NM | 2.0 | 2.5 | 1300 | $2,200 | $1.69 | 45d | 1 | 0.80mi |
| 219 Central Ave NW Unit 301 Albuquerque, NM | 2.0 | 2.0 | 1543 | $3,200 | $2.07 | 45d | 1 | 0.87mi |
| 1508 San Patricio Ave SW Unit A UP Albuquerque, NM | 2.0 | 2.0 | 1450 | $3,800 | $2.62 | 45d | 1 | 0.89mi |
| 1508 San Patricio Ave SW Albuquerque, NM | 2.0 | 2.0 | 1450 | $3,500 | $2.41 | 45d | 1 | 0.89mi |
| 423 Walter St SE Albuquerque, NM | 3.0 | 2.0 | 1420 | $2,599 | $1.83 | 45d | 1 | 0.91mi |
| 523 High St SE Albuquerque, NM | 2.0 | 2.0 | 1995 | $2,300 | $1.15 | 45d | 1 | 0.93mi |
| 423 High St SE Albuquerque, NM | 2.0 | 2.0 | 1398 | $1,850 | $1.32 | 45d | 1 | 0.97mi |
| 421 High St SE Albuquerque, NM | 2.0 | 2.0 | 1398 | $1,850 | $1.32 | 45d | 1 | 0.97mi |
| 205 Edith Blvd NE Albuquerque, NM | 2.0 | 2.0 | 1300 | $1,900 | $1.46 | 5d | 1 | 1.13mi |
| 208 13th St NW Unit B Albuquerque, NM | 1.0 | 1.0 | 1070 | $1,350 | $1.26 | 45d | 1 | 1.14mi |
| 2101 Elm St SE Apt A Albuquerque, NM | 3.0 | 1.5 | 1200 | $1,450 | $1.21 | 45d | 1 | 1.21mi |
| 520 San Pasquale Ave SW Albuquerque, NM | 3.0 | 2.0 | 1926 | $3,095 | $1.61 | 45d | 1 | 1.31mi |
| 817 Slate Ave NW Albuquerque, NM | 2.0 | 1.0 | 1200 | $1,690 | $1.41 | 25d | 1 | 1.36mi |
| 1900 Central Ave SW Unit 203 Albuquerque, NM | 2.0 | 3.0 | 2000 | $2,850 | $1.43 | 16d | 1 | 1.49mi |
Listing history 6 events
-
2026-06-22statusdays on market $270,000 Pending 7 DOM
-
2026-06-18days on market $270,000 Active 4 DOM
-
2026-06-17days on market $270,000 Active 3 DOM
-
2026-06-16days on market $270,000 Active 2 DOM
-
2026-06-15remarks 699-char remark
-
2026-06-15$270,000 Active 1 DOM
ⓘ Source: listings_history table (triggers on properties + properties_extension) + one-shot
backfill from property_details.listing_events for pre-trigger history.
Tax reassessment forecast NM · Resets to sale price
- Current annual tax
- $2,049 · $171/mo
- Projected year-2 tax
- $2,160 · $180/mo
- Expected delta
- +$111/yr (+$9/mo · 5.4%)
ⓘ Screening estimate from a state-policy table — verify with the county assessor before closing.
Climate risk First Street
- Flood 1/10 Low FEMA zone X · 0% chance over 30 yrs
- Wildfire 2/10 Low
- Heat 5/10 Major 7 d/yr ≥96°F today · 18 d/yr by 30 yrs out
- Wind 1/10 Low
- Air quality 2/10 Low 1 unhealthy d/yr today · 2 by 30 yrs out
Nearby sold comps map
Loading sold comps map…
Walkable amenities ~0.75 mi
Loading nearby amenities…
Taxation est. · year 1
- Rental income
- $24,583
- − Mortgage interest
- −$15,124
- − Property taxes
- −$2,049
- − Insurance
- −$1,350
- − Repairs & maintenance
- −$1,967
- − Management
- −$1,967
- − Depreciation
- −$7,855
- Taxable loss
- −$5,728
- Est. tax savings @ 24.0%
- +$1,375
- After-tax cash flow
- $406/yr
For passive investors: Depreciation is non-cash, so a rental often shows a tax loss while cash-flowing — sheltering income. Rental losses are passive: they offset passive income freely, and up to $25,000/yr can offset ordinary (W-2) income if you actively participate and your MAGI is under $100k (phasing out to $0 by $150k); unused losses carry forward. On sale, claimed depreciation is recaptured at up to 25%, and gains may owe capital-gains tax (a 1031 exchange can defer both). Figures are a year-1 estimate at your 24.0% rate — not tax advice; consult a CPA.
Schools (NCES district)
- District
- Albuquerque Public Schools
- NCES district ID
- 3500060
- Math proficiency
- 51% ▲ 30.00%
- Reading proficiency
- 75% ▲ 45.00%
- Median HH income
- $48,151
- Composite
- 53.29/100
- National rank
- #1487
- State rank
- #3 of 29 in NM
Livability — Albuquerque
- Score
- 72/100
- State rank
- #13
- US rank
- #6219
Category grades
Schools grade is shown separately in the Schools card above.
Census & demographics
- Census place
- Albuquerque, NM
- County
- Bernalillo County · 647,165 people
- City population
- 647,165
- Metro
- Albuquerque, NM
- Population (ZIP)
- 20,123
- Household income
- $42,990
- Rent vs Own
- Severe rent burden
- 1721.0
Population outlook (Bernalillo County) Hauer SSP2
- Today (2025)
- 704,528 people
- By 2030
- 711,723 · +1.0%
- By 2040
- 714,522 · +1.4%
- By 2050
- 709,274 · +0.7%
- By 2075
- 680,015 · -3.5%
- By 2100
- 619,879 · -12.0%
Race, ethnicity, and origin ACS 2023
- Neighborhood character
- Diverse neighborhood (Simpson 0.59)
- Race & ethnicity
- Hispanic / Latino 57% Two or more races 30% White 29% Native American 6% Black 4%
- Hispanic origin (detail)
- Mexican 35% Puerto Rican 1%
- Common ancestry
- Lithuanian 2% Slovak 1% Serbian 1%
- Foreign-born
- 12% · Canada
- Languages at home
- 64% English-only · Spanish 30% Korean 1% Other Indo-European 1%
Political lean MEDSL · Bernalillo
- 2024 margin
- Strong D (+21.0) · D 59.2% · R 38.2% · Other 2.6%
- 2008→2024 swing
- -0.3pp no change · 2008: 21.4pp · 2024: 21.0pp
- All cycles
- 2024: D+21.0 2020: D+24.4 2016: D+17.8 2012: D+16.2 2008: D+21.4
Not yet ingested
- Civics
- —
Market trends
- HPI YoY
- ▼ -208.71%
- Current HPI
- 253.8398
- Rent YoY
- ▲ 4.92%
- Metro
- Albuquerque, NM
- State GDP YoY
- —
- F500 in state
- 0
Price history
+74.2% since first listed9 events — show timeline
- 2026-06-02 Listed $270,000 Southwest MLS
- 2021-01-25 Pending — Southwest MLS
- 2021-01-25 Sold (Public Records) — Public Records
- 2020-12-17 Pending — Southwest MLS
- 2020-12-08 Price Changed $150,000 Southwest MLS
- 2020-10-30 Listed $155,000 Southwest MLS
- 2017-07-14 Sold (Public Records) — Public Records
- 2001-05-30 Sold (Public Records) — Public Records
- 1996-04-26 Sold (Public Records) — Public Records
Property tax history
+5.5%/yrLatest (2025): $2,049 · +0.4% YoY. Source: county tax records.
Cash-flow waterfall
monthlySold comps — $/sqft
last 12 mo · ≤1 miLoading sold comps…