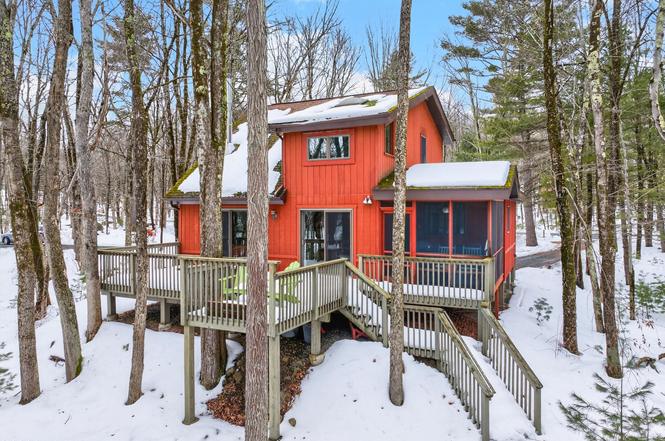
105 Tupelo Dr · Hemlock Farms, PA
Flood risk 1/10 · Minimal
- FEMA flood zone
- X (unshaded)
- Chance of flooding over 30 yrs
- 0.0%
- Est. flood insurance / yr
- $473 – $860
Fire risk 4/10 · Minor
- Est. fire insurance / yr
- $511 – $949
Heat risk 2/10 · Minimal
- Hot days now (above 91°F)
- 7 days/yr
- Hot days in 30 yrs
- 15 days/yr
Wind risk 3/10 · Minor
- Chance of severe wind over 30 yrs
- 7.0%
Air-quality risk 2/10 · Minimal
- Unhealthy air days now
- 1 days/yr
- Unhealthy air days in 30 yrs
- 2 days/yr
Risk factors via First Street. Map © Google.
Why this score? — see what drove the D grade
The composite is a weighted blend of 9 inputs, each scored 0–100. Each bar is that input's sub-score; the figure is the points it added to the 100-point composite (weight × sub-score).
- Cash flow +13.1/30.0
- Appreciation +10.0/10.0
- 1% rule +4.6/10.0
- Schools +4.2/10.0
- DSCR +3.9/10.0
- Livability +3.4/5.0
- Rent growth +2.5/5.0
- Condition / age +2.5/5.0
- ARV discount +0.0/15.0
$360,000
🖨 Deal sheet 📄 Offer letter ✓ Due diligence
Listing remarks
Waterfront on beautiful Mirror Pond in Hemlock Farms! Enjoy peaceful pond-front living with space to relax, entertain, and unwind year-round. This updated retreat offers a renovated kitchen with stainless steel appliances, refreshed bathrooms, and an expanded deck overlooking serene water and wooded views. Close to Basswood Cove, McConnell Lake access, and minutes to the Clubhouse with indoor pool, fitness center, tennis, pickleball, and more. Furnishings negotiable.
Key facts
- Expanded deck
- Serene water views
- Clubhouse access
Tags
Property features AI
Finance
- HOA & community: Homeowners association with annual fee ($2,900); Association amenities include clubhouse, fitness center, indoor pool, pool, spa/hot tub, tennis and basketball courts, dog park, park, picnic area, beach access/rights, meeting and party rooms, game room, security, trash service
Exterior
- Utilities: Public water
- Home design: Single family residence; Two levels (2 stories)
- Exterior features: Shingle roof; Pond on property; Level lot; Close to clubhouse; Waterfront lot with Mirror Pond view
Interior
- Kitchen: Dishwasher; Stainless steel appliances; Refrigerator; Oven
- Flooring: Carpet; Wood; Tile
- Bathrooms: 2 full bathrooms
- Heating & cooling: Baseboard heating; Electric heating; Ceiling fan(s)
- Interior features: Living room fireplace; Crawl space basement; Laundry room on main level; 5 total rooms
- Laundry & utility: Washer; Dryer; Water heater
Neighborhood map
What this means for you Summary
Snapshot
- This is a 3-bed/2.0-bath single-family listed at $360k.
Deal economics
- At list price, monthly cash flow is $-13 ($-150/yr) — negative.
- To cash-flow at today's rent, offer at most $358k (0.5% below list).
- To meet the 1% rule (rent ≥ 1% of price), the offer needs to be $344k (4.5% below list).
- Recommended offer: $338k (6.0% below list) — sets the bar for market timing.
Location & tenants
- Location reads 68/100 on livability (#884 in PA) — a middle-class / working-renter tenant base. Strengths: crime A+, housing A+, health & safety A+; Watch: schools C-, amenities F, commute F.
- Wallenpaupack Area SD (rural): math 39% / reading 59% proficiency, ranked #192 of 539 in PA (top 36%) — families likely to look elsewhere, expect single-tenant / working-renter base with shorter leases.
- Market conditions: 371 active listings in the ZIP; 2 comparable units currently listed for rent nearby; 213 units permitted in Pike County in 2024 (0 in 5+ unit buildings).
Forward outlook
- In year one you build about $38k of equity ($2k loan paydown + $36k appreciation (10.0% local appreciation)).
- Pike County population projected at -25% by 2050 — secular population decline; favor cash flow + early exit over multi-decade hold.
- At projected returns (10.0% appreciation + 3.0% rent growth), your $101k cash investment doubles in ~3 years — after that, you're playing with house money.
- By year 2, paydown + projected appreciation supports a ~$62k cash-out refi (75% LTV) — recoverable capital for the next deal without selling this one.
Negotiation context
- It's been on market 63 days — a 6% lower offer ($338k) is reasonable based on typical stale-listing flexibility.
- 2 sale attempts since 2y ago; this cycle's ask has dropped $25k (6%) from the opening price — seller is motivated, your offer sets the floor, not the list.
Questions for the listing agent
- What do current leases actually rent for vs. the listed asking? Can we see a recent rent roll and the last 12 months of T-12 income?
- It's been on market 63 days. Have you received any prior offers? Is the seller open to a 6% concession, seller financing, or rate buy-down credit?
- What does the HOA fee cover, when was the last increase, and are there any pending special assessments or reserve-fund shortfalls?
- Why hasn't it sold? Are there any deal-killer items the seller is aware of (foundation, flood, title, zoning, code violations)?
- Is there a deadline driving the sale (1031 exchange, divorce, estate, relocation)? That informs how much negotiation room exists.
- The area grade is low — what's the realistic commute time and amenity access for the typical tenant pool here? Any planned neighborhood developments (good or bad) we should know about?
- What's the average days-on-market for RENTAL listings here right now (not sales)? A rising rental-DOM trend means longer vacancies and softer asking-rent achievability than the comps imply.
- What's the recent tenant-quality profile in this submarket — average credit score on applications, eviction rate, late-payment / NSF rate, and stable-employment percentage? A property-management company in the area should have these aggregated.
- How much new for-sale + rental construction is in the pipeline within 1–3 miles? Heavy new supply typically softens prices + rents 12–24 months out; constrained supply supports both.
Investment metrics
- 1% rule
- 0.96% ✗
- Cap rate
- 6.25%
- Cash-on-cash
- -0.15%
- DSCR
- 0.99
- GRM
- 8.7
CMA / ARV
- ARV (on-the-fly)
- $263,655
- Comps found
- 12
Show comp detail 12 sales within ~0.75 mi
| Address | Dist | Beds/Ba | Sqft | Sold | Price | $/sf | Match |
|---|---|---|---|---|---|---|---|
| 105 Tupelo Dr | 0.00mi | 3/2.0 | 1,215 (0%) | 0mo | $360,000 | $296 | 100 |
| 800 Bluestone Ct N Unit 800 Bluestone Court North | 0.44mi | 3/2.0 | 1,202 (-1%) | 1mo | $276,000 | $230 | 77 |
| 123 Basswood Ln E | 0.14mi | 3/2.0 | 1,320 (+9%) | 8mo | $512,500 | $388 | 72 |
| 111 Blueridge Ln | 0.51mi | 3/1.0 | 1,176 (-3%) | 9mo | $215,000 | $183 | 60 |
| 801 Granite Ct S | 0.61mi | 3/2.0 | 1,305 (+7%) | 4mo | $283,000 | $217 | 56 |
| 304 Forest Dr | 0.63mi | 3/1.5 | 1,344 (+11%) | 2mo | $280,000 | $208 | 50 |
| 104 Ironwood Ln | 0.35mi | 3/2.0 | 1,032 (-15%) | 14mo | $260,000 | $252 | 47 |
| 108 Blue Shelf Ln | 0.65mi | 2/1.5 (-1) | 1,200 (-1%) | 18mo | $225,000 | $188 | 46 |
| 304 Forest Drive Dr | 0.63mi | 3/1.5 | 1,344 (+11%) | 11mo | $181,000 | $135 | 42 |
| 104 Black Birch Ln | 0.63mi | 3/2.0 | 1,322 (+9%) | 19mo | $240,000 | $182 | 40 |
| 807 Woodland Ct | 0.52mi | 2/1.5 (-1) | 1,058 (-13%) | 10mo | $215,000 | $203 | 39 |
| 404 Forest Dr | 0.75mi | 3/1.0 | 1,085 (-11%) | 6mo | $270,000 | $249 | 38 |
Match score weights: distance 35% · size 25% · config 20% · recency 20%. Top-matched comps best support the ARV.
Projected returns pro-forma
10.0% appreciation · 3.0% rent growth · sell at horizon
- IRR
- 24.2%
- Equity multiple
- 2.94×
- Total profit
- $195,467
- Equity at exit
- $324,317
- IRR
- 21.5%
- Equity multiple
- 6.72×
- Total profit
- $576,647
- Equity at exit
- $699,401
Cash invested: $100,800 (down + closing). Projections, not guarantees.
Landlord ↔ Tenant lean methodology
- Overall (STATE)
- 62 Landlord-Friendly
- State Pennsylvania
- 62 Landlord-Friendly · EVEN
- County
- — inherits STATE
- City
- — inherits STATE
ZIP-level market 18428
- Home prices YoY
- 9.2%
- Active inventory
- 371
- Price-to-rent
- 8.7×
Monthly cashflow live
- Estimated rent
- $3,440 medium interval (Pro) →
- Mortgage (P&I)
- −$1,888
- Tax est. 1.5%
- −$450 /mo · $5,400/yr
- Insurance
- −$150
- HOA
- −$242
- Vacancy / Maint / Mgmt
- −$722
- Net cashflow
- $-13
Break-even live
UW: 25.0% down · 7.5% · 30yr · 1.5% tax · 5.0% vac · 8.0% maint · 8.0% mgmt
Financing live
Cash to close
- Down payment
- $90,000
- Closing costs
- $10,800
- Reserves months
- —
- Total cash needed
- —
Loan-product check · same deal, 3 products live
Conventional
25% down · 7.5% · 30yr
- Down + closing
- —
- Monthly P&I
- —
- Monthly cashflow
- —
- DSCR
- —
- Eligible?
- —
Personal DTI + credit; lowest rate.
DSCR
20% down · 8.5% · 30yr
- Down + closing
- —
- Monthly P&I
- —
- Monthly cashflow
- —
- DSCR
- —
- Eligible?
- —
No personal income docs; deal must DSCR.
Hard money
10% down · 12.0% · 12mo
- Down + closing
- —
- Monthly P&I
- —
- Monthly cashflow
- —
- DSCR
- —
- Eligible?
- —
Short-term bridge; refi at stabilization.
Rent comps 2 comps
| Address | Beds | Baths | Sqft | Rent | $/sqft | DOM | Units | Dist |
|---|---|---|---|---|---|---|---|---|
| 811 Hickory Ct Hawley, PA | 3.0 | 2.0 | 1100 | $2,500 | $2.27 | 1d | 1 | 0.38mi |
| 313 Forest Dr Blooming Grove, PA | 3.0 | 2.0 | 1200 | $5,000 | $4.17 | 1d | 1 | 0.69mi |
HOA detail
- Monthly dues
- $242 · $2,904/yr
- Likely covers
- waterpoolgym
Listing history 6 events
-
2026-04-29status Pending
-
2026-04-22price $360,000
-
2026-02-25$385,000 Active
-
2025-10-04price $385,000
-
2025-05-29price $395,000
-
2024-09-24$425,000 Active
ⓘ Source: listings_history table (triggers on properties + properties_extension) + one-shot
backfill from property_details.listing_events for pre-trigger history.
Climate risk First Street
- Flood 1/10 Low FEMA zone X (unshaded) · 0% chance over 30 yrs
- Wildfire 4/10 Moderate
- Heat 2/10 Low 7 d/yr ≥91°F today · 15 d/yr by 30 yrs out
- Wind 3/10 Moderate 7% chance of damaging wind over 30 yrs
- Air quality 2/10 Low 1 unhealthy d/yr today · 2 by 30 yrs out
Nearby sold comps map
Loading sold comps map…
Walkable amenities ~0.75 mi
Loading nearby amenities…
Taxation est. · year 1
- Rental income
- $41,276
- − Mortgage interest
- −$20,166
- − Property taxes
- −$5,400
- − Insurance
- −$1,800
- − Repairs & maintenance
- −$3,302
- − Management
- −$3,302
- − HOA
- −$2,904
- − Depreciation
- −$10,473
- Taxable loss
- −$6,070
- Est. tax savings @ 24.0%
- +$1,457
- After-tax cash flow
- $1,306/yr
For passive investors: Depreciation is non-cash, so a rental often shows a tax loss while cash-flowing — sheltering income. Rental losses are passive: they offset passive income freely, and up to $25,000/yr can offset ordinary (W-2) income if you actively participate and your MAGI is under $100k (phasing out to $0 by $150k); unused losses carry forward. On sale, claimed depreciation is recaptured at up to 25%, and gains may owe capital-gains tax (a 1031 exchange can defer both). Figures are a year-1 estimate at your 24.0% rate — not tax advice; consult a CPA.
Schools (NCES district)
- District
- Wallenpaupack Area SD
- NCES district ID
- 4224750
- Math proficiency
- 39% ▼ -10.00%
- Reading proficiency
- 59% ▼ -5.00%
- Median HH income
- $51,027
- Composite
- 41.97/100
- National rank
- #3345
- State rank
- #192 of 539 in PA
Livability — Hemlock Farms
- Score
- 68/100
- State rank
- #884
- US rank
- #9421
Category grades
Schools grade is shown separately in the Schools card above.
Census & demographics
- Census place
- Hemlock Farms, PA
- Population (ZIP)
- 12,446
Population outlook (Pike County) Hauer SSP2
- Today (2025)
- 53,548 people
- By 2030
- 51,622 · -3.6%
- By 2040
- 46,490 · -13.2%
- By 2050
- 40,372 · -24.6%
- By 2075
- 31,951 · -40.3%
- By 2100
- 26,821 · -49.9%
Race, ethnicity, and origin ACS 2023
- Neighborhood character
- Predominantly White (85%)
- Race & ethnicity
- White 85% Hispanic / Latino 8% Two or more races 6% Black 1% Asian 1%
- Hispanic origin (detail)
- Puerto Rican 5%
- Common ancestry
- Romanian 5% Portuguese 3% Italian 2%
- Foreign-born
- 5% · Canada
- Languages at home
- 91% English-only · Spanish 5% Russian/Polish/Slavic 1% Other Asian/Pacific 1%
Political lean MEDSL · Pike
- 2024 margin
- Strong R (+24.1) · D 37.6% · R 61.6%
- 2008→2024 swing
- -19.8pp toward R · 2008: -4.2pp · 2024: -24.1pp
- All cycles
- 2024: R+24.1 2020: R+19.0 2016: R+26.0 2012: R+11.0 2008: R+4.2
Not yet ingested
- Civics
- —
Market trends
- HPI YoY
- ▲ 28.60%
- Current HPI
- 340.8254
- Rent YoY
- —
- Metro
- —
- State GDP YoY
- ▲ 1.68%
- F500 in state
- 34
Industry mix (Fortune 500 HQ in PA)
| Industry | F500 HQs | Revenue |
|---|---|---|
| Healthcare | 2 | $309B |
|
||
| Insurance | 2 | $27B |
|
||
| Telecommunications / Media | 1 | $124B |
|
||
| Industrial Distribution | 1 | $22B |
|
||
| Financial Services | 1 | $20B |
|
||
| Chemicals / Materials | 1 | $18B |
|
||
Price history
-15.3% since first listed6 events — show timeline
- 2026-04-29 Pending — PWMLS
- 2026-04-22 Price Changed $360,000 PWMLS
- 2026-02-25 Listed $385,000 PWMLS
- 2025-10-04 Price Changed $385,000 PWMLS
- 2025-05-29 Price Changed $395,000 PWMLS
- 2024-09-24 Listed $425,000 PWMLS
Cash-flow waterfall
monthlySold comps — $/sqft
last 12 mo · ≤1 miLoading sold comps…