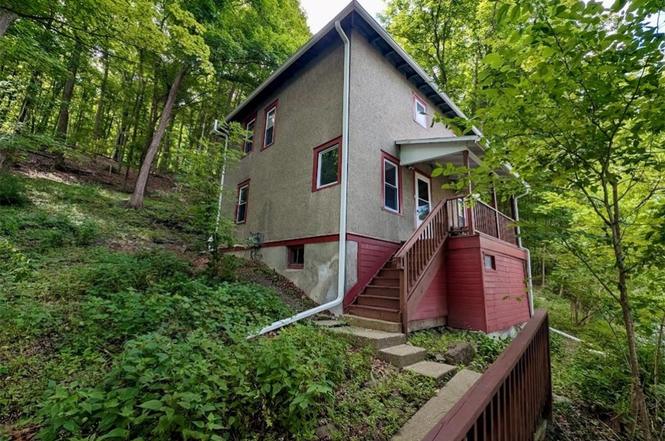
351 Spencer Rd · Ithaca, NY
Flood risk 1/10 · Minimal
- FEMA flood zone
- X
- Chance of flooding over 30 yrs
- 0.0%
- Est. flood insurance / yr
- $473 – $860
Fire risk 3/10 · Minor
- Est. fire insurance / yr
- $691 – $1,283
Heat risk 3/10 · Minor
- Hot days now (above 93°F)
- 7 days/yr
- Hot days in 30 yrs
- 16 days/yr
Wind risk 1/10 · Minimal
- Chance of severe wind over 30 yrs
- 0.0%
Air-quality risk 2/10 · Minimal
- Unhealthy air days now
- 0 days/yr
- Unhealthy air days in 30 yrs
- 1 days/yr
Risk factors via First Street. Map © Google.
Why this score? — see what drove the C+ grade
The composite is a weighted blend of 9 inputs, each scored 0–100. Each bar is that input's sub-score; the figure is the points it added to the 100-point composite (weight × sub-score).
- Cash flow +23.6/30.0
- ARV discount +9.9/15.0
- DSCR +7.6/10.0
- 1% rule +6.5/10.0
- Schools +5.4/10.0
- Livability +3.9/5.0
- Rent growth +3.8/5.0
- Condition / age +2.5/5.0
- Appreciation +0.0/10.0
$240,000
🖨 Deal sheet (PDF) 📄 Offer letter ✓ Due diligence
Listing remarks
Charming 3-bed 1-bath downtown hillside home offering convenience and tranquility. Central AC for those sweltering heat waves. Wood stove keeps you cozy through winter. Nearly an acre wooded lot provides privacy and minimal maintenance. Nice-sized rooms with a comfortable floor plan. Hardwood floors, sweet entryway with natural woodwork, and new windows throughout 2018. Walkability to shopping, dining, TCAT, and multiple services. Proximity to IC, Cornell, the Commons, state parks, and multiple trails make this an excellent location. Driveway accessible on Stone Quarry. Home inspection available.
Key facts
- Central ac
- Wood stove
- Hardwood floors
Tags
Property features AI
Exterior
- Parking: Driveway; Gravel and asphalt surfaces; No garage
- Utilities: Public water; Sewer connected; Circuit breaker electrical service; Cable available; Water connected
- Home design: Single family residence; Two levels / 2 stories
- Construction: Stucco and wood siding; Blown-in and spray foam insulation; Stone foundation; Asphalt roof; Built (year not provided)
- Exterior features: Private yard; Porch; Corner lot; Irregular lot; Near public transit; Secluded; Wooded
Interior
- Kitchen: Electric oven; Electric range; Microwave; Dishwasher; Disposal; Refrigerator; Tankless water heater
- Flooring: Hardwood; Ceramic tile; Tile; Varies
- Bathrooms: 1 full bathroom
- Heating & cooling: Forced air heating (natural gas); Central air conditioning
- Interior features: Natural woodwork; Fireplace (1)
- Laundry & utility: Washer; Dryer; Laundry room in basement; Full basement
Neighborhood map
What this means for you Summary
Snapshot
- This is a 3-bed/1.0-bath single-family listed at $240k.
Deal economics
- At list price, monthly cash flow is $452 ($5k/yr) — positive.
- The deal already cash-flows at list — no discount required.
- Meets the 1% rule at list price ($3k rent vs $240k).
- Recommended offer: $226k (6.0% below list) — sets the bar for market timing.
- Cap rate 8.6% vs local median 5.3% in Ithaca — top-decile yield for the area; either an underpriced asset or a hidden risk that comps aren't pricing in. Stress-test before assuming the spread holds.
Location & tenants
- Location reads 77/100 on livability (#210 in NY, #3,240 nationally) — a middle-class / working-renter tenant base. Strengths: amenities A+, commute A+, health & safety A+; Watch: housing C-, employment D+, cost of living D.
- Ithaca City School District (urban): math 57% / reading 71% proficiency, ranked #195 of 590 in NY (top 33%) — acceptable for families but not a draw, mixed tenant base, ~2y average lease.
- Zoned schools: Fall Creek Elementary School (math 37% / reading 62%, grade D, #1,085 of 2,108 statewide, top 56%, 232 students, 40% FRL).
- Zoned-school proficiency averages 50% at this address vs 64% district-wide (-14 pts) — the specific schools serving this property underperform the Ithaca City School District average; the district grade overstates school quality for this exact location.
- Market conditions: Rents rising fast (+5.2%/yr); 327 active listings in the ZIP; 8 comparable units currently listed for rent nearby; rentals lingering (median 45d on market — plan ~5-8 weeks vacancy on turnover, expect pricing pressure); 100% of comp listings sitting > 30 days — soft ceiling on asking rent; 382 units permitted in Tompkins County in 2024 (208 in 5+ unit buildings).
Forward outlook
- Local home prices are declining (-3.0%/yr); year-one equity from $2k of loan paydown is wiped out by about $7k of value loss. Plan a longer hold.
- Tompkins County population projected at +17% by 2050 — long-run rental-demand tailwind backs the buy-and-hold thesis.
- At projected returns (-3.0% appreciation + 5.2% rent growth), your $67k cash investment doubles in ~10 years — after that, you're playing with house money.
Negotiation context
- It's been on market 68 days — a 6% lower offer ($226k) is reasonable based on typical stale-listing flexibility.
- 3 sale attempts with the ask held roughly flat each time — persistent listings suggest the price (not the market) is what's stuck; bring a comps-based counter.
- Current owner paid $120k; list at $240k implies a 100% gain — meaningful room to come down on a strong offer.
Risks & watch-outs
- Watch-outs: built in 1900 — expect roof / HVAC / electrical / plumbing capex.
Questions for the listing agent
- It's been on market 68 days. Have you received any prior offers? Is the seller open to a 6% concession, seller financing, or rate buy-down credit?
- Built in 1900 — when were the roof, HVAC, electrical panel, plumbing, and water heater last replaced?
- Why hasn't it sold? Are there any deal-killer items the seller is aware of (foundation, flood, title, zoning, code violations)?
- Is there a deadline driving the sale (1031 exchange, divorce, estate, relocation)? That informs how much negotiation room exists.
- Schools are A-rated — typically a magnet for longer-tenancy family renters. What's the average tenant stay here, and is there a school-zone premium baked into asking?
- What's the average days-on-market for RENTAL listings here right now (not sales)? A rising rental-DOM trend means longer vacancies and softer asking-rent achievability than the comps imply.
- What's the recent tenant-quality profile in this submarket — average credit score on applications, eviction rate, late-payment / NSF rate, and stable-employment percentage? A property-management company in the area should have these aggregated.
- How much new for-sale + rental construction is in the pipeline within 1–3 miles? Heavy new supply typically softens prices + rents 12–24 months out; constrained supply supports both.
Investment metrics
- 1% rule
- 1.15% ✓
- Cap rate
- 8.55%
- Cash-on-cash
- 8.06%
- DSCR
- 1.36
- GRM
- 7.2
CMA / ARV
- ARV (on-the-fly)
- $253,344
- Comps found
- 12
Show comp detail 12 sales within ~0.75 mi
| Address | Dist | Beds/Ba | Sqft | Sold | Price | $/sf | Match |
|---|---|---|---|---|---|---|---|
| 351 Spencer Rd | 0.00mi | 3/1.0 | 1,248 (0%) | 1mo | $240,000 | $192 | 99 |
| 336 Spencer Rd | 0.05mi | 3/1.0 | 1,224 (-2%) | 1mo | $136,000 | $111 | 94 |
| 109 Hyers St | 0.46mi | 3/1.0 | 1,234 (-1%) | 8mo | $250,000 | $203 | 70 |
| 602 S Albany St | 0.43mi | 3/1.0 | 1,296 (+4%) | 6mo | $130,000 | $100 | 68 |
| 713 S Plain St | 0.34mi | 3/1.0 | 1,220 (-2%) | 18mo | $245,000 | $201 | 65 |
| 742 S Aurora St | 0.64mi | 3/2.0 | 1,229 (-2%) | 11mo | $393,000 | $320 | 54 |
| 806 S Plain St | 0.30mi | 3/1.0 | 1,430 (+15%) | 16mo | $349,000 | $244 | 49 |
| 111 S Titus Ave | 0.59mi | 3/2.0 | 1,388 (+11%) | 1mo | $235,000 | $169 | 48 |
| 801 S Aurora St | 0.57mi | 3/2.0 | 1,350 (+8%) | 12mo | $350,000 | $259 | 45 |
| 504 S Albany St | 0.50mi | 3/1.0 | 1,113 (-11%) | 16mo | $195,000 | $175 | 45 |
| 440 N Titus Ave | 0.53mi | 2/1.5 (-1) | 1,153 (-8%) | 19mo | $245,000 | $212 | 40 |
| 413 W Clinton St | 0.65mi | 4/1.5 (+1) | 1,422 (+14%) | 6mo | $400,000 | $281 | 34 |
Match score weights: distance 35% · size 25% · config 20% · recency 20%. Top-matched comps best support the ARV.
Projected returns pro-forma
-3.0% appreciation · 5.22% rent growth · sell at horizon
- IRR
- -1.4%
- Equity multiple
- 0.94×
- Total profit
- $-3,713
- Equity at exit
- $35,785
- IRR
- 10.6%
- Equity multiple
- 1.91×
- Total profit
- $61,326
- Equity at exit
- $20,751
Cash invested: $67,200 (down + closing). Projections, not guarantees.
Landlord ↔ Tenant lean methodology
- Overall (STATE)
- 15 Strongly Tenant-Friendly
- State New York
- 15 Strongly Tenant-Friendly · D+10
- County
- — inherits STATE
- City
- — inherits STATE
ZIP-level market 14850
- Rents YoY
- 5.2%
- Active inventory
- 327
- Price-to-rent
- 7.2×
Monthly cashflow live
- Estimated rent
- $2,770 high interval (Pro) →
- Mortgage (P&I)
- −$1,259
- Tax from tax record
- −$378 /mo · $4,535/yr
- Insurance
- −$100
- HOA
- −$0
- Vacancy / Maint / Mgmt
- −$582
- Net cashflow
- $452
Break-even live
Sensitivity live
| Price | -10% $587 | -5% $520 | +0% $452 | +5% $384 | +10% $316 |
|---|---|---|---|---|---|
| Rent | -10% $233 | -5% $342 | +0% $452 | +5% $561 | +10% $670 |
| Rate | -1.0pp $572 | -0.5pp $513 | base $452 | +0.5pp $389 | +1.0pp $326 |
UW: 25.0% down · 7.5% · 30yr · 1.5% tax · 5.0% vac · 8.0% maint · 8.0% mgmt
Financing live
Cash to close
- Down payment
- $60,000
- Closing costs
- $7,200
- Reserves months
- —
- Total cash needed
- —
Loan-product check · same deal, 3 products live
Conventional
25% down · 7.5% · 30yr
- Down + closing
- —
- Monthly P&I
- —
- Monthly cashflow
- —
- DSCR
- —
- Eligible?
- —
Personal DTI + credit; lowest rate.
DSCR
20% down · 8.5% · 30yr
- Down + closing
- —
- Monthly P&I
- —
- Monthly cashflow
- —
- DSCR
- —
- Eligible?
- —
No personal income docs; deal must DSCR.
Hard money
10% down · 12.0% · 12mo
- Down + closing
- —
- Monthly P&I
- —
- Monthly cashflow
- —
- DSCR
- —
- Eligible?
- —
Short-term bridge; refi at stabilization.
Rent comps 8 comps
| Address | Beds | Baths | Sqft | Rent | $/sqft | DOM | Units | Dist |
|---|---|---|---|---|---|---|---|---|
| 324 Spencer Rd Ithaca, NY | 2.0 | 1.0 | 850 | $2,545 | $2.99 | 44d | 8 | 0.18mi |
| 815 S Aurora St Ithaca, NY | 2.0–4.0 | 1.0 | 936 | $2,125 | $2.27 | 44d | 1 | 0.54mi |
| 320 Hillview Pl Ithaca, NY | 2.0–3.0 | 1.0 | 800 | $2,100 | $2.62 | 44d | 4 | 0.77mi |
| 430 W State St Ithaca, NY | 2.0 | 1.0–2.0 | 727 | $3,410 | $4.69 | 44d | 34 | 0.88mi |
| 323 Taughannock Blvd Ithaca, NY | 2.0 | 1.0–2.5 | 1167 | $6,402 | $5.48 | 44d | 6 | 1.10mi |
| 139 Chestnut St Ithaca, NY | 1.0–3.0 | 1.0 | 850 | $1,895 | $2.23 | 44d | 1 | 1.17mi |
| 127 College Ave Ithaca, NY | 3.0 | 1.0 | 958 | $2,885 | $3.01 | 44d | 1 | 1.37mi |
| 211 Linden Ave Ithaca, NY | 3.0 | 1.5 | 760 | $3,218 | $4.23 | 44d | 4 | 1.43mi |
Listing history 11 events
-
2026-05-12status Pending
-
2026-03-13historical Active Under Contract
-
2026-03-05$240,000 Active
-
2025-09-26historical Active Under Contract
-
2025-08-26price $240,000
-
2025-08-08price $245,000
-
2025-07-28status Active
-
2025-06-26$250,000 Active
-
2010-04-09soldstatus $120,000
-
2006-08-09soldstatus $72,000
-
2002-08-05soldstatus $47,900
ⓘ Source: listings_history table (triggers on properties + properties_extension) + one-shot
backfill from property_details.listing_events for pre-trigger history.
Tax reassessment forecast NY · Partial reset (capped growth)
- Current annual tax
- $4,535 · $378/mo
- Projected year-2 tax
- $4,535 · $378/mo
- Expected delta
- $0/yr ($0/mo · 0.0%)
ⓘ Screening estimate from a state-policy table — verify with the county assessor before closing.
Climate risk First Street
- Flood 1/10 Low FEMA zone X · 0% chance over 30 yrs
- Wildfire 3/10 Moderate
- Heat 3/10 Moderate 7 d/yr ≥93°F today · 16 d/yr by 30 yrs out
- Wind 1/10 Low 0% chance of damaging wind over 30 yrs
- Air quality 2/10 Low 0 unhealthy d/yr today · 1 by 30 yrs out
Nearby sold comps map
Loading sold comps map…
Walkable amenities ~0.75 mi
Loading nearby amenities…
Taxation est. · year 1
- Rental income
- $33,237
- − Mortgage interest
- −$13,444
- − Property taxes
- −$4,535
- − Insurance
- −$1,200
- − Repairs & maintenance
- −$2,659
- − Management
- −$2,659
- − Depreciation
- −$6,982
- Taxable income
- $1,759
- Est. tax owed @ 24.0%
- −$422
- After-tax cash flow
- $4,997/yr
For passive investors: Depreciation is non-cash, so a rental often shows a tax loss while cash-flowing — sheltering income. Rental losses are passive: they offset passive income freely, and up to $25,000/yr can offset ordinary (W-2) income if you actively participate and your MAGI is under $100k (phasing out to $0 by $150k); unused losses carry forward. On sale, claimed depreciation is recaptured at up to 25%, and gains may owe capital-gains tax (a 1031 exchange can defer both). Figures are a year-1 estimate at your 24.0% rate — not tax advice; consult a CPA.
Schools (NCES district)
- District
- Ithaca City School District
- NCES district ID
- 3615570
- Math proficiency
- 57% ▼ -5.00%
- Reading proficiency
- 71% ▲ 11.00%
- Median HH income
- $46,528
- Composite
- 54.01/100
- National rank
- #1397
- State rank
- #195 of 590 in NY
Livability — Ithaca
- Score
- 77/100
- State rank
- #210
- US rank
- #3240
Category grades
Schools grade is shown separately in the Schools card above.
Census & demographics
- Census place
- Ithaca, NY
- County
- Tompkins County · 68,610 people
- City population
- 68,610
- Metro
- Ithaca, NY
- Population (ZIP)
- 68,610
- Household income
- $71,445
- Rent vs Own
- Severe rent burden
- 5169.0
Population outlook (Tompkins County) Hauer SSP2
- Today (2025)
- 113,958 people
- By 2030
- 118,774 · +4.2%
- By 2040
- 125,927 · +10.5%
- By 2050
- 133,599 · +17.2%
- By 2075
- 156,759 · +37.6%
- By 2100
- 169,896 · +49.1%
Race, ethnicity, and origin ACS 2023
- Neighborhood character
- Predominantly White (68%)
- Race & ethnicity
- White 68% Asian 13% Hispanic / Latino 8% Two or more races 8% Black 4%
- Hispanic origin (detail)
- Mexican 2% Puerto Rican 2%
- Common ancestry
- Romanian 3% Italian 3% Scotch-Irish 2%
- Foreign-born
- 18% · China, Canada, South Korea
- Languages at home
- 79% English-only · Chinese 5% Spanish 4% Other Indo-European 4%
Political lean MEDSL · Tompkins
- 2024 margin
- Solid D (+50.6) · D 75.3% · R 24.7%
- 2008→2024 swing
- +8.6pp toward D · 2008: 42.1pp · 2024: 50.6pp
- All cycles
- 2024: D+50.6 2020: D+49.2 2016: D+42.1 2012: D+39.8 2008: D+42.1
Not yet ingested
- Civics
- —
Market trends
- HPI YoY
- ▼ -276.59%
- Current HPI
- 389.7215
- Rent YoY
- ▲ 5.22%
- Metro
- Ithaca, NY
- State GDP YoY
- ▲ 2.60%
- F500 in state
- 92
Industry mix (Fortune 500 HQ in NY)
| Industry | F500 HQs | Revenue |
|---|---|---|
| Financial Services | 10 | $950B |
|
||
| Consumer Goods | 9 | $162B |
|
||
| Insurance | 4 | $225B |
|
||
| Telecommunications | 2 | $144B |
|
||
| Pharmaceuticals | 2 | $112B |
|
||
| Media / Entertainment | 2 | $69B |
|
||
Price history
+401.0% since first listed11 events — show timeline
- 2026-05-12 Pending — IBRMLS
- 2026-03-13 Contingent — IBRMLS
- 2026-03-05 Listed $240,000 IBRMLS
- 2025-09-26 Contingent — IBRMLS
- 2025-08-26 Price Changed $240,000 IBRMLS
- 2025-08-08 Price Changed $245,000 IBRMLS
- 2025-07-28 Relisted — IBRMLS
- 2025-06-26 Listed $250,000 IBRMLS
- 2010-04-09 Sold (Public Records) $120,000 Public Records
- 2006-08-09 Sold (Public Records) $72,000 Public Records
- 2002-08-05 Sold (Public Records) $47,900 Public Records
Property tax history
+0.8%/yrLatest (2025): $4,535 · +3.4% YoY. Source: county tax records.
Cash-flow waterfall
monthlySold comps — $/sqft
last 12 mo · ≤1 miLoading sold comps…