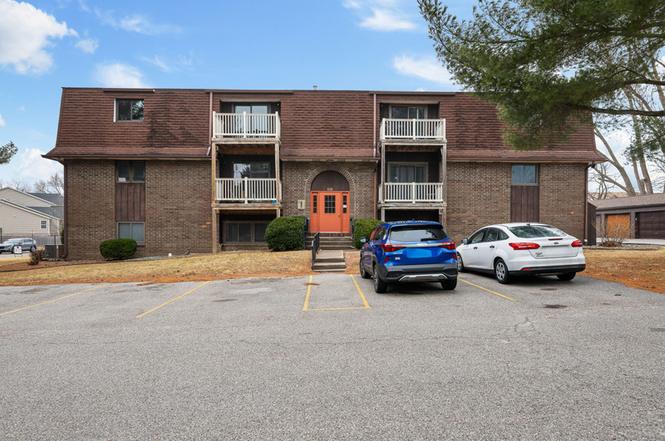
1211 48th Ave #27 · East Moline, IL
Flood risk 1/10 · Minimal
- FEMA flood zone
- X (unshaded)
- Chance of flooding over 30 yrs
- 0.0%
- Est. flood insurance / yr
- $507 – $1,088
Fire risk 1/10 · Minimal
- Est. fire insurance / yr
- $804 – $1,492
Heat risk 3/10 · Minor
- Hot days now (above 104°F)
- 7 days/yr
- Hot days in 30 yrs
- 17 days/yr
Wind risk 2/10 · Minimal
- Chance of severe wind over 30 yrs
- —
Air-quality risk 3/10 · Minor
- Unhealthy air days now
- 2 days/yr
- Unhealthy air days in 30 yrs
- 3 days/yr
Risk factors via First Street. Map © Google.
Why this score? — see what drove the D+ grade
The composite is a weighted blend of 9 inputs, each scored 0–100. Each bar is that input's sub-score; the figure is the points it added to the 100-point composite (weight × sub-score).
- Cash flow +17.2/30.0
- 1% rule +10.0/10.0
- ARV discount +7.5/15.0
- DSCR +5.4/10.0
- Livability +3.1/5.0
- Rent growth +2.5/5.0
- Condition / age +2.5/5.0
- Schools +1.2/10.0
- Appreciation +0.0/10.0
$65,000
🖨 Deal sheet 📄 Offer letter ✓ Due diligence
Listing remarks
Condo living cheaper than rent located in East Moline near John Deere Headquarters. The condo is on the lower level and features 2 bedrooms and 2 full bathrooms. It comes with a detached garage. HOA covers all water/sewer, gas/ele in common areas, lawn/snow and garbage.
Key facts
- Garage
- Built 1980
- Listed 17 days
Neighborhood map
What this means for you Summary
Snapshot
- This is a 2-bed/2.0-bath condo listed at $65k.
Deal economics
- At list price, monthly cash flow is $46 ($558/yr) — positive.
- The deal already cash-flows at list — no discount required.
- Meets the 1% rule at list price ($1k rent vs $65k).
- Recommended offer: $64k (1.5% below list) — sets the bar for market timing.
- Cap rate 7.2% vs local median 3.5% in East Moline — top-decile yield for the area; either an underpriced asset or a hidden risk that comps aren't pricing in. Stress-test before assuming the spread holds.
Location & tenants
- Location reads 62/100 on livability (#870 in IL) — a middle-class / working-renter tenant base. Strengths: cost of living A+, housing A+; Watch: crime C-, employment C-, schools F.
- United Twp Hsd 30 (suburban): math 12% / reading 15% proficiency, ranked #536 of 620 in IL (top 86%) — low school quality limits family demand, transient renter base, plan for 1-2y turnover.
- Market conditions: 124 active listings in the ZIP; 13 comparable units currently listed for rent nearby; rentals leasing fast (median 14d on market — plan ~1-2 weeks tenant-placement turnaround); 116 units permitted in Rock Island County in 2024 (50 in 5+ unit buildings).
Forward outlook
- Local home prices are declining (-3.0%/yr); year-one equity from $449 of loan paydown is wiped out by about $2k of value loss. Plan a longer hold.
- Rock Island County population projected at -12% by 2050 — secular population decline; favor cash flow + early exit over multi-decade hold.
Negotiation context
- It's been on market 17 days — a 2% lower offer ($64k) is reasonable based on typical stale-listing flexibility.
- 2 sale attempts; this cycle's ask has dropped $15k (19%) from the opening price — seller is motivated, your offer sets the floor, not the list.
Risks & watch-outs
- Watch-outs: property tax is 4.2% of price; HOA is 21% of rent.
Questions for the listing agent
- Property tax is high relative to price — has the assessment been appealed recently, and will the sale trigger a re-assessment?
- What does the HOA fee cover, when was the last increase, and are there any pending special assessments or reserve-fund shortfalls?
- Any open or pending special assessments — roof, HVAC, plumbing, elevator, façade? What's the per-unit balance and payoff schedule, and is the seller paying it off at close or rolling it to the buyer?
- Is there a deadline driving the sale (1031 exchange, divorce, estate, relocation)? That informs how much negotiation room exists.
- Schools are F-rated, which usually means shorter tenancies and higher turnover. Who's the typical renter profile here, and what's been the actual vacancy rate?
- The area grade is low — what's the realistic commute time and amenity access for the typical tenant pool here? Any planned neighborhood developments (good or bad) we should know about?
- What's the average days-on-market for RENTAL listings here right now (not sales)? A rising rental-DOM trend means longer vacancies and softer asking-rent achievability than the comps imply.
- What's the recent tenant-quality profile in this submarket — average credit score on applications, eviction rate, late-payment / NSF rate, and stable-employment percentage? A property-management company in the area should have these aggregated.
- How much new apartment / multifamily construction is in the pipeline within 1–3 miles? Heavy new supply (>2% of stock underway) typically softens rents 12–24 months out; light construction supports rent growth.
Investment metrics
- 1% rule
- 1.69% ✓
- Cap rate
- 7.15%
- Cash-on-cash
- 3.06%
- DSCR
- 1.14
- GRM
- 4.9
CMA / ARV
No comps found within radius.
Projected returns pro-forma
-3.0% appreciation · 3.0% rent growth · sell at horizon
- IRR
- -11.0%
- Equity multiple
- 0.60×
- Total profit
- $-7,329
- Equity at exit
- $9,692
- IRR
- -1.2%
- Equity multiple
- 0.91×
- Total profit
- $-1,581
- Equity at exit
- $5,620
Cash invested: $18,200 (down + closing). Projections, not guarantees.
Landlord ↔ Tenant lean methodology
- Overall (STATE)
- 43 Moderately Tenant-Leaning
- State Illinois
- 43 Moderately Tenant-Leaning · D+7
- County
- — inherits STATE
- City
- — inherits STATE
ZIP-level market 61244
- Active inventory
- 124
- Price-to-rent
- 4.9×
Monthly cashflow live
- Estimated rent
- $1,095 high interval (Pro) →
- Mortgage (P&I)
- −$341
- Tax from tax record
- −$226 /mo · $2,711/yr
- Insurance
- −$27
- HOA est. from 2 same-building comps
- −$225
- Vacancy / Maint / Mgmt
- −$230
- Net cashflow
- $46
Break-even live
UW: 25.0% down · 7.5% · 30yr · 1.5% tax · 5.0% vac · 8.0% maint · 8.0% mgmt
Financing live
Cash to close
- Down payment
- $16,250
- Closing costs
- $1,950
- Reserves months
- —
- Total cash needed
- —
Loan-product check · same deal, 3 products live
Conventional
25% down · 7.5% · 30yr
- Down + closing
- —
- Monthly P&I
- —
- Monthly cashflow
- —
- DSCR
- —
- Eligible?
- —
Personal DTI + credit; lowest rate.
DSCR
20% down · 8.5% · 30yr
- Down + closing
- —
- Monthly P&I
- —
- Monthly cashflow
- —
- DSCR
- —
- Eligible?
- —
No personal income docs; deal must DSCR.
Hard money
10% down · 12.0% · 12mo
- Down + closing
- —
- Monthly P&I
- —
- Monthly cashflow
- —
- DSCR
- —
- Eligible?
- —
Short-term bridge; refi at stabilization.
Rent comps 13 comps
| Address | Beds | Baths | Sqft | Rent | $/sqft | DOM | Units | Dist |
|---|---|---|---|---|---|---|---|---|
| 4700 7th St East Moline, IL | 1.0–2.0 | 1.0 | 704 | $1,222 | $1.73 | 13d | 15 | 0.47mi |
| 1111 Avenue Of The Cities Unit 4102-1A R East Moline, IL | 2.0 | 1.0 | 700 | $820 | $1.17 | 20d | 1 | 0.62mi |
| 4102 11th St Unit 1111-2D East Moline, IL | 2.0 | 1.0 | 700 | $820 | $1.17 | 20d | 1 | 0.63mi |
| 4102 11th St Unit 4106-1D R East Moline, IL | 2.0 | 1.0 | 700 | $880 | $1.26 | 20d | 1 | 0.63mi |
| 3500 70th St Moline, IL | 1.0–2.0 | 1.0 | 707 | $1,275 | $1.80 | 13d | 7 | 0.65mi |
| 4000 Archer Dr East Moline, IL | 2.0–3.0 | 1.0–1.5 | 933 | $1,195 | $1.28 | 13d | 2 | 0.73mi |
| 2101 7th St Silvis, IL | 3.0 | 1.0–2.5 | 905 | $1,655 | $1.83 | 13d | 17 | 0.96mi |
| 3532 60th St Apt 5 Moline, IL | 2.0 | 1.0 | 900 | $850 | $0.94 | 13d | 1 | 1.26mi |
| 3425 60th St Moline, IL | 1.0–2.0 | 1.0–1.5 | 937 | $1,260 | $1.34 | 13d | 6 | 1.31mi |
| 3341 5th St Unit 1 East Moline, IL | 2.0 | 1.0 | 850 | $1,300 | $1.53 | 20d | 1 | 1.35mi |
| 1810 14th St Silvis, IL | 3.0 | 1.0 | 1100 | $1,300 | $1.18 | 13d | 1 | 1.37mi |
| 3402 56th Street Pl Unit 4 Moline, IL | 2.0 | 1.0 | 800 | $1,350 | $1.69 | 20d | 1 | 1.39mi |
| 5511 34th Ave Fl apartment Moline, IL | 2.0 | 1.0 | 800 | $775 | $0.97 | 20d | 1 | 1.40mi |
HOA detail condo
- Monthly dues
- $0 · $0/yr
- Likely covers
- watersewertrashgas
- Assessments
- None detected in remarks — confirm with the listing agent.
Listing history 12 events
-
2026-03-28status Pending
-
2026-03-25price $65,000
-
2026-03-18price $74,000
-
2026-03-11$80,000 Active
-
2025-03-13historical $850
-
2025-01-07$850
-
2022-04-17price $850
-
2021-08-06historical
-
2007-07-13soldstatus $69,900
-
2005-07-01soldstatus $58,500
-
1999-02-16soldstatus $56,500
-
1998-06-02soldstatus $52,500
ⓘ Source: listings_history table (triggers on properties + properties_extension) + one-shot
backfill from property_details.listing_events for pre-trigger history.
Tax reassessment forecast IL · Partial reset (capped growth)
- Current annual tax
- $2,711 · $226/mo
- Projected year-2 tax
- $2,711 · $226/mo
- Expected delta
- $0/yr ($0/mo · 0.0%)
ⓘ Screening estimate from a state-policy table — verify with the county assessor before closing.
Climate risk First Street
- Flood 1/10 Low FEMA zone X (unshaded) · 0% chance over 30 yrs
- Wildfire 1/10 Low
- Heat 3/10 Moderate 7 d/yr ≥104°F today · 17 d/yr by 30 yrs out
- Wind 2/10 Low
- Air quality 3/10 Moderate 2 unhealthy d/yr today · 3 by 30 yrs out
Nearby sold comps map
Loading sold comps map…
Walkable amenities ~0.75 mi
Loading nearby amenities…
Taxation est. · year 1
- Rental income
- $13,144
- − Mortgage interest
- −$3,641
- − Property taxes
- −$2,711
- − Insurance
- −$325
- − Repairs & maintenance
- −$1,052
- − Management
- −$1,052
- − HOA
- −$2,700
- − Depreciation
- −$1,891
- Taxable loss
- −$227
- Est. tax savings @ 24.0%
- +$54
- After-tax cash flow
- $612/yr
For passive investors: Depreciation is non-cash, so a rental often shows a tax loss while cash-flowing — sheltering income. Rental losses are passive: they offset passive income freely, and up to $25,000/yr can offset ordinary (W-2) income if you actively participate and your MAGI is under $100k (phasing out to $0 by $150k); unused losses carry forward. On sale, claimed depreciation is recaptured at up to 25%, and gains may owe capital-gains tax (a 1031 exchange can defer both). Figures are a year-1 estimate at your 24.0% rate — not tax advice; consult a CPA.
Schools (NCES district)
- District
- United Twp Hsd 30
- NCES district ID
- 1739870
- Math proficiency
- 12% ▼ -5.00%
- Reading proficiency
- 15% ▼ -6.00%
- Median HH income
- $43,647
- Composite
- 11.91/100
- National rank
- #9670
- State rank
- #536 of 620 in IL
Livability — East Moline
- Score
- 62/100
- State rank
- #870
- US rank
- #16964
Category grades
Schools grade is shown separately in the Schools card above.
Census & demographics
- Census place
- East Moline, IL
- County
- Rock Island County · 103,822 people
- City population
- 23,308
- Metro
- Davenport-Moline-Rock Island, IA-IL
- Population (ZIP)
- 23,308
- Household income
- $63,819
- Rent vs Own
- Severe rent burden
- 746.0
Population outlook (Rock Island County) Hauer SSP2
- Today (2025)
- 140,982 people
- By 2030
- 137,705 · -2.3%
- By 2040
- 130,512 · -7.4%
- By 2050
- 123,841 · -12.2%
- By 2075
- 109,851 · -22.1%
- By 2100
- 90,922 · -35.5%
Race, ethnicity, and origin ACS 2023
- Neighborhood character
- Diverse neighborhood (Simpson 0.62)
- Race & ethnicity
- White 55% Hispanic / Latino 19% Black 18% Two or more races 9% Asian 3%
- Hispanic origin (detail)
- Mexican 17%
- Common ancestry
- English 3% Lithuanian 2% Romanian 2%
- Foreign-born
- 13% · Canada, United Kingdom, Philippines
- Languages at home
- 78% English-only · Spanish 12% French/Haitian/Cajun 3% Other Asian/Pacific 2%
Political lean MEDSL · Rock Island
- 2024 margin
- Lean D (+9.6) · D 53.9% · R 44.4% · Other 1.7%
- 2008→2024 swing
- -15.0pp toward R · 2008: 24.6pp · 2024: 9.6pp
- All cycles
- 2024: D+9.6 2020: D+12.1 2016: D+8.4 2012: D+21.9 2008: D+24.6
Not yet ingested
- Civics
- —
Market trends
- HPI YoY
- ▼ -108.05%
- Current HPI
- 154.4012
- Rent YoY
- —
- Metro
- Davenport-Moline-Rock Island, IA-IL
- State GDP YoY
- ▲ 1.59%
- F500 in state
- 60
Industry mix (Fortune 500 HQ in IL)
| Industry | F500 HQs | Revenue |
|---|---|---|
| Insurance | 4 | $201B |
|
||
| Consumer Goods | 4 | $87B |
|
||
| Industrial Machinery | 3 | $64B |
|
||
| Healthcare | 2 | $55B |
|
||
| Retail / Pharmacy | 1 | $148B |
|
||
| Agriculture / Food | 1 | $86B |
|
||
Price history
+23.8% since first listed12 events — show timeline
- 2026-03-28 Pending — MRED as Distributed by MLS Grid
- 2026-03-25 Price Changed $65,000 MRED as Distributed by MLS Grid
- 2026-03-18 Price Changed $74,000 MRED as Distributed by MLS Grid
- 2026-03-11 Listed $80,000 MRED as Distributed by MLS Grid
- 2025-03-13 Rental Removed $850 APPFOLIO
- 2025-01-07 Listed for Rent $850 APPFOLIO
- 2022-04-17 Price Changed $850 RENT.
- 2021-08-06 Listing Removed — RMLSA as Distributed by MLS Grid
- 2007-07-13 Sold (Public Records) $69,900 Public Records
- 2005-07-01 Sold (Public Records) $58,500 Public Records
- 1999-02-16 Sold (Public Records) $56,500 Public Records
- 1998-06-02 Sold (Public Records) $52,500 Public Records
Property tax history
+6.3%/yrLatest (2024): $2,711 · +5.9% YoY. Source: county tax records.
Cash-flow waterfall
monthlySold comps — $/sqft
last 12 mo · ≤1 miLoading sold comps…