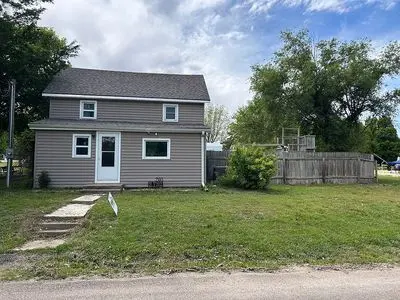
205 N Vine St · Glen Elder, KS
Flood risk 1/10 · Minimal
- FEMA flood zone
- X (unshaded)
- Chance of flooding over 30 yrs
- 0.0%
- Est. flood insurance / yr
- $507 – $1,088
Fire risk 3/10 · Minor
- Est. fire insurance / yr
- $1,154 – $2,142
Heat risk 4/10 · Minor
- Hot days now (above 105°F)
- 7 days/yr
- Hot days in 30 yrs
- 16 days/yr
Wind risk 2/10 · Minimal
- Chance of severe wind over 30 yrs
- —
Air-quality risk 2/10 · Minimal
- Unhealthy air days now
- 1 days/yr
- Unhealthy air days in 30 yrs
- 1 days/yr
Risk factors via First Street. Map © Google.
Why this score? — see what drove the D grade
The composite is a weighted blend of 9 inputs, each scored 0–100. Each bar is that input's sub-score; the figure is the points it added to the 100-point composite (weight × sub-score).
- Cash flow +11.4/30.0
- ARV discount +7.5/15.0
- Appreciation +4.7/10.0
- Schools +4.2/10.0
- DSCR +3.3/10.0
- 1% rule +3.2/10.0
- Livability +3.2/5.0
- Rent growth +2.5/5.0
- Condition / age +2.5/5.0
$129,000
🖨 Deal sheet (PDF) 📄 Offer letter ✓ Due diligence
Listing remarks MLS
Quiet neighborhood with a big corner lot. main bedroom and bathroom are on main floor. 2 bedrooms and a bathroom upstairs. Large kitchen and living room.
Key facts
- Living room
- Large kitchen
- Main floor
Tags
Neighborhood map
What this means for you Summary
Snapshot
- This is a 3-bed/2.0-bath single-family listed at $129k.
Deal economics
- At list price, monthly cash flow is $-46 ($-551/yr) — negative.
- To cash-flow at today's rent, offer at most $121k (6.3% below list).
- To meet the 1% rule (rent ≥ 1% of price), the offer needs to be $106k (17.9% below list).
- Recommended offer: $106k (17.9% below list) — sets the bar for 1% rule.
Location & tenants
- Location reads 63/100 on livability (#326 in KS) — a middle-class / working-renter tenant base. Strengths: cost of living A+, housing A+; Watch: health & safety D+, crime F, amenities F.
- Waconda (rural): math 45% / reading 50% proficiency, ranked #24 of 280 in KS (top 9%) — families likely to look elsewhere, expect single-tenant / working-renter base with shorter leases.
- Zoned schools: Lakeside Elementary (math 64% / reading 54%, grade B-, #70 of 684 statewide, top 12%, 159 students, 57% FRL); Lakeside Junior/Senior High School (math 27% / reading 37%, grade F, #50 of 327 statewide, top 16%, 134 students, 50% FRL) — zoned schools average 53% FRL vs 35% district-wide (18 pts higher); higher-poverty schools than district average — tighter screening recommended.
- Market conditions: 3 active listings in the ZIP.
Forward outlook
- In year one you build about $150 of equity ($892 loan paydown + $-742 appreciation (-0.6% local appreciation)).
- Mitchell County population projected to shrink 10% by 2050 — rents likely to lag national; underwrite the cash flow, not the appreciation.
Negotiation context
- It's been on market 26 days — a 2% lower offer ($127k) is reasonable based on typical stale-listing flexibility.
- Current owner paid $24k; list at $129k implies a 449% gain — meaningful room to come down on a strong offer.
Questions for the listing agent
- What do current leases actually rent for vs. the listed asking? Can we see a recent rent roll and the last 12 months of T-12 income?
- Is there a deadline driving the sale (1031 exchange, divorce, estate, relocation)? That informs how much negotiation room exists.
- Schools are D-rated, which usually means shorter tenancies and higher turnover. Who's the typical renter profile here, and what's been the actual vacancy rate?
- Crime grade is F in this area — have there been break-ins, vandalism, or insurance claims at this property in the last 3 years? What carrier currently insures it and at what premium?
- The area grade is low — what's the realistic commute time and amenity access for the typical tenant pool here? Any planned neighborhood developments (good or bad) we should know about?
- What's the average days-on-market for RENTAL listings here right now (not sales)? A rising rental-DOM trend means longer vacancies and softer asking-rent achievability than the comps imply.
- What's the recent tenant-quality profile in this submarket — average credit score on applications, eviction rate, late-payment / NSF rate, and stable-employment percentage? A property-management company in the area should have these aggregated.
- How much new for-sale + rental construction is in the pipeline within 1–3 miles? Heavy new supply typically softens prices + rents 12–24 months out; constrained supply supports both.
Investment metrics
- 1% rule
- 0.82% ✗
- Cap rate
- 5.87%
- Cash-on-cash
- -1.52%
- DSCR
- 0.93
- GRM
- 10.2
CMA / ARV
No comps found within radius.
Projected returns pro-forma
-0.57% appreciation · 3.0% rent growth · sell at horizon
- IRR
- -6.2%
- Equity multiple
- 0.72×
- Total profit
- $-10,132
- Equity at exit
- $33,792
- IRR
- 0.2%
- Equity multiple
- 1.02×
- Total profit
- $586
- Equity at exit
- $37,799
Cash invested: $36,120 (down + closing). Projections, not guarantees.
Landlord ↔ Tenant lean methodology
- Overall (STATE)
- 83 Strongly Landlord-Friendly
- State Kansas
- 83 Strongly Landlord-Friendly · R+10
- County
- — inherits STATE
- City
- — inherits STATE
ZIP-level market 67446
- Home prices YoY
- -0.4%
- Active inventory
- 3
- Price-to-rent
- 10.2×
Monthly cashflow live
- Estimated rent
- $1,059 medium interval (Pro) →
- Mortgage (P&I)
- −$676
- Tax from tax record
- −$152 /mo · $1,823/yr
- Insurance
- −$54
- HOA
- −$0
- Vacancy / Maint / Mgmt
- −$222
- Net cashflow
- $-46
Break-even live
Sensitivity live
| Price | -10% $27 | -5% $-9 | +0% $-46 | +5% $-82 | +10% $-119 |
|---|---|---|---|---|---|
| Rent | -10% $-130 | -5% $-88 | +0% $-46 | +5% $-4 | +10% $38 |
| Rate | -1.0pp $19 | -0.5pp $-13 | base $-46 | +0.5pp $-79 | +1.0pp $-113 |
UW: 25.0% down · 7.5% · 30yr · 1.5% tax · 5.0% vac · 8.0% maint · 8.0% mgmt
Financing live
Cash to close
- Down payment
- $32,250
- Closing costs
- $3,870
- Reserves months
- —
- Total cash needed
- —
Loan-product check · same deal, 3 products live
Conventional
25% down · 7.5% · 30yr
- Down + closing
- —
- Monthly P&I
- —
- Monthly cashflow
- —
- DSCR
- —
- Eligible?
- —
Personal DTI + credit; lowest rate.
DSCR
20% down · 8.5% · 30yr
- Down + closing
- —
- Monthly P&I
- —
- Monthly cashflow
- —
- DSCR
- —
- Eligible?
- —
No personal income docs; deal must DSCR.
Hard money
10% down · 12.0% · 12mo
- Down + closing
- —
- Monthly P&I
- —
- Monthly cashflow
- —
- DSCR
- —
- Eligible?
- —
Short-term bridge; refi at stabilization.
Listing history 20 events
-
2026-06-21days on market $129,000 Active 26 DOM
-
2026-06-21days on market $129,000 Active 25 DOM
-
2026-06-18days on market $129,000 Active 23 DOM
-
2026-06-17days on market $129,000 Active 22 DOM
-
2026-06-16days on market $129,000 Active 21 DOM
-
2026-06-15days on market $129,000 Active 20 DOM
-
2026-06-13days on market $129,000 Active 18 DOM
-
2026-06-12days on market $129,000 Active 17 DOM
-
2026-06-09days on market $129,000 Active 14 DOM
-
2026-06-08days on market $129,000 Active 13 DOM
-
2026-06-07days on market $129,000 Active 12 DOM
-
2026-06-05days on market $129,000 Active 10 DOM
-
2026-06-04days on market $129,000 Active 8 DOM
-
2026-06-02days on market $129,000 Active 7 DOM
-
2026-06-01days on market $129,000 Active 6 DOM
-
2026-05-31days on market $129,000 Active 5 DOM
-
2026-05-31days on market $129,000 Active 4 DOM
-
2026-05-26$129,000 Active 153-char remark
Show marketing remark (153 chars)
Quiet neighborhood with a big corner lot. main bedroom and bathroom are on main floor. 2 bedrooms and a bathroom upstairs. Large kitchen and living room.
-
2007-12-01soldstatus $23,500
-
1998-10-01soldstatus $26,500
ⓘ Source: listings_history table (triggers on properties + properties_extension) + one-shot
backfill from property_details.listing_events for pre-trigger history.
Tax reassessment forecast KS · Resets to sale price
- Current annual tax
- $1,823 · $152/mo
- Projected year-2 tax
- $1,823 · $152/mo
- Expected delta
- $0/yr ($0/mo · 0.0%)
ⓘ Screening estimate from a state-policy table — verify with the county assessor before closing.
Climate risk First Street
- Flood 1/10 Low FEMA zone X (unshaded) · 0% chance over 30 yrs
- Wildfire 3/10 Moderate
- Heat 4/10 Moderate 7 d/yr ≥105°F today · 16 d/yr by 30 yrs out
- Wind 2/10 Low
- Air quality 2/10 Low 1 unhealthy d/yr today · 1 by 30 yrs out
Nearby sold comps map
Loading sold comps map…
Walkable amenities ~0.75 mi
Loading nearby amenities…
Taxation est. · year 1
- Rental income
- $12,703
- − Mortgage interest
- −$7,226
- − Property taxes
- −$1,823
- − Insurance
- −$645
- − Repairs & maintenance
- −$1,016
- − Management
- −$1,016
- − Depreciation
- −$3,753
- Taxable loss
- −$2,776
- Est. tax savings @ 24.0%
- +$666
- After-tax cash flow
- $116/yr
For passive investors: Depreciation is non-cash, so a rental often shows a tax loss while cash-flowing — sheltering income. Rental losses are passive: they offset passive income freely, and up to $25,000/yr can offset ordinary (W-2) income if you actively participate and your MAGI is under $100k (phasing out to $0 by $150k); unused losses carry forward. On sale, claimed depreciation is recaptured at up to 25%, and gains may owe capital-gains tax (a 1031 exchange can defer both). Figures are a year-1 estimate at your 24.0% rate — not tax advice; consult a CPA.
Schools (NCES district)
- District
- Waconda
- NCES district ID
- 2004470
- Math proficiency
- 45% ▼ -5.00%
- Reading proficiency
- 50% ▲ 5.00%
- Median HH income
- $42,790
- Composite
- 42.13/100
- National rank
- #7031
- State rank
- #24 of 280 in KS
Livability — Glen Elder
- Score
- 63/100
- State rank
- #326
- US rank
- #14937
Category grades
Schools grade is shown separately in the Schools card above.
Census & demographics
- Census place
- Glen Elder, KS
- Population (ZIP)
- 678
Population outlook (Mitchell County) Hauer SSP2
- Today (2025)
- 6,057 people
- By 2030
- 5,919 · -2.3%
- By 2040
- 5,671 · -6.4%
- By 2050
- 5,473 · -9.6%
- By 2075
- 5,733 · -5.3%
- By 2100
- 5,368 · -11.4%
Race, ethnicity, and origin ACS 2023
- Neighborhood character
- Predominantly White (90%)
- Race & ethnicity
- White 90% Two or more races 10%
- Common ancestry
- Italian 5% Slovak 1% Romanian 1%
- Foreign-born
- 0%
Political lean MEDSL · Mitchell
- 2024 margin
- Solid R (+65.6) · D 16.6% · R 82.2% · Other 1.1%
- 2008→2024 swing
- -11.3pp toward R · 2008: -54.3pp · 2024: -65.6pp
- All cycles
- 2024: R+65.6 2020: R+62.8 2016: R+61.9 2012: R+58.7 2008: R+54.3
Not yet ingested
- Civics
- —
Market trends
- HPI YoY
- ▼ -0.57%
- Current HPI
- 157.7428
- Rent YoY
- —
- Metro
- —
- State GDP YoY
- —
- F500 in state
- 0
Price history
+386.8% since first listed3 events — show timeline
- 2026-05-26 Listed $129,000 FSBO.com
- 2007-12-01 Sold (Public Records) $23,500 Public Records
- 1998-10-01 Sold (Public Records) $26,500 Public Records
Property tax history
+10.3%/yrLatest (2025): $1,823 · +5.5% YoY. Source: county tax records.
Cash-flow waterfall
monthlySold comps — $/sqft
last 12 mo · ≤1 miLoading sold comps…