 🏷️ Likely Rental
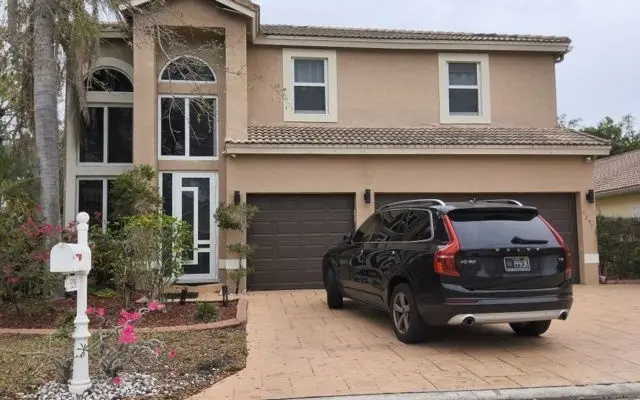
5291 NW 113th Ave · Coral Springs, FL
Flood risk 1/10 · Minimal
- FEMA flood zone
- X (shaded)
- Chance of flooding over 30 yrs
- 0.0%
- Est. flood insurance / yr
- $507 – $1,088
Fire risk 4/10 · Minor
- Est. fire insurance / yr
- $947 – $1,759
Heat risk 9/10 · Severe
- Hot days now (above 107°F)
- 7 days/yr
- Hot days in 30 yrs
- 24 days/yr
Wind risk 10/10 · Severe
- Chance of severe wind over 30 yrs
- 99.0%
Air-quality risk 2/10 · Minimal
- Unhealthy air days now
- 2 days/yr
- Unhealthy air days in 30 yrs
- 2 days/yr
Risk factors via First Street. Map © Google.
Why this score? — see what drove the D+ grade
The composite is a weighted blend of 9 inputs, each scored 0–100. Each bar is that input's sub-score; the figure is the points it added to the 100-point composite (weight × sub-score).
- Cash flow +15.0/30.0
- ARV discount +7.5/15.0
- 1% rule +5.0/10.0
- DSCR +5.0/10.0
- Schools +4.1/10.0
- Livability +4.0/5.0
- Rent growth +2.7/5.0
- Condition / age +2.5/5.0
- Appreciation +0.0/10.0
$5,000
🖨 Deal sheet (PDF) 📄 Offer letter ✓ Due diligence
Listing remarks MLS
FANTASTIC LARGE 5 BEDROOM 3 BATH POOL HOME WITH 3 CAR GARAGE IN KENSINGTON! LARGE OPEN FLOOR PLAN, SOARING CEILINGS, HUGE KITCHEN WITH GRANITE COUNTERTOPS, TILE FLOORING THROUGHOUT LIVING AREAS, LARGE YARD WITH SCREENED IN PATIO AND BEAUTIFUL POOL AND SPA ! GREAT CORAL SPRINGS COMMUNITY CLOSE TO A RATED SCHOOLS, SHOPPING, AND HIGHWAYS! HURRY DON'T MISS THIS OPPORTUNITY!!
Key facts
- Garage
- Built 1995
- Listed 8 days
Property features AI
Finance
- Other: Directions: From Sawgrass Expy, go north on Coral Ridge Dr, left on NW 54th Ct, then right on NW 113th Ave.
- Financial info:
- HOA & community:
Exterior
- Parking: Attached or detached garage with 1-car capacity
- Security:
- Utilities:
- Home design: Residential property; 2 stories
- Construction:
- Exterior features: Lot zoned RM-20
Interior
- Kitchen:
- Bedrooms:
- Flooring:
- Bathrooms: Three full bathrooms; One half bathroom
- Heating & cooling:
- Interior features: Two-story residence
- Laundry & utility:
Neighborhood map
What this means for you Summary
Snapshot
- This is a 5-bed/3.0-bath single-family listed at $5k.
Deal economics
- At list price, monthly cash flow is $5k ($60k/yr) — positive.
- The deal already cash-flows at list — no discount required.
- Meets the 1% rule at list price ($6k rent vs $5k).
- Cap rate 1203.9% vs local median 3.6% in Coral Springs — top-decile yield for the area; either an underpriced asset or a hidden risk that comps aren't pricing in. Stress-test before assuming the spread holds.
Location & tenants
- Location reads 79/100 on livability (#145 in FL, #2,163 nationally) — a middle-class / working-renter tenant base. Strengths: housing A+, health & safety A+, crime A; Watch: amenities F, cost of living F.
- Broward (suburban): math 42% / reading 53% proficiency, ranked #46 of 73 in FL (top 63%) — families likely to look elsewhere, expect single-tenant / working-renter base with shorter leases.
- Zoned schools: Eagle Ridge Elementary School (math 60% / reading 70%, grade B+, #514 of 2,144 statewide, top 24%, 839 students, 32% FRL); Nova Middle School (math 44% / reading 53%, grade C-, #274 of 571 statewide, top 50%, 1,284 students, 68% FRL); Marjory Stoneman Douglas High School (math 54% / reading 65%, grade C+, #109 of 667 statewide, top 17%, 3,504 students, 24% FRL).
- Market conditions: Rents flat; 301 active listings in the ZIP; 18 comparable units currently listed for rent nearby; rentals at typical pace (median 17d on market — plan ~3-4 weeks tenant-placement turnaround); high-income renter base; 2,111 units permitted in Broward County in 2024 (1,265 in 5+ unit buildings).
- This rent runs 43% of the median local income ($177k/yr) — at the standard rent-burdened threshold; future hikes will face affordability resistance.
Forward outlook
- Local home prices are declining (-3.0%/yr); year-one equity from $35 of loan paydown is wiped out by about $150 of value loss. Plan a longer hold.
- Broward County population projected at +34% by 2050 — long-run rental-demand tailwind backs the buy-and-hold thesis.
- At projected returns (-3.0% appreciation + 0.6% rent growth), your $1k cash investment doubles in ~1 year — after that, you're playing with house money.
Negotiation context
- Only 8 days on market — expect competitive offers; lowballing is unlikely to land.
- 2 sale attempts since 14y ago with the ask held roughly flat each time — persistent listings suggest the price (not the market) is what's stuck; bring a comps-based counter.
Risks & watch-outs
- Climate carrying-cost: severe wind risk, 99% chance of damaging wind over 30y; extreme-heat days projected 7→24/yr by 2055 (HVAC capex compounding) — expect insurance premiums to compound above CPI over the hold.
Questions for the listing agent
- Is there a deadline driving the sale (1031 exchange, divorce, estate, relocation)? That informs how much negotiation room exists.
- Schools are A-rated — typically a magnet for longer-tenancy family renters. What's the average tenant stay here, and is there a school-zone premium baked into asking?
- The area grade is low — what's the realistic commute time and amenity access for the typical tenant pool here? Any planned neighborhood developments (good or bad) we should know about?
- What's the average days-on-market for RENTAL listings here right now (not sales)? A rising rental-DOM trend means longer vacancies and softer asking-rent achievability than the comps imply.
- What's the recent tenant-quality profile in this submarket — average credit score on applications, eviction rate, late-payment / NSF rate, and stable-employment percentage? A property-management company in the area should have these aggregated.
- How much new for-sale + rental construction is in the pipeline within 1–3 miles? Heavy new supply typically softens prices + rents 12–24 months out; constrained supply supports both.
Investment metrics
- 1% rule
- 127.21% ✓
- Cap rate
- 1203.91%
- Cash-on-cash
- 4277.19%
- DSCR
- 191.31
- GRM
- 0.1
CMA / ARV
- ARV (on-the-fly)
- $937,650
- Comps found
- 6
Show comp detail 6 sales within ~0.75 mi
| Address | Dist | Beds/Ba | Sqft | Sold | Price | $/sf | Match |
|---|---|---|---|---|---|---|---|
| 5260 NW 112th Way | 0.04mi | 5/3.5 | 2,828 (-14%) | 2mo | $805,000 | $285 | 71 |
| 5340 NW 103rd Way | 0.74mi | 5/3.0 | 3,064 (-7%) | 2mo | $895,000 | $292 | 53 |
| 10922 NW 49th Dr | 0.50mi | 5/3.0 | 2,858 (-13%) | 5mo | $905,000 | $317 | 51 |
| 5037 NW 119th Ter | 0.48mi | 6/4.5 (+1) | 3,652 (+11%) | 4mo | $1,040,000 | $285 | 45 |
| 4713 NW 115th Ave | 0.53mi | 4/2.5 (-1) | 2,847 (-14%) | 5mo | $645,000 | $227 | 42 |
| 11828 NW 53rd Ct | 0.51mi | 4/3.0 (-1) | 2,856 (-13%) | 21mo | $805,000 | $282 | 32 |
Match score weights: distance 35% · size 25% · config 20% · recency 20%. Top-matched comps best support the ARV.
Projected returns pro-forma
-3.0% appreciation · 0.62% rent growth · sell at horizon
- IRR
- —
- Equity multiple
- 216.88×
- Total profit
- $302,227
- Equity at exit
- $746
- IRR
- —
- Equity multiple
- 440.00×
- Total profit
- $614,600
- Equity at exit
- $432
Cash invested: $1,400 (down + closing). Projections, not guarantees.
Landlord ↔ Tenant lean methodology
- Overall (STATE)
- 87 Strongly Landlord-Friendly
- State Florida
- 87 Strongly Landlord-Friendly · R+3
- County
- — inherits STATE
- City
- — inherits STATE
ZIP-level market 33076
- Home prices YoY
- -4.3%
- Rents YoY
- 0.6%
- Active inventory
- 301
- Price-to-rent
- 0.1×
Monthly cashflow live
- Estimated rent
- $6,360 high interval (Pro) →
- Mortgage (P&I)
- −$26
- Tax est. 1.5%
- −$6 /mo · $75/yr
- Insurance
- −$2
- HOA
- −$0
- Vacancy / Maint / Mgmt
- −$1,336
- Net cashflow
- $4,990
Break-even live
Sensitivity live
| Price | -10% $4,994 | -5% $4,992 | +0% $4,990 | +5% $4,988 | +10% $4,987 |
|---|---|---|---|---|---|
| Rent | -10% $4,488 | -5% $4,739 | +0% $4,990 | +5% $5,241 | +10% $5,493 |
| Rate | -1.0pp $4,993 | -0.5pp $4,991 | base $4,990 | +0.5pp $4,989 | +1.0pp $4,987 |
UW: 25.0% down · 7.5% · 30yr · 1.5% tax · 5.0% vac · 8.0% maint · 8.0% mgmt
Financing live
Cash to close
- Down payment
- $1,250
- Closing costs
- $150
- Reserves months
- —
- Total cash needed
- —
Loan-product check · same deal, 3 products live
Conventional
25% down · 7.5% · 30yr
- Down + closing
- —
- Monthly P&I
- —
- Monthly cashflow
- —
- DSCR
- —
- Eligible?
- —
Personal DTI + credit; lowest rate.
DSCR
20% down · 8.5% · 30yr
- Down + closing
- —
- Monthly P&I
- —
- Monthly cashflow
- —
- DSCR
- —
- Eligible?
- —
No personal income docs; deal must DSCR.
Hard money
10% down · 12.0% · 12mo
- Down + closing
- —
- Monthly P&I
- —
- Monthly cashflow
- —
- DSCR
- —
- Eligible?
- —
Short-term bridge; refi at stabilization.
Rent comps 18 comps
| Address | Beds | Baths | Sqft | Rent | $/sqft | DOM | Units | Dist |
|---|---|---|---|---|---|---|---|---|
| 5285 NW 112th Ter Coral Springs, FL | 5.0 | 3.0 | 2828 | $6,500 | $2.30 | 3d | 1 | 0.09mi |
| 4729 NW 115th Ave Coral Springs, FL | 4.0 | 2.5 | 3103 | $4,110 | $1.32 | 1d | 1 | 0.55mi |
| 4915 NW 105th Dr Coral Springs, FL | 5.0 | 3.0 | 3215 | $6,700 | $2.08 | 26d | 1 | 0.76mi |
| 5885 NW 121st Ter Coral Springs, FL | 4.0 | 2.5 | 2611 | $4,600 | $1.76 | 14d | 1 | 0.84mi |
| 10425 NW 48th Mnr Coral Springs, FL | 4.0 | 2.0 | 2285 | $5,400 | $2.36 | 26d | 1 | 0.84mi |
| 12349 NW 53rd St Coral Springs, FL | 4.0 | 2.5 | 2582 | $4,700 | $1.82 | 9d | 1 | 0.87mi |
| 10635 NW 61st Ct Parkland, FL | 5.0 | 3.0 | 2670 | $5,800 | $2.17 | 26d | 1 | 0.92mi |
| 10442 NW 60th Pl Parkland, FL | 4.0 | 3.5 | 3352 | $5,500 | $1.64 | 26d | 1 | 0.97mi |
| 6355 NW 107th Ter Parkland, FL | 5.0 | 3.0 | 2686 | $6,000 | $2.23 | 26d | 1 | 0.97mi |
| 10290 NW 60th Pl Parkland, FL | 4.0 | 3.5 | 3272 | $6,500 | $1.99 | 26d | 1 | 1.05mi |
| 10290 NW 60th Pl Parkland, FL | 4.0 | 3.5 | 3272 | $7,500 | $2.29 | 17d | 1 | 1.05mi |
| 10290 NW 60th Pl Parkland, FL | 5.0 | 3.5 | 3272 | $7,500 | $2.29 | 16d | 1 | 1.05mi |
| 10290 NW 60th Pl Parkland, FL | 4.0 | 3.5 | 3272 | $7,500 | $2.29 | 7d | 1 | 1.05mi |
| 5865 NW 125th Ave Coral Springs, FL | 5.0 | 3.0 | 2521 | $6,750 | $2.68 | 26d | 1 | 1.18mi |
| 10251 NW 62nd Dr Unit 10251 Parkland, FL | 4.0 | 3.0 | 2734 | $7,500 | $2.74 | 6d | 1 | 1.19mi |
| 10251 NW 62nd Dr Parkland, FL | 4.0 | 3.0 | 2734 | $7,000 | $2.56 | 6d | 1 | 1.19mi |
| 5165 NW 99th Way Coral Springs, FL | 4.0 | 2.5 | 2931 | $2,496 | $0.85 | 14d | 1 | 1.32mi |
| 6740 NW 105th Ln Parkland, FL | 5.0 | 3.5 | 3025 | $5,950 | $1.97 | 26d | 1 | 1.32mi |
Listing history 5 events
-
2026-06-16days on market $5,000 Active 8 DOM
-
2026-06-15days on market $5,000 Active 7 DOM
-
2026-06-13days on market $5,000 Active 5 DOM
-
2026-06-08remarks 315-char remark
-
2026-06-08$5,000 Active 1 DOM
ⓘ Source: listings_history table (triggers on properties + properties_extension) + one-shot
backfill from property_details.listing_events for pre-trigger history.
Climate risk First Street
- Flood 1/10 Low FEMA zone X (shaded) · 0% chance over 30 yrs
- Wildfire 4/10 Moderate
- Heat 9/10 Extreme 7 d/yr ≥107°F today · 24 d/yr by 30 yrs out
- Wind 10/10 Extreme 99% chance of damaging wind over 30 yrs
- Air quality 2/10 Low 2 unhealthy d/yr today · 2 by 30 yrs out
Nearby sold comps map
Loading sold comps map…
Walkable amenities ~0.75 mi
Loading nearby amenities…
Taxation est. · year 1
- Rental income
- $76,323
- − Mortgage interest
- −$280
- − Property taxes
- −$75
- − Insurance
- −$25
- − Repairs & maintenance
- −$6,106
- − Management
- −$6,106
- − Depreciation
- −$145
- Taxable income
- $63,586
- Est. tax owed @ 24.0%
- −$15,261
- After-tax cash flow
- $44,620/yr
For passive investors: Depreciation is non-cash, so a rental often shows a tax loss while cash-flowing — sheltering income. Rental losses are passive: they offset passive income freely, and up to $25,000/yr can offset ordinary (W-2) income if you actively participate and your MAGI is under $100k (phasing out to $0 by $150k); unused losses carry forward. On sale, claimed depreciation is recaptured at up to 25%, and gains may owe capital-gains tax (a 1031 exchange can defer both). Figures are a year-1 estimate at your 24.0% rate — not tax advice; consult a CPA.
Schools (NCES district)
- District
- Broward
- NCES district ID
- 1200180
- Math proficiency
- 42% ▼ -18.00%
- Reading proficiency
- 53% ▼ -5.00%
- Median HH income
- $52,139
- Composite
- 40.88/100
- National rank
- #3621
- State rank
- #46 of 73 in FL
Livability — Coral Springs
- Score
- 79/100
- State rank
- #145
- US rank
- #2163
Category grades
Schools grade is shown separately in the Schools card above.
Census & demographics
- Census place
- Coral Springs, FL
- County
- Broward County · 1,963,430 people
- City population
- 101,171
- Metro
- Miami-Fort Lauderdale-Pompano Beach, FL
- Population (ZIP)
- 44,922
- Household income
- $176,641
- Rent vs Own
- Severe rent burden
- 649.0
Population outlook (Broward County) Hauer SSP2
- Today (2025)
- 2,207,033 people
- By 2030
- 2,360,704 · +7.0%
- By 2040
- 2,661,208 · +20.6%
- By 2050
- 2,946,698 · +33.5%
- By 2075
- 3,602,273 · +63.2%
- By 2100
- 3,970,984 · +79.9%
Race, ethnicity, and origin ACS 2023
- Neighborhood character
- Diverse neighborhood (Simpson 0.69)
- Race & ethnicity
- White 50% Hispanic / Latino 18% Black 15% Two or more races 14% Asian 10%
- Hispanic origin (detail)
- Mexican 2% Puerto Rican 4% Cuban 2%
- Common ancestry
- Romanian 5% Scotch-Irish 3% Lithuanian 2%
- Foreign-born
- 24% · Canada, Jamaica, China
- Languages at home
- 74% English-only · Spanish 14% Other Indo-European 5% French/Haitian/Cajun 2%
Political lean MEDSL · Broward
- 2024 margin
- D (+17.0) · D 58.0% · R 41.0%
- 2008→2024 swing
- -17.8pp toward R · 2008: 34.7pp · 2024: 17.0pp
- All cycles
- 2024: D+17.0 2020: D+29.8 2016: D+35.0 2012: D+34.9 2008: D+34.7
Not yet ingested
- Civics
- —
Market trends
- HPI YoY
- ▼ -13.44%
- Current HPI
- 301.5665
- Rent YoY
- ▲ 0.62%
- Metro
- Miami-Fort Lauderdale-Pompano Beach, FL
- State GDP YoY
- ▲ 3.28%
- F500 in state
- 36
Industry mix (Fortune 500 HQ in FL)
| Industry | F500 HQs | Revenue |
|---|---|---|
| Industrial Technology | 2 | $29B |
|
||
| Insurance | 2 | $17B |
|
||
| Retail | 1 | $60B |
|
||
| Technology Distribution | 1 | $58B |
|
||
| Homebuilding | 1 | $35B |
|
||
| Technology Manufacturing | 1 | $35B |
|
||
Price history
-98.0% since first listed7 events — show timeline
- 2026-06-08 Listed $5,000 NFMLS
- 2016-11-21 Sold (Public Records) $420,000 Public Records
- 2016-03-11 Sold (Public Records) $420,000 Public Records
- 2012-08-29 Sold (MLS) $312,000 MARMLS
- 2012-05-24 Listed $309,900 MARMLS
- 2000-02-23 Sold (Public Records) $270,000 Public Records
- 1995-11-02 Sold (Public Records) $250,800 Public Records
Property tax history
+8.1%/yrLatest (2025): $20,336 · +5.4% YoY. Source: county tax records.
Cash-flow waterfall
monthlySold comps — $/sqft
last 12 mo · ≤1 miLoading sold comps…