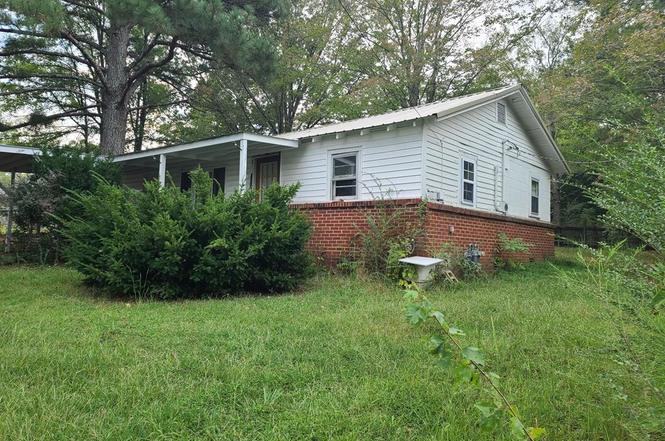
111 Easy St · Big Sandy, TN
Flood risk 5/10 · Moderate
- FEMA flood zone
- X (unshaded)
- Chance of flooding over 30 yrs
- 0.24%
- Est. flood insurance / yr
- $507 – $1,088
Fire risk 5/10 · Moderate
- Est. fire insurance / yr
- $949 – $1,763
Heat risk 5/10 · Moderate
- Hot days now (above 109°F)
- 7 days/yr
- Hot days in 30 yrs
- 20 days/yr
Wind risk 4/10 · Minor
- Chance of severe wind over 30 yrs
- 12.0%
Air-quality risk 1/10 · Minimal
- Unhealthy air days now
- 0 days/yr
- Unhealthy air days in 30 yrs
- 0 days/yr
Risk factors via First Street. Map © Google.
Why this score? — see what drove the B+ grade
The composite is a weighted blend of 9 inputs, each scored 0–100. Each bar is that input's sub-score; the figure is the points it added to the 100-point composite (weight × sub-score).
- Cash flow +30.0/30.0
- 1% rule +10.0/10.0
- DSCR +10.0/10.0
- Appreciation +8.0/10.0
- ARV discount +7.5/15.0
- Livability +2.9/5.0
- Rent growth +2.5/5.0
- Condition / age +2.5/5.0
- Schools +2.4/10.0
$55,000
🖨 Deal sheet (PDF) 📄 Offer letter ✓ Due diligence
Listing remarks
Property has new survey, newer roof, block foundation - dwelling needs repair, selling as is making no repairs- same owner has acreage and house a distance from this property in which there is a driveway easement leading from Easy Street to the property located behind 111 Easy Street property. Seller not accepting any government financing for buyer's purchase. All measurements are estimated. Listing data provided by seller.
Key facts
- 7,405 sq ft lot
- Garage
- Built 1969
Property features AI
Exterior
- Parking: 1 total parking space; Attached carport (1 covered/carport space); Open parking; Asphalt surface
- Utilities: Public water; Public sewer; Cable available
- Home design: Single-family residence; One story
- Construction: Block and vinyl siding construction; Metal roof
- Exterior features: Chain link fence; City lot; Chip-and-seal road access
Interior
- Kitchen: No appliances listed
- Bedrooms: 2 bedrooms on the main level
- Flooring: Wood flooring
- Bathrooms: 1 full bathroom (main level)
- Heating & cooling: No heating or cooling listed
- Interior features: Entrance foyer; Crawl space basement
- Laundry & utility: Laundry on the main level
Neighborhood map
What this means for you Summary
Snapshot
- This is a 2-bed/1.0-bath single-family listed at $55k.
Deal economics
- At list price, monthly cash flow is $339 ($4k/yr) — positive.
- The deal already cash-flows at list — no discount required.
- Meets the 1% rule at list price ($873 rent vs $55k).
- Recommended offer: $48k (12.0% below list) — sets the bar for market timing.
Location & tenants
- Location reads 58/100 on livability (#315 in TN) — a working-class tenant base; expect higher turnover. Strengths: cost of living A+, housing A-; Watch: crime F, amenities F, commute F.
- Benton County (town): math 31% / reading 28% proficiency, ranked #66 of 139 in TN (top 48%) — low school quality limits family demand, transient renter base, plan for 1-2y turnover.
- Zoned schools: Camden Jr High School (math 37% / reading 23%, grade F, #98 of 333 statewide, top 32%, 371 students, 0% FRL); Camden Central High School (math 8% / reading 37%, grade F, #156 of 332 statewide, top 49%, 521 students, 0% FRL) — zoned schools average 0% FRL vs 54% district-wide (54 pts lower); this property's tenant base skews higher-income than the district average.
- Market conditions: 93 active listings in the ZIP; 6 units permitted in Benton County in 2024 (0 in 5+ unit buildings).
Forward outlook
- In year one you build about $4k of equity ($380 loan paydown + $3k appreciation (6.0% local appreciation)).
- Benton County population projected at -18% by 2050 — secular population decline; favor cash flow + early exit over multi-decade hold.
- At projected returns (6.0% appreciation + 3.0% rent growth), your $15k cash investment doubles in ~2 years — after that, you're playing with house money.
- By year 9, paydown + projected appreciation supports a ~$33k cash-out refi (75% LTV) — recoverable capital for the next deal without selling this one.
Negotiation context
- It's been on market 256 days — a 12% lower offer ($48k) is reasonable based on typical stale-listing flexibility.
- 2 sale attempts with the ask held roughly flat each time — persistent listings suggest the price (not the market) is what's stuck; bring a comps-based counter.
- Current owner paid $18k; list at $55k implies a 210% gain — meaningful room to come down on a strong offer.
Risks & watch-outs
- Climate carrying-cost: moderate flood risk; moderate wildfire risk; extreme-heat days projected 7→20/yr by 2055 (HVAC capex compounding) — expect insurance premiums to compound above CPI over the hold.
Questions for the listing agent
- It's been on market 256 days. Have you received any prior offers? Is the seller open to a 12% concession, seller financing, or rate buy-down credit?
- Built in 1969 — when were the roof, HVAC, electrical panel, plumbing, and water heater last replaced?
- Why hasn't it sold? Are there any deal-killer items the seller is aware of (foundation, flood, title, zoning, code violations)?
- Is there a deadline driving the sale (1031 exchange, divorce, estate, relocation)? That informs how much negotiation room exists.
- Schools are F-rated, which usually means shorter tenancies and higher turnover. Who's the typical renter profile here, and what's been the actual vacancy rate?
- Crime grade is F in this area — have there been break-ins, vandalism, or insurance claims at this property in the last 3 years? What carrier currently insures it and at what premium?
- What's the average days-on-market for RENTAL listings here right now (not sales)? A rising rental-DOM trend means longer vacancies and softer asking-rent achievability than the comps imply.
- What's the recent tenant-quality profile in this submarket — average credit score on applications, eviction rate, late-payment / NSF rate, and stable-employment percentage? A property-management company in the area should have these aggregated.
- How much new for-sale + rental construction is in the pipeline within 1–3 miles? Heavy new supply typically softens prices + rents 12–24 months out; constrained supply supports both.
Investment metrics
- 1% rule
- 1.59% ✓
- Cap rate
- 13.69%
- Cash-on-cash
- 26.41%
- DSCR
- 2.17
- GRM
- 5.2
CMA / ARV
No comps found within radius.
Projected returns pro-forma
5.97% appreciation · 3.0% rent growth · sell at horizon
- IRR
- 37.6%
- Equity multiple
- 3.42×
- Total profit
- $37,343
- Equity at exit
- $34,453
- IRR
- 35.0%
- Equity multiple
- 7.04×
- Total profit
- $92,963
- Equity at exit
- $62,374
Cash invested: $15,400 (down + closing). Projections, not guarantees.
Landlord ↔ Tenant lean methodology
- Overall (STATE)
- 87 Strongly Landlord-Friendly
- State Tennessee
- 87 Strongly Landlord-Friendly · R+13
- County
- — inherits STATE
- City
- — inherits STATE
ZIP-level market 38221
- Home prices YoY
- 2.7%
- Active inventory
- 93
- Price-to-rent
- 5.2×
Monthly cashflow live
- Estimated rent
- $873 medium interval (Pro) →
- Mortgage (P&I)
- −$288
- Tax from tax record
- −$40 /mo · $478/yr
- Insurance
- −$23
- HOA
- −$0
- Vacancy / Maint / Mgmt
- −$183
- Net cashflow
- $339
Break-even live
Sensitivity live
| Price | -10% $370 | -5% $354 | +0% $339 | +5% $323 | +10% $308 |
|---|---|---|---|---|---|
| Rent | -10% $270 | -5% $304 | +0% $339 | +5% $373 | +10% $408 |
| Rate | -1.0pp $367 | -0.5pp $353 | base $339 | +0.5pp $325 | +1.0pp $310 |
UW: 25.0% down · 7.5% · 30yr · 1.5% tax · 5.0% vac · 8.0% maint · 8.0% mgmt
Financing live
Cash to close
- Down payment
- $13,750
- Closing costs
- $1,650
- Reserves months
- —
- Total cash needed
- —
Loan-product check · same deal, 3 products live
Conventional
25% down · 7.5% · 30yr
- Down + closing
- —
- Monthly P&I
- —
- Monthly cashflow
- —
- DSCR
- —
- Eligible?
- —
Personal DTI + credit; lowest rate.
DSCR
20% down · 8.5% · 30yr
- Down + closing
- —
- Monthly P&I
- —
- Monthly cashflow
- —
- DSCR
- —
- Eligible?
- —
No personal income docs; deal must DSCR.
Hard money
10% down · 12.0% · 12mo
- Down + closing
- —
- Monthly P&I
- —
- Monthly cashflow
- —
- DSCR
- —
- Eligible?
- —
Short-term bridge; refi at stabilization.
Listing history 19 events
-
2026-06-21days on market $55,000 Active 256 DOM
-
2026-06-18days on market $55,000 Active 254 DOM
-
2026-06-17days on market $55,000 Active 253 DOM
-
2026-06-16days on market $55,000 Active 252 DOM
-
2026-06-15days on market $55,000 Active 251 DOM
-
2026-06-13days on market $55,000 Active 249 DOM
-
2026-06-12days on market $55,000 Active 248 DOM
-
2026-06-09days on market $55,000 Active 245 DOM
-
2026-06-08days on market $55,000 Active 244 DOM
-
2026-06-08days on market $55,000 Active 243 DOM
-
2026-06-07days on market $55,000 Active 242 DOM
-
2026-06-04days on market $55,000 Active 239 DOM
-
2026-06-02days on market $55,000 Active 238 DOM
-
2026-06-01days on market $55,000 Active 237 DOM
-
2026-05-31days on market $55,000 Active 236 DOM
-
2026-03-18status Active
-
2026-03-05status Pending
-
2025-09-24$55,000 Active
-
2002-10-03soldstatus $17,750
ⓘ Source: listings_history table (triggers on properties + properties_extension) + one-shot
backfill from property_details.listing_events for pre-trigger history.
Tax reassessment forecast TN · Resets to sale price
- Current annual tax
- $478 · $40/mo
- Projected year-2 tax
- $478 · $40/mo
- Expected delta
- $0/yr ($0/mo · -0.0%)
ⓘ Screening estimate from a state-policy table — verify with the county assessor before closing.
Climate risk First Street
- Flood 5/10 Major FEMA zone X (unshaded) · 24% chance over 30 yrs
- Wildfire 5/10 Major
- Heat 5/10 Major 7 d/yr ≥109°F today · 20 d/yr by 30 yrs out
- Wind 4/10 Moderate 12% chance of damaging wind over 30 yrs
- Air quality 1/10 Low 0 unhealthy d/yr today · 0 by 30 yrs out
Nearby sold comps map
Loading sold comps map…
Walkable amenities ~0.75 mi
Loading nearby amenities…
Taxation est. · year 1
- Rental income
- $10,482
- − Mortgage interest
- −$3,081
- − Property taxes
- −$478
- − Insurance
- −$275
- − Repairs & maintenance
- −$839
- − Management
- −$839
- − Depreciation
- −$1,600
- Taxable income
- $3,371
- Est. tax owed @ 24.0%
- −$809
- After-tax cash flow
- $3,257/yr
For passive investors: Depreciation is non-cash, so a rental often shows a tax loss while cash-flowing — sheltering income. Rental losses are passive: they offset passive income freely, and up to $25,000/yr can offset ordinary (W-2) income if you actively participate and your MAGI is under $100k (phasing out to $0 by $150k); unused losses carry forward. On sale, claimed depreciation is recaptured at up to 25%, and gains may owe capital-gains tax (a 1031 exchange can defer both). Figures are a year-1 estimate at your 24.0% rate — not tax advice; consult a CPA.
Schools (NCES district)
- District
- Benton County
- NCES district ID
- 4700240
- Math proficiency
- 31% ▼ -8.00%
- Reading proficiency
- 28% ▼ -7.00%
- Median HH income
- $33,587
- Composite
- 24.24/100
- National rank
- #7722
- State rank
- #66 of 139 in TN
Livability — Big Sandy
- Score
- 58/100
- State rank
- #315
- US rank
- #21412
Category grades
Schools grade is shown separately in the Schools card above.
Census & demographics
- Census place
- Big Sandy, TN
- Population (ZIP)
- 3,046
Population outlook (Benton County) Hauer SSP2
- Today (2025)
- 15,046 people
- By 2030
- 14,425 · -4.1%
- By 2040
- 13,296 · -11.6%
- By 2050
- 12,298 · -18.3%
- By 2075
- 10,347 · -31.2%
- By 2100
- 8,594 · -42.9%
Race, ethnicity, and origin ACS 2023
- Neighborhood character
- Predominantly White (96%)
- Race & ethnicity
- White 96% Two or more races 2% Hispanic / Latino 2%
- Common ancestry
- Slovak 2% Lithuanian 2% Serbian 1%
- Foreign-born
- 1% · Canada
- Languages at home
- 98% English-only · German/W. Germanic 1% Russian/Polish/Slavic 1%
Political lean MEDSL · Benton
- 2024 margin
- Solid R (+62.9) · D 18.1% · R 81.1%
- 2008→2024 swing
- -46.7pp toward R · 2008: -16.2pp · 2024: -62.9pp
- All cycles
- 2024: R+62.9 2020: R+57.0 2016: R+51.3 2012: R+25.6 2008: R+16.2
Not yet ingested
- Civics
- —
Market trends
- HPI YoY
- ▲ 5.97%
- Current HPI
- 230.2855
- Rent YoY
- —
- Metro
- —
- State GDP YoY
- ▲ 2.78%
- F500 in state
- 22
Industry mix (Fortune 500 HQ in TN)
| Industry | F500 HQs | Revenue |
|---|---|---|
| Healthcare | 3 | $91B |
|
||
| Retail | 3 | $72B |
|
||
| Transportation / Logistics | 1 | $88B |
|
||
| Paper / Packaging | 1 | $19B |
|
||
| Insurance | 1 | $13B |
|
||
| Energy | 1 | $12B |
|
||
Price history
+209.9% since first listed4 events — show timeline
- 2026-03-18 Relisted — TVAR
- 2026-03-05 Pending — TVAR
- 2025-09-24 Listed $55,000 TVAR
- 2002-10-03 Sold (Public Records) $17,750 Public Records
Property tax history
+7.8%/yrLatest (2025): $478 · +66.6% YoY. Source: county tax records.
Cash-flow waterfall
monthlySold comps — $/sqft
last 12 mo · ≤1 miLoading sold comps…