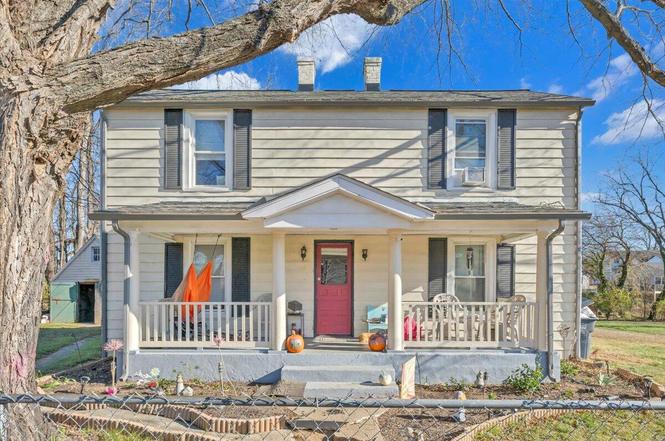
1315/1319 Liberty Rd NE · Roanoke, VA
Flood risk 1/10 · Minimal
- FEMA flood zone
- X (shaded)
- Chance of flooding over 30 yrs
- 0.0%
- Est. flood insurance / yr
- $507 – $1,088
Fire risk 3/10 · Minor
- Est. fire insurance / yr
- $666 – $1,236
Heat risk 5/10 · Moderate
- Hot days now (above 101°F)
- 7 days/yr
- Hot days in 30 yrs
- 17 days/yr
Wind risk 2/10 · Minimal
- Chance of severe wind over 30 yrs
- 1.0%
Air-quality risk 2/10 · Minimal
- Unhealthy air days now
- 1 days/yr
- Unhealthy air days in 30 yrs
- 1 days/yr
Risk factors via First Street. Map © Google.
Why this score? — see what drove the C+ grade
The composite is a weighted blend of 9 inputs, each scored 0–100. Each bar is that input's sub-score; the figure is the points it added to the 100-point composite (weight × sub-score).
- Cash flow +25.6/30.0
- DSCR +8.5/10.0
- ARV discount +7.5/15.0
- 1% rule +5.4/10.0
- Rent growth +5.0/5.0
- Schools +4.1/10.0
- Livability +3.7/5.0
- Condition / age +2.5/5.0
- Appreciation +0.0/10.0
$169,850
🖨 Deal sheet (PDF) 📄 Offer letter ✓ Due diligence
Listing remarks
TWO LOTS!! Welcome to this adorable two-story home nestled at the end of a quiet street, offering the perfect blend of charm, privacy, and potential. Situated on a spacious piece of land and sold with an additional lot, this property provides endless opportunities--expand, garden, build, or simply enjoy the extra space for yourself. Inside, you'll find three comfortable bedrooms including a convenient entry-level bedroom, ideal for main-level living or hosting guests. The home features a bright, open kitchen with an adjoining dining area, creating a warm and functional space for meals and gatherings. Outside, the possibilities continue with a large garage perfect for storage, a workshop, or
Key facts
- Quiet street
- Large garage
- Additional lot
Tags
Neighborhood map
What this means for you Summary
Snapshot
- This is a 3-bed/1.0-bath land listed at $170k.
Deal economics
- At list price, monthly cash flow is $401 ($5k/yr) — positive.
- The deal already cash-flows at list — no discount required.
- Meets the 1% rule at list price ($2k rent vs $170k).
- Recommended offer: $149k (12.0% below list) — sets the bar for market timing.
- Cap rate 9.1% vs local median 4.2% in Roanoke — top-decile yield for the area; either an underpriced asset or a hidden risk that comps aren't pricing in. Stress-test before assuming the spread holds.
Location & tenants
- Location reads 73/100 on livability (#163 in VA) — a middle-class / working-renter tenant base. Strengths: cost of living A+, health & safety A+, housing A; Watch: amenities C-, employment D, crime F.
- Roanoke City Public School District (urban): math 40% / reading 58% proficiency, ranked #102 of 131 in VA (top 78%) — families likely to look elsewhere, expect single-tenant / working-renter base with shorter leases; 67% free/reduced lunch — lower-income household profile, screen leases tightly.
- Zoned schools: Monterey Elementary (math 47% / reading 54%, grade D+, #737 of 1,108 statewide, top 67%, 490 students, 100% FRL); William Fleming High (math 66% / reading 68%, grade B, #185 of 319 statewide, top 61%, 1,911 students, 96% FRL) — zoned schools average 98% FRL vs 67% district-wide (31 pts higher); higher-poverty schools than district average — tighter screening recommended.
- Market conditions: Rents rising fast (+10.5%/yr); 194 active listings in the ZIP; 7 comparable units currently listed for rent nearby; rentals at typical pace (median 14d on market — plan ~3-4 weeks tenant-placement turnaround); 43% of comp listings sitting > 30 days — soft ceiling on asking rent; 113 units permitted in Roanoke city in 2024 (0 in 5+ unit buildings).
- This rent runs 40% of the median local income ($53k/yr) — at the standard rent-burdened threshold; future hikes will face affordability resistance.
Forward outlook
- Local home prices are declining (-3.0%/yr); year-one equity from $1k of loan paydown is wiped out by about $5k of value loss. Plan a longer hold.
- Roanoke County population projected at +11% by 2050 — modest demand growth; plan on rents tracking national, not racing it.
- At projected returns (-3.0% appreciation + 8.0% rent growth), your $48k cash investment doubles in ~8 years — after that, you're playing with house money.
Negotiation context
- It's been on market 134 days — a 12% lower offer ($149k) is reasonable based on typical stale-listing flexibility.
- 2 sale attempts; this cycle's ask is 579% above the opening price — seller raised mid-cycle; expect resistance to lowballs.
Risks & watch-outs
- Watch-outs: built in 1935 — expect roof / HVAC / electrical / plumbing capex.
- Climate carrying-cost: extreme-heat days projected 7→17/yr by 2055 (HVAC capex compounding) — expect insurance premiums to compound above CPI over the hold.
Questions for the listing agent
- It's been on market 134 days. Have you received any prior offers? Is the seller open to a 12% concession, seller financing, or rate buy-down credit?
- Built in 1935 — when were the roof, HVAC, electrical panel, plumbing, and water heater last replaced?
- Why hasn't it sold? Are there any deal-killer items the seller is aware of (foundation, flood, title, zoning, code violations)?
- Is there a deadline driving the sale (1031 exchange, divorce, estate, relocation)? That informs how much negotiation room exists.
- Schools are A-rated — typically a magnet for longer-tenancy family renters. What's the average tenant stay here, and is there a school-zone premium baked into asking?
- Crime grade is F in this area — have there been break-ins, vandalism, or insurance claims at this property in the last 3 years? What carrier currently insures it and at what premium?
- What's the average days-on-market for RENTAL listings here right now (not sales)? A rising rental-DOM trend means longer vacancies and softer asking-rent achievability than the comps imply.
- What's the recent tenant-quality profile in this submarket — average credit score on applications, eviction rate, late-payment / NSF rate, and stable-employment percentage? A property-management company in the area should have these aggregated.
- How much new for-sale + rental construction is in the pipeline within 1–3 miles? Heavy new supply typically softens prices + rents 12–24 months out; constrained supply supports both.
Investment metrics
- 1% rule
- 1.04% ✓
- Cap rate
- 9.13%
- Cash-on-cash
- 10.12%
- DSCR
- 1.45
- GRM
- 8.0
CMA / ARV
No comps found within radius.
Projected returns pro-forma
-3.0% appreciation · 8.0% rent growth · sell at horizon
- IRR
- 3.8%
- Equity multiple
- 1.15×
- Total profit
- $7,294
- Equity at exit
- $25,325
- IRR
- 17.2%
- Equity multiple
- 2.71×
- Total profit
- $81,462
- Equity at exit
- $14,686
Cash invested: $47,558 (down + closing). Projections, not guarantees.
Landlord ↔ Tenant lean methodology
- Overall (STATE)
- 55 Moderately Landlord-Leaning
- State Virginia
- 55 Moderately Landlord-Leaning · D+2
- County
- — inherits STATE
- City
- — inherits STATE
ZIP-level market 24012
- Rents YoY
- 10.5%
- Active inventory
- 194
- Price-to-rent
- 8.0×
Monthly cashflow live
- Estimated rent
- $1,769 high interval (Pro) →
- Mortgage (P&I)
- −$891
- Tax from tax record
- −$35 /mo · $416/yr
- Insurance
- −$71
- HOA
- −$0
- Vacancy / Maint / Mgmt
- −$371
- Net cashflow
- $401
Break-even live
Sensitivity live
| Price | -10% $497 | -5% $449 | +0% $401 | +5% $353 | +10% $305 |
|---|---|---|---|---|---|
| Rent | -10% $261 | -5% $331 | +0% $401 | +5% $471 | +10% $541 |
| Rate | -1.0pp $487 | -0.5pp $444 | base $401 | +0.5pp $357 | +1.0pp $312 |
UW: 25.0% down · 7.5% · 30yr · 1.5% tax · 5.0% vac · 8.0% maint · 8.0% mgmt
Financing live
Cash to close
- Down payment
- $42,462
- Closing costs
- $5,096
- Reserves months
- —
- Total cash needed
- —
Loan-product check · same deal, 3 products live
Conventional
25% down · 7.5% · 30yr
- Down + closing
- —
- Monthly P&I
- —
- Monthly cashflow
- —
- DSCR
- —
- Eligible?
- —
Personal DTI + credit; lowest rate.
DSCR
20% down · 8.5% · 30yr
- Down + closing
- —
- Monthly P&I
- —
- Monthly cashflow
- —
- DSCR
- —
- Eligible?
- —
No personal income docs; deal must DSCR.
Hard money
10% down · 12.0% · 12mo
- Down + closing
- —
- Monthly P&I
- —
- Monthly cashflow
- —
- DSCR
- —
- Eligible?
- —
Short-term bridge; refi at stabilization.
Rent comps 7 comps
| Address | Beds | Baths | Sqft | Rent | $/sqft | DOM | Units | Dist |
|---|---|---|---|---|---|---|---|---|
| 2109 Colgate St NE Roanoke, VA | 3.0 | 1.0 | 1240 | $1,700 | $1.37 | 14d | 1 | 0.78mi |
| 3323 Collingwood St NE Roanoke, VA | 3.0 | 2.0 | 1200 | $2,150 | $1.79 | 44d | 1 | 0.84mi |
| 3843 Plantation Rd NE Roanoke, VA | 2.0 | 1.0 | 1870 | $1,500 | $0.80 | 44d | 1 | 0.87mi |
| 3816 Plantation Rd NE Roanoke, VA | 2.0 | 2.0 | 1267 | $1,700 | $1.34 | 44d | 1 | 0.87mi |
| 4532 Tacoma Ave NE Roanoke, VA | 3.0 | 1.0 | 1092 | $1,550 | $1.42 | 14d | 1 | 1.16mi |
| 3006 Hickory Woods Dr NE Roanoke, VA | 1.0–3.0 | 1.0–2.0 | 922 | $1,890 | $2.05 | 14d | 20 | 1.40mi |
| 1515 Dunbar St NW Roanoke, VA | 3.0 | 2.0 | 1058 | $1,623 | $1.53 | 14d | 1 | 1.47mi |
Listing history 20 events
-
2026-04-01status Pending
-
2026-04-01historical
-
2026-03-26price $169,850
-
2026-03-12price $169,875
-
2026-03-06price $169,900
-
2026-03-05price $179,875
-
2026-02-23price $179,900
-
2026-02-19price $185,425
-
2026-02-12price $185,450
-
2026-02-05price $185,475
-
2026-01-26price $20,000
-
2026-01-26price $185,500
-
2026-01-22price $192,375
-
2026-01-13price $192,400
-
2026-01-08price $194,900
-
2025-12-18price $194,925
-
2025-12-11price $194,950
-
2025-12-08$25,000 Active
-
2025-12-04price $194,975
-
2025-11-18$195,000 Active
ⓘ Source: listings_history table (triggers on properties + properties_extension) + one-shot
backfill from property_details.listing_events for pre-trigger history.
Tax reassessment forecast VA · Resets to sale price
- Current annual tax
- $416 · $35/mo
- Projected year-2 tax
- $1,393 · $116/mo
- Expected delta
- +$977/yr (+$81/mo · 235.2%)
ⓘ Screening estimate from a state-policy table — verify with the county assessor before closing.
Climate risk First Street
- Flood 1/10 Low FEMA zone X (shaded) · 0% chance over 30 yrs
- Wildfire 3/10 Moderate
- Heat 5/10 Major 7 d/yr ≥101°F today · 17 d/yr by 30 yrs out
- Wind 2/10 Low 100% chance of damaging wind over 30 yrs
- Air quality 2/10 Low 1 unhealthy d/yr today · 1 by 30 yrs out
Nearby sold comps map
Loading sold comps map…
Walkable amenities ~0.75 mi
Loading nearby amenities…
Taxation est. · year 1
- Rental income
- $21,225
- − Mortgage interest
- −$9,514
- − Property taxes
- −$416
- − Insurance
- −$849
- − Repairs & maintenance
- −$1,698
- − Management
- −$1,698
- − Depreciation
- −$4,941
- Taxable income
- $2,109
- Est. tax owed @ 24.0%
- −$506
- After-tax cash flow
- $4,308/yr
For passive investors: Depreciation is non-cash, so a rental often shows a tax loss while cash-flowing — sheltering income. Rental losses are passive: they offset passive income freely, and up to $25,000/yr can offset ordinary (W-2) income if you actively participate and your MAGI is under $100k (phasing out to $0 by $150k); unused losses carry forward. On sale, claimed depreciation is recaptured at up to 25%, and gains may owe capital-gains tax (a 1031 exchange can defer both). Figures are a year-1 estimate at your 24.0% rate — not tax advice; consult a CPA.
Schools (NCES district)
- District
- Roanoke City Public School District
- NCES district ID
- 5103300
- Math proficiency
- 40% ▼ -38.00%
- Reading proficiency
- 58% ▼ -12.00%
- Median HH income
- $38,592
- Composite
- 40.8/100
- National rank
- #3639
- State rank
- #102 of 131 in VA
Livability — Roanoke
- Score
- 73/100
- State rank
- #163
- US rank
- #5055
Category grades
Schools grade is shown separately in the Schools card above.
Census & demographics
- Census place
- Roanoke, VA
- County
- Roanoke City · 101,625 people
- City population
- 168,930
- Metro
- Roanoke, VA
- Population (ZIP)
- 28,235
- Household income
- $52,973
- Rent vs Own
- Severe rent burden
- 1360.0
Population outlook (Roanoke County) Hauer SSP2
- Today (2025)
- 106,094 people
- By 2030
- 108,927 · +2.7%
- By 2040
- 114,104 · +7.5%
- By 2050
- 118,032 · +11.3%
- By 2075
- 123,363 · +16.3%
- By 2100
- 116,827 · +10.1%
Race, ethnicity, and origin ACS 2023
- Neighborhood character
- Diverse neighborhood (Simpson 0.59)
- Race & ethnicity
- White 60% Black 16% Hispanic / Latino 14% Two or more races 13% Asian 4%
- Hispanic origin (detail)
- Mexican 4% Dominican 1%
- Common ancestry
- Romanian 2% Slovak 2% Serbian 1%
- Foreign-born
- 11% · Canada, Vietnam, Jamaica
- Languages at home
- 84% English-only · Spanish 11% Other Asian/Pacific 2% Vietnamese 2%
Political lean MEDSL · Roanoke
- 2024 margin
- Strong D (+23.6) · D 61.1% · R 37.5% · Other 1.4%
- 2008→2024 swing
- +0.2pp no change · 2008: 23.4pp · 2024: 23.6pp
- All cycles
- 2024: D+23.6 2020: D+25.8 2016: D+17.6 2012: D+21.5 2008: D+23.4
Not yet ingested
- Civics
- —
Market trends
- HPI YoY
- ▼ -137.94%
- Current HPI
- 186.9007
- Rent YoY
- ▲ 10.46%
- Metro
- Roanoke, VA
- State GDP YoY
- ▲ 2.40%
- F500 in state
- 50
Industry mix (Fortune 500 HQ in VA)
| Industry | F500 HQs | Revenue |
|---|---|---|
| Aerospace / Defense | 4 | $236B |
|
||
| Technology / Defense | 3 | $32B |
|
||
| Financial Services | 2 | $176B |
|
||
| Utilities | 2 | $27B |
|
||
| Insurance | 2 | $25B |
|
||
| Technology | 2 | $15B |
|
||
Price history
-12.9% since first listed20 events — show timeline
- 2026-04-01 Pending — MLSRV
- 2026-04-01 Listing Removed — MLSRV
- 2026-03-26 Price Changed $169,850 MLSRV
- 2026-03-12 Price Changed $169,875 MLSRV
- 2026-03-06 Price Changed $169,900 MLSRV
- 2026-03-05 Price Changed $179,875 MLSRV
- 2026-02-23 Price Changed $179,900 MLSRV
- 2026-02-19 Price Changed $185,425 MLSRV
- 2026-02-12 Price Changed $185,450 MLSRV
- 2026-02-05 Price Changed $185,475 MLSRV
- 2026-01-26 Price Changed $20,000 MLSRV
- 2026-01-26 Price Changed $185,500 MLSRV
- 2026-01-22 Price Changed $192,375 MLSRV
- 2026-01-13 Price Changed $192,400 MLSRV
- 2026-01-08 Price Changed $194,900 MLSRV
- 2025-12-18 Price Changed $194,925 MLSRV
- 2025-12-11 Price Changed $194,950 MLSRV
- 2025-12-08 Listed $25,000 MLSRV
- 2025-12-04 Price Changed $194,975 MLSRV
- 2025-11-18 Listed $195,000 MLSRV
Property tax history
+17.0%/yrLatest (2025): $416 · +50.7% YoY. Source: county tax records.
Cash-flow waterfall
monthlySold comps — $/sqft
last 12 mo · ≤1 miLoading sold comps…