 Duplex
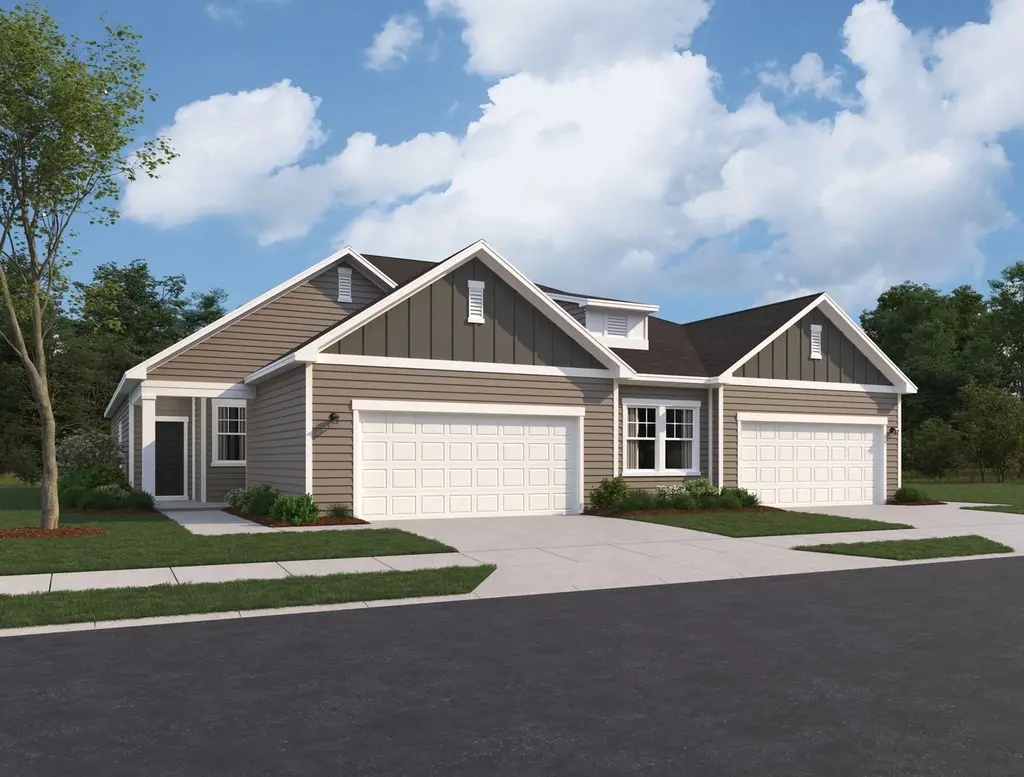
855 Hanford Landing Dr · Graham, NC
Flood risk 1/10 · Minimal
- FEMA flood zone
- X (unshaded)
- Chance of flooding over 30 yrs
- 0.0%
- Est. flood insurance / yr
- $507 – $1,088
Fire risk 3/10 · Minor
- Est. fire insurance / yr
- $906 – $1,684
Heat risk 5/10 · Moderate
- Hot days now (above 104°F)
- 7 days/yr
- Hot days in 30 yrs
- 15 days/yr
Wind risk 5/10 · Moderate
- Chance of severe wind over 30 yrs
- 22.0%
Air-quality risk 2/10 · Minimal
- Unhealthy air days now
- 1 days/yr
- Unhealthy air days in 30 yrs
- 1 days/yr
Risk factors via First Street. Map © Google.
Why this score? — see what drove the D grade
The composite is a weighted blend of 9 inputs, each scored 0–100. Each bar is that input's sub-score; the figure is the points it added to the 100-point composite (weight × sub-score).
- Cash flow +13.4/30.0
- ARV discount +7.5/15.0
- DSCR +4.1/10.0
- Condition / age +4.0/5.0
- 1% rule +3.9/10.0
- Livability +3.5/5.0
- Schools +3.0/10.0
- Rent growth +2.5/5.0
- Appreciation +0.0/10.0
$304,990
🖨 Deal sheet (PDF) 📄 Offer letter ✓ Due diligence
Listing remarks
Welcome to 855 Hanford Landing Drive. A thoughtfully designed duplex that offers comfort, functionality, and a seamless flow throughout each home. From the front porch, you enter into the foyer and pass two secondary bedrooms that share a full bath, along with a conveniently located laundry room. As you continue through the home, the layout opens into a spacious dining area, kitchen, and living room, creating a central space for gathering and everyday living. The kitchen features a pantry and easy access to the main living area, while a covered patio just off the living room extends your space outdoors. Tucked privately at the back of the home, the primary bedroom includes a walk-in closet
Key facts
- 4,922 sq ft lot
- 2 garage spots
- Built 2026
Property features AI
Finance
- Other: Living area: 1,455
- Financial info: List price: $304,990
Exterior
- Parking: 2 parking spaces
- Utilities: Electric service; Central air; Heat pump
- Home design: Spec new construction — Plan: Clay; Single-story (living area listed)
Interior
- Kitchen: Dishwasher; Disposal; Microwave
- Bedrooms: 3 bedrooms
- Bathrooms: 2 bathrooms
- Heating & cooling: Electric heating with heat pump; Central air conditioning
- Interior features: Dishwasher; Disposal; Microwave
Neighborhood map
What this means for you Summary
Snapshot
- This is a 2 × 3-bed/2.0-bath units multifamily listed at $305k. Condition is rated good.
Deal economics
- At list price, monthly cash flow is $8 ($98/yr) — positive. Per door: $4/mo.
- The deal already cash-flows at list — no discount required.
- To meet the 1% rule (rent ≥ 1% of price), the offer needs to be $273k (10.5% below list).
- Recommended offer: $273k (10.5% below list) — sets the bar for 1% rule.
- Cap rate 6.3% vs local median 3.3% in Graham — top-decile yield for the area; either an underpriced asset or a hidden risk that comps aren't pricing in. Stress-test before assuming the spread holds.
Location & tenants
- Location reads 69/100 on livability (#144 in NC) — a middle-class / working-renter tenant base. Strengths: cost of living A+, housing A+, health & safety A+; Watch: crime C-, schools D-, amenities F.
- Alamance-Burlington Schools (rural): math 30% / reading 40% proficiency, ranked #133 of 178 in NC (top 75%) — families likely to look elsewhere, expect single-tenant / working-renter base with shorter leases.
- Market conditions: 400 active listings in the ZIP; 2,466 units permitted in Alamance County in 2024 (403 in 5+ unit buildings).
- At $2,729/mo this rent would consume 52% of the median local household income ($63k/yr) (locally 879% of renters already pay >50% of income on rent) — very limited rent-growth headroom before tenants either downsize or default.
Forward outlook
- Local home prices are declining (-3.0%/yr); year-one equity from $2k of loan paydown is wiped out by about $9k of value loss. Plan a longer hold.
- Alamance County population projected at +19% by 2050 — long-run rental-demand tailwind backs the buy-and-hold thesis.
Negotiation context
- It's been on market 15 days — a 2% lower offer ($300k) is reasonable based on typical stale-listing flexibility.
Risks & watch-outs
- Climate carrying-cost: moderate wind risk, 22% chance of damaging wind over 30y; extreme-heat days projected 7→15/yr by 2055 (HVAC capex compounding) — expect insurance premiums to compound above CPI over the hold.
Questions for the listing agent
- Can we see the unit-by-unit rent roll, current vacancy, and any below-market leases? What's the average tenancy length?
- What capital expenditures (roof, boiler, parking lot, exteriors) have been made in the last 5 years, and what's planned in the next 2?
- What does the HOA fee cover, when was the last increase, and are there any pending special assessments or reserve-fund shortfalls?
- Is there a deadline driving the sale (1031 exchange, divorce, estate, relocation)? That informs how much negotiation room exists.
- Schools are D-rated, which usually means shorter tenancies and higher turnover. Who's the typical renter profile here, and what's been the actual vacancy rate?
- The area grade is low — what's the realistic commute time and amenity access for the typical tenant pool here? Any planned neighborhood developments (good or bad) we should know about?
- What's the average days-on-market for RENTAL listings here right now (not sales)? A rising rental-DOM trend means longer vacancies and softer asking-rent achievability than the comps imply.
- What's the recent tenant-quality profile in this submarket — average credit score on applications, eviction rate, late-payment / NSF rate, and stable-employment percentage? A property-management company in the area should have these aggregated.
- How much new apartment / multifamily construction is in the pipeline within 1–3 miles? Heavy new supply (>2% of stock underway) typically softens rents 12–24 months out; light construction supports rent growth.
Investment metrics
- 1% rule
- 0.89% ✗
- Cap rate
- 6.33%
- Cash-on-cash
- 0.12%
- DSCR
- 1.01
- GRM
- 9.3
CMA / ARV
No comps found within radius.
Projected returns pro-forma
-3.0% appreciation · 3.0% rent growth · sell at horizon
- IRR
- -16.1%
- Equity multiple
- 0.43×
- Total profit
- $-48,834
- Equity at exit
- $45,475
- IRR
- -7.7%
- Equity multiple
- 0.51×
- Total profit
- $-41,585
- Equity at exit
- $26,370
Cash invested: $85,397 (down + closing). Projections, not guarantees.
Landlord ↔ Tenant lean methodology
- Overall (STATE)
- 85 Strongly Landlord-Friendly
- State North Carolina
- 85 Strongly Landlord-Friendly · R+3
- County
- — inherits STATE
- City
- — inherits STATE
ZIP-level market 27253
- Home prices YoY
- -34.2%
- Active inventory
- 400
- Price-to-rent
- 18.6×
Monthly cashflow live
- Estimated rent
- $2,729 medium interval (Pro) →
- Mortgage (P&I)
- −$1,599
- Tax est. 1.5%
- −$381 /mo · $4,575/yr
- Insurance
- −$127
- HOA
- −$40
- Vacancy / Maint / Mgmt
- −$573
- Net cashflow
- $8
Break-even live
Sensitivity live
| Price | -10% $219 | -5% $114 | +0% $8 | +5% $-97 | +10% $-203 |
|---|---|---|---|---|---|
| Rent | -10% $-207 | -5% $-100 | +0% $8 | +5% $116 | +10% $224 |
| Rate | -1.0pp $162 | -0.5pp $86 | base $8 | +0.5pp $-71 | +1.0pp $-151 |
2-unit breakdown (identical units grouped — click to expand)
| Units | Beds | Baths | Est. rent |
|---|---|---|---|
| 2× units | 3 | 2 | $2,728 |
| #1 | 3 | 2 | $1,364 |
| #2 | 3 | 2 | $1,364 |
| Total (2 units) | $2,729 | ||
UW: 25.0% down · 7.5% · 30yr · 1.5% tax · 5.0% vac · 8.0% maint · 8.0% mgmt
Financing live
Cash to close
- Down payment
- $76,248
- Closing costs
- $9,150
- Reserves months
- —
- Total cash needed
- —
Loan-product check · same deal, 3 products live
Conventional
25% down · 7.5% · 30yr
- Down + closing
- —
- Monthly P&I
- —
- Monthly cashflow
- —
- DSCR
- —
- Eligible?
- —
Personal DTI + credit; lowest rate.
DSCR
20% down · 8.5% · 30yr
- Down + closing
- —
- Monthly P&I
- —
- Monthly cashflow
- —
- DSCR
- —
- Eligible?
- —
No personal income docs; deal must DSCR.
Hard money
10% down · 12.0% · 12mo
- Down + closing
- —
- Monthly P&I
- —
- Monthly cashflow
- —
- DSCR
- —
- Eligible?
- —
Short-term bridge; refi at stabilization.
HOA detail
- Monthly dues
- $40 · $480/yr
Listing history 17 events
-
2026-06-22days on market $304,990 Active 15 DOM
-
2026-06-19days on market $304,990 Active 13 DOM
-
2026-06-18days on market $304,990 Active 12 DOM
-
2026-06-17days on market $304,990 Active 11 DOM
-
2026-06-16days on market $304,990 Active 10 DOM
-
2026-06-15days on market $304,990 Active 9 DOM
-
2026-06-14days on market $304,990 Active 7 DOM
-
2026-06-13days on market $304,990 Active 6 DOM
-
2026-06-10days on market $304,990 Active 4 DOM
-
2026-06-09days on market $304,990 Active 3 DOM
-
2026-06-08days on market $304,990 Active 2 DOM
-
2026-06-07days on market $304,990 Active 1 DOM
-
2026-06-05days on market $304,990 Active 19 DOM
-
2026-06-02days on market $304,990 Active 17 DOM
-
2026-06-01days on market $304,990 Active 16 DOM
-
2026-05-31days on market $304,990 Active 15 DOM
-
2026-05-30days on market $304,990 Active 14 DOM
ⓘ Source: listings_history table (triggers on properties + properties_extension) + one-shot
backfill from property_details.listing_events for pre-trigger history.
Climate risk First Street
- Flood 1/10 Low FEMA zone X (unshaded) · 0% chance over 30 yrs
- Wildfire 3/10 Moderate
- Heat 5/10 Major 7 d/yr ≥104°F today · 15 d/yr by 30 yrs out
- Wind 5/10 Major 22% chance of damaging wind over 30 yrs
- Air quality 2/10 Low 1 unhealthy d/yr today · 1 by 30 yrs out
Nearby sold comps map
Loading sold comps map…
Walkable amenities ~0.75 mi
Loading nearby amenities…
Taxation est. · year 1
- Rental income
- $32,748
- − Mortgage interest
- −$17,084
- − Property taxes
- −$4,575
- − Insurance
- −$1,525
- − Repairs & maintenance
- −$2,620
- − Management
- −$2,620
- − HOA
- −$480
- − Depreciation
- −$8,872
- Taxable loss
- −$5,028
- Est. tax savings @ 24.0%
- +$1,207
- After-tax cash flow
- $1,305/yr
For passive investors: Depreciation is non-cash, so a rental often shows a tax loss while cash-flowing — sheltering income. Rental losses are passive: they offset passive income freely, and up to $25,000/yr can offset ordinary (W-2) income if you actively participate and your MAGI is under $100k (phasing out to $0 by $150k); unused losses carry forward. On sale, claimed depreciation is recaptured at up to 25%, and gains may owe capital-gains tax (a 1031 exchange can defer both). Figures are a year-1 estimate at your 24.0% rate — not tax advice; consult a CPA.
Condition & rehab AI · 2 photos
The property is in good condition with a well-maintained exterior and interior. It offers a seamless flow throughout each home, making it a good investment for both resale and rental purposes. Simple exterior and interior updates can significantly increase its value.
Value-add opportunities
- Both Paint the exterior siding — Painting the exterior siding can enhance the curb appeal and increase both resale and rental value.
- Both Landscaping improvements — Improving the landscaping can enhance the curb appeal and increase both resale and rental value.
- Both Interior updates — Updating the interior can enhance the living experience and increase both resale and rental value. The listing remarks suggest a thoughtfully designed home with a seamless flow, indicating a good interior condition.
Renovation cost estimate screening
Value-add ROI direction
- Both Paint the exterior siding — Painting the exterior siding can enhance the curb appeal and increase both resale and rental value. ↑
- Both Landscaping improvements — Improving the landscaping can enhance the curb appeal and increase both resale and rental value. ↑
- Both Interior updates — Updating the interior can enhance the living experience and increase both resale and rental value. The listing remarks suggest a thoughtfully designed home with a seamless flow, indicating a good interior condition. ↑
ⓘ Cost ranges are severity-bucket heuristics (US national rule-of-thumb). Get contractor quotes + a written scope before underwriting a rehab budget.
Schools (NCES district)
- District
- Alamance-Burlington Schools
- NCES district ID
- 3700030
- Math proficiency
- 30% ▼ -6.00%
- Reading proficiency
- 40% ▲ 2.00%
- Median HH income
- $43,359
- Composite
- 29.68/100
- National rank
- #6460
- State rank
- #133 of 178 in NC
Livability — Graham
- Score
- 69/100
- State rank
- #144
- US rank
- #8181
Category grades
Schools grade is shown separately in the Schools card above.
Census & demographics
- Census place
- Graham, NC
- County
- Alamance County · 173,369 people
- City population
- 33,114
- Metro
- Burlington, NC
- Population (ZIP)
- 33,114
- Household income
- $62,774
- Rent vs Own
- Severe rent burden
- 879.0
Population outlook (Alamance County) Hauer SSP2
- Today (2025)
- 173,381 people
- By 2030
- 180,609 · +4.2%
- By 2040
- 194,327 · +12.1%
- By 2050
- 206,158 · +18.9%
- By 2075
- 235,665 · +35.9%
- By 2100
- 258,626 · +49.2%
Race, ethnicity, and origin ACS 2023
- Neighborhood character
- Diverse neighborhood (Simpson 0.56)
- Race & ethnicity
- White 62% Hispanic / Latino 17% Black 16% Two or more races 9%
- Hispanic origin (detail)
- Mexican 10%
- Common ancestry
- Slovak 3% Romanian 2% Italian 1%
- Foreign-born
- 10% · Canada, Jamaica, Dominican Republic
- Languages at home
- 84% English-only · Spanish 13%
Political lean MEDSL · Alamance
- 2024 margin
- Lean R (+8.2) · D 45.4% · R 53.5% · Other 1.1%
- 2008→2024 swing
- +1.1pp toward D · 2008: -9.2pp · 2024: -8.2pp
- All cycles
- 2024: R+8.2 2020: R+8.4 2016: R+12.9 2012: R+14.1 2008: R+9.2
Not yet ingested
- Civics
- —
Market trends
- HPI YoY
- ▼ -103.91%
- Current HPI
- 200.155
- Rent YoY
- —
- Metro
- Burlington, NC
- State GDP YoY
- ▲ 3.28%
- F500 in state
- 26
Industry mix (Fortune 500 HQ in NC)
| Industry | F500 HQs | Revenue |
|---|---|---|
| Financial Services | 2 | $213B |
|
||
| Retail | 2 | $95B |
|
||
| Industrial Conglomerate | 1 | $38B |
|
||
| Metals / Steel | 1 | $35B |
|
||
| Utilities | 1 | $30B |
|
||
| Industrial Machinery | 1 | $19B |
|
||
Cash-flow waterfall
monthlySold comps — $/sqft
last 12 mo · ≤1 miLoading sold comps…