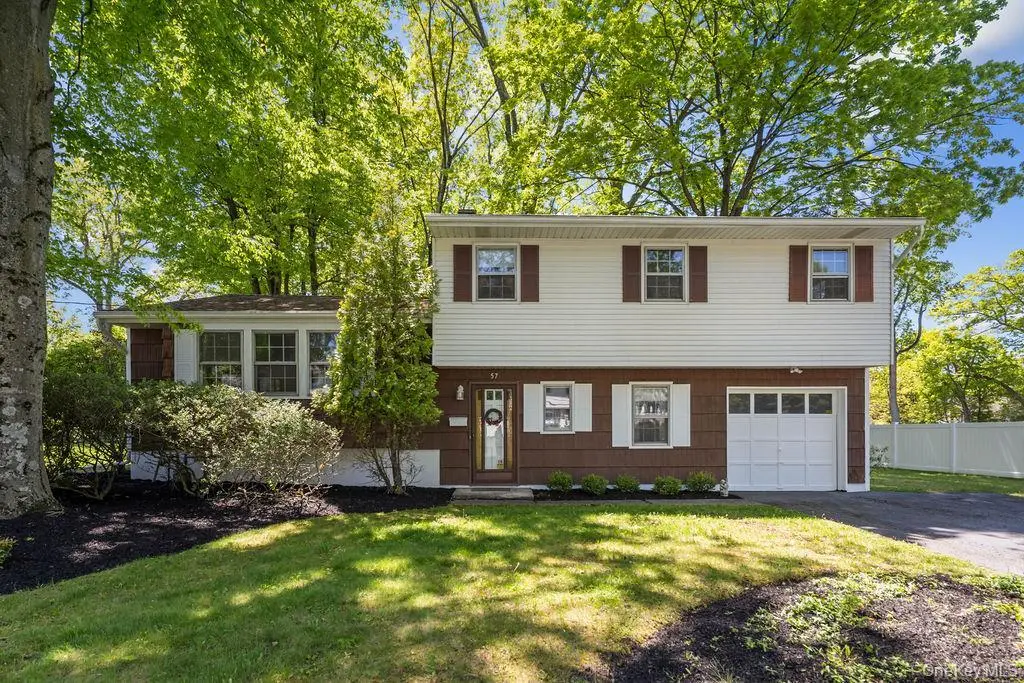
57 Gregory St · New City, NY
Flood risk 1/10 · Minimal
- FEMA flood zone
- X (unshaded)
- Chance of flooding over 30 yrs
- 0.0%
- Est. flood insurance / yr
- $473 – $860
Fire risk 1/10 · Minimal
- Est. fire insurance / yr
- $691 – $1,283
Heat risk 5/10 · Moderate
- Hot days now (above 99°F)
- 7 days/yr
- Hot days in 30 yrs
- 15 days/yr
Wind risk 4/10 · Minor
- Chance of severe wind over 30 yrs
- 24.0%
Air-quality risk 3/10 · Minor
- Unhealthy air days now
- 2 days/yr
- Unhealthy air days in 30 yrs
- 3 days/yr
Risk factors via First Street. Map © Google.
Why this score? — see what drove the D grade
The composite is a weighted blend of 9 inputs, each scored 0–100. Each bar is that input's sub-score; the figure is the points it added to the 100-point composite (weight × sub-score).
- ARV discount +13.8/15.0
- Cash flow +7.3/30.0
- Schools +6.9/10.0
- Livability +4.0/5.0
- 1% rule +2.6/10.0
- Rent growth +2.5/5.0
- Condition / age +2.5/5.0
- DSCR +1.5/10.0
- Appreciation +0.0/10.0
$699,000
🖨 Deal sheet 📄 Offer letter ✓ Due diligence
Listing remarks
Welcome home! Filled with timeless Old Style charm, this inviting home is ready for you to make it your own with just a few finishing touches. The walk-in level features a cozy den, private bedroom, full bath, and a bonus screened-in porch perfect for relaxing mornings or peaceful evenings. The main level offers an eat-in kitchen, spacious dining room, and oversized living room with large windows that flood the space with natural light. Beautiful hardwood floors run throughout, adding warmth and character to every room. Upstairs, you’ll find 3 spacious bedrooms and a full bath with access from the primary bedroom. Set on flat, park-like property, this charming home is a must-see!
Key facts
- Spacious dining room
- Eat-in kitchen
- Walk-in level
Tags
Property features AI
Exterior
- Parking: Attached garage and driveway; Total parking for 1 vehicle; 1-car garage
- Utilities: Electricity connected (Orange & Rockland); Natural gas connected; Public sewer; Public water connected; Phone connected; Trash collection (public)
- Home design: Single family residence
- Construction: Unfinished basement; Unfinished attic
- Exterior features: Clapboard siding; Not waterfront
Interior
- Kitchen: Appliances: Other
- Bedrooms: Includes a first-floor bedroom
- Flooring: Hardwood floors; Tile floors
- Bathrooms: 1 full bathroom; 1 half bathroom
- Heating & cooling: Forced air heating; Central air conditioning
- Interior features: First-floor bedroom; First-floor full bathroom; Patio
- Laundry & utility: Washer hookup; Gas dryer hookup
Neighborhood map
What this means for you Summary
Snapshot
- This is a 3-bed/1.5-bath single-family listed at $699k.
Deal economics
- At list price, monthly cash flow is $-920 ($-11k/yr) — negative.
- To cash-flow at today's rent, offer at most $536k (23.3% below list).
- To meet the 1% rule (rent ≥ 1% of price), the offer needs to be $529k (24.3% below list).
- Recommended offer: $529k (24.3% below list) — sets the bar for 1% rule.
- Cap rate 4.7% vs local median 2.8% in New City — top-decile yield for the area; either an underpriced asset or a hidden risk that comps aren't pricing in. Stress-test before assuming the spread holds.
Location & tenants
- Location reads 80/100 on livability (#111 in NY, #1,835 nationally) — a professional / high-income tenant draw. Strengths: schools A+, commute A+, employment A+; Watch: amenities F, cost of living F.
- Clarkstown Central School District (suburban): math 72% / reading 75% proficiency, ranked #66 of 590 in NY (top 11%) — strong family-tenant draw, lease renewals of 3-5y typical; only 8% free/reduced lunch — higher-income household profile.
- Market conditions: 182 active listings in the ZIP; 3 comparable units currently listed for rent nearby; rentals leasing fast (median 8d on market — plan ~1-2 weeks tenant-placement turnaround); 429 units permitted in Rockland County in 2024 (231 in 5+ unit buildings).
Forward outlook
- Local home prices are declining (-3.0%/yr); year-one equity from $5k of loan paydown is wiped out by about $21k of value loss. Plan a longer hold.
- Rockland County population projected at +7% by 2050 — modest demand growth; plan on rents tracking national, not racing it.
Negotiation context
- Only 14 days on market — expect competitive offers; lowballing is unlikely to land.
Risks & watch-outs
- Watch-outs: built in 1959 — expect roof / HVAC / electrical / plumbing capex.
- Climate carrying-cost: extreme-heat days projected 7→15/yr by 2055 (HVAC capex compounding) — expect insurance premiums to compound above CPI over the hold.
Questions for the listing agent
- What do current leases actually rent for vs. the listed asking? Can we see a recent rent roll and the last 12 months of T-12 income?
- Built in 1959 — when were the roof, HVAC, electrical panel, plumbing, and water heater last replaced?
- Is there a deadline driving the sale (1031 exchange, divorce, estate, relocation)? That informs how much negotiation room exists.
- Schools are A-rated — typically a magnet for longer-tenancy family renters. What's the average tenant stay here, and is there a school-zone premium baked into asking?
- The area grade is low — what's the realistic commute time and amenity access for the typical tenant pool here? Any planned neighborhood developments (good or bad) we should know about?
- What's the average days-on-market for RENTAL listings here right now (not sales)? A rising rental-DOM trend means longer vacancies and softer asking-rent achievability than the comps imply.
- What's the recent tenant-quality profile in this submarket — average credit score on applications, eviction rate, late-payment / NSF rate, and stable-employment percentage? A property-management company in the area should have these aggregated.
- How much new for-sale + rental construction is in the pipeline within 1–3 miles? Heavy new supply typically softens prices + rents 12–24 months out; constrained supply supports both.
Investment metrics
- 1% rule
- 0.76% ✗
- Cap rate
- 4.71%
- Cash-on-cash
- -5.64%
- DSCR
- 0.75
- GRM
- 11.0
CMA / ARV
- ARV (median comp)
- $813,192
- List price
- $699,000
- Delta
- -14.04%
- Verdict
- UNDERPRICED
- Comps
- 20 within 1.0 mi
Show comp detail 12 sales within ~0.75 mi
| Address | Dist | Beds/Ba | Sqft | Sold | Price | $/sf | Match |
|---|---|---|---|---|---|---|---|
| 16 Loraine Dr | 0.36mi | 3/2.0 | 1,742 (-2%) | 0mo | $858,000 | $493 | 77 |
| 4 Susan Dr | 0.34mi | 3/2.0 | 1,896 (+6%) | 6mo | $685,000 | $361 | 66 |
| 40 James St | 0.12mi | 4/2.0 (+1) | 1,620 (-9%) | 9mo | $663,000 | $409 | 65 |
| 31 Verdin Dr | 0.18mi | 4/2.5 (+1) | 1,976 (+11%) | 5mo | $755,000 | $382 | 60 |
| 74 Eberling Dr | 0.21mi | 4/2.5 (+1) | 1,932 (+8%) | 10mo | $735,000 | $380 | 59 |
| 52 Eberling Dr | 0.18mi | 3/2.5 | 1,628 (-9%) | 21mo | $665,000 | $408 | 56 |
| 19 Crestwood Dr | 0.63mi | 3/3.0 | 1,816 (+2%) | 8mo | $710,000 | $391 | 55 |
| 40 Lombardi Dr | 0.38mi | 4/2.5 (+1) | 1,900 (+6%) | 10mo | $860,000 | $453 | 54 |
| 22 Lombardi Dr | 0.42mi | 4/3.0 (+1) | 1,816 (+2%) | 20mo | $749,000 | $412 | 50 |
| 37 Havermill Rd | 0.63mi | 4/2.0 (+1) | 1,685 (-6%) | 11mo | $610,000 | $362 | 45 |
| 4 Wilton Cir | 0.63mi | 4/3.0 (+1) | 1,892 (+6%) | 11mo | $750,000 | $396 | 40 |
| 87 Joan Dr | 0.54mi | 4/2.5 (+1) | 2,038 (+14%) | 15mo | $795,000 | $390 | 30 |
Match score weights: distance 35% · size 25% · config 20% · recency 20%. Top-matched comps best support the ARV.
Projected returns pro-forma
-3.0% appreciation · 3.0% rent growth · sell at horizon
- IRR
- -25.9%
- Equity multiple
- 0.12×
- Total profit
- $-171,637
- Equity at exit
- $104,223
- IRR
- -22.4%
- Equity multiple
- -0.14×
- Total profit
- $-223,936
- Equity at exit
- $60,437
Cash invested: $195,720 (down + closing). Projections, not guarantees.
Landlord ↔ Tenant lean methodology
- Overall (STATE)
- 15 Strongly Tenant-Friendly
- State New York
- 15 Strongly Tenant-Friendly · D+10
- County
- — inherits STATE
- City
- — inherits STATE
ZIP-level market 10956
- Active inventory
- 182
- Price-to-rent
- 11.0×
Monthly cashflow live
- Estimated rent
- $5,291 medium interval (Pro) →
- Mortgage (P&I)
- −$3,666
- Tax from tax record
- −$1,143 /mo · $13,717/yr
- Insurance
- −$291
- HOA
- −$0
- Vacancy / Maint / Mgmt
- −$1,111
- Net cashflow
- $-920
Break-even live
UW: 25.0% down · 7.5% · 30yr · 1.5% tax · 5.0% vac · 8.0% maint · 8.0% mgmt
Financing live
Cash to close
- Down payment
- $174,750
- Closing costs
- $20,970
- Reserves months
- —
- Total cash needed
- —
Loan-product check · same deal, 3 products live
Conventional
25% down · 7.5% · 30yr
- Down + closing
- —
- Monthly P&I
- —
- Monthly cashflow
- —
- DSCR
- —
- Eligible?
- —
Personal DTI + credit; lowest rate.
DSCR
20% down · 8.5% · 30yr
- Down + closing
- —
- Monthly P&I
- —
- Monthly cashflow
- —
- DSCR
- —
- Eligible?
- —
No personal income docs; deal must DSCR.
Hard money
10% down · 12.0% · 12mo
- Down + closing
- —
- Monthly P&I
- —
- Monthly cashflow
- —
- DSCR
- —
- Eligible?
- —
Short-term bridge; refi at stabilization.
Rent comps 3 comps
| Address | Beds | Baths | Sqft | Rent | $/sqft | DOM | Units | Dist |
|---|---|---|---|---|---|---|---|---|
| 5 Dorchester Ave New City, NY | 4.0 | 3.0 | 2390 | $5,200 | $2.18 | 13d | 1 | 0.32mi |
| 16 Elmwood Dr New City, NY | 3.0 | 2.0 | 1250 | $4,925 | $3.94 | 7d | 1 | 0.59mi |
| 72 Schriever Ln New City, NY | 4.0 | 2.5 | 2296 | $6,000 | $2.61 | 3d | 1 | 0.85mi |
Listing history 1 events
-
2026-05-14$699,000 Active 694-char remark
ⓘ Source: listings_history table (triggers on properties + properties_extension) + one-shot
backfill from property_details.listing_events for pre-trigger history.
Tax reassessment forecast NY · Partial reset (capped growth)
- Current annual tax
- $13,717 · $1,143/mo
- Projected year-2 tax
- $13,717 · $1,143/mo
- Expected delta
- $0/yr ($0/mo · 0.0%)
ⓘ Screening estimate from a state-policy table — verify with the county assessor before closing.
Climate risk First Street
- Flood 1/10 Low FEMA zone X (unshaded) · 0% chance over 30 yrs
- Wildfire 1/10 Low
- Heat 5/10 Major 7 d/yr ≥99°F today · 15 d/yr by 30 yrs out
- Wind 4/10 Moderate 24% chance of damaging wind over 30 yrs
- Air quality 3/10 Moderate 2 unhealthy d/yr today · 3 by 30 yrs out
Nearby sold comps map
Loading sold comps map…
Walkable amenities ~0.75 mi
Loading nearby amenities…
Taxation est. · year 1
- Rental income
- $63,489
- − Mortgage interest
- −$39,155
- − Property taxes
- −$13,717
- − Insurance
- −$3,495
- − Repairs & maintenance
- −$5,079
- − Management
- −$5,079
- − Depreciation
- −$20,335
- Taxable loss
- −$23,371
- Est. tax savings @ 24.0%
- +$5,609
- After-tax cash flow
- $-5,435/yr
For passive investors: Depreciation is non-cash, so a rental often shows a tax loss while cash-flowing — sheltering income. Rental losses are passive: they offset passive income freely, and up to $25,000/yr can offset ordinary (W-2) income if you actively participate and your MAGI is under $100k (phasing out to $0 by $150k); unused losses carry forward. On sale, claimed depreciation is recaptured at up to 25%, and gains may owe capital-gains tax (a 1031 exchange can defer both). Figures are a year-1 estimate at your 24.0% rate — not tax advice; consult a CPA.
Schools (NCES district)
- District
- Clarkstown Central School District
- NCES district ID
- 3620340
- Math proficiency
- 72% ▼ -1.00%
- Reading proficiency
- 75% ▲ 6.00%
- Median HH income
- $115,765
- Composite
- 68.55/100
- National rank
- #342
- State rank
- #66 of 590 in NY
Livability — New City
- Score
- 80/100
- State rank
- #111
- US rank
- #1835
Category grades
Schools grade is shown separately in the Schools card above.
Census & demographics
- Census place
- New City, NY
- City population
- 31,420
- Population (ZIP)
- 31,420
Population outlook (Rockland County) Hauer SSP2
- Today (2025)
- 339,642 people
- By 2030
- 345,987 · +1.9%
- By 2040
- 357,178 · +5.2%
- By 2050
- 362,456 · +6.7%
- By 2075
- 367,281 · +8.1%
- By 2100
- 328,211 · -3.4%
Race, ethnicity, and origin ACS 2023
- Neighborhood character
- Diverse neighborhood (Simpson 0.60)
- Race & ethnicity
- White 58% Hispanic / Latino 19% Asian 13% Two or more races 10% Black 6%
- Hispanic origin (detail)
- Puerto Rican 7% Dominican 5%
- Common ancestry
- Romanian 4% Scotch-Irish 4% Italian 1%
- Foreign-born
- 23% · Canada, China, South Korea
- Languages at home
- 68% English-only · Spanish 13% Other Indo-European 5% Other Asian/Pacific 4%
Political lean MEDSL · Rockland
- 2024 margin
- R (+11.8) · D 44.1% · R 55.9%
- 2008→2024 swing
- -17.7pp toward R · 2008: 5.9pp · 2024: -11.8pp
- All cycles
- 2024: R+11.8 2020: D+1.7 2016: D+5.1 2012: D+6.6 2008: D+5.9
Not yet ingested
- Civics
- —
Market trends
- HPI YoY
- ▼ -530.90%
- Current HPI
- 261.6277
- Rent YoY
- —
- Metro
- —
- State GDP YoY
- ▲ 2.60%
- F500 in state
- 92
Industry mix (Fortune 500 HQ in NY)
| Industry | F500 HQs | Revenue |
|---|---|---|
| Financial Services | 10 | $950B |
|
||
| Consumer Goods | 9 | $162B |
|
||
| Insurance | 4 | $225B |
|
||
| Telecommunications | 2 | $144B |
|
||
| Pharmaceuticals | 2 | $112B |
|
||
| Media / Entertainment | 2 | $69B |
|
||
Price history
1 event — show timeline
- 2026-05-14 Listed $699,000 OneKey® MLS as Distributed by MLS Grid
Property tax history
+4.8%/yrLatest (2025): $13,717 · +3.2% YoY. Source: county tax records.
Cash-flow waterfall
monthlySold comps — $/sqft
last 12 mo · ≤1 miLoading sold comps…